Call Girls In Vasant Vihar Delhi 💯Call Us 🔝8264348440🔝
Colliers International: Retail Highlights Fall 2010
1. FALL 2010 | RETAIL
UNITED STATES
HIGHLIGHTS
Retail Slowly Getting Back to Normal
RoSS J. MooRE Chief Economist | USA
JARED DIENSTAg Regional Research Analyst
After a very challenging period, most shopping centers are starting to show rising occu-
MARkET INDIcAToRS
Relative to prior period pancy and a firming of rents. Helping shopping center owners is an economy that is once
again expanding and consumers who appear to have the confidence to go out and spend.
Fall Spring
2010 2011* While the U.S. retail landscape continues to exhibit disappointing fundamentals, some
segments are slowly beginning to show signs of life. Retail landlords and investors remain
VAcANcy
concerned about losing tenants, but not to the same degree as in 2009. Many landlords
NET ABSoRPTIoN have now turned their attention to attracting new tenants and filling vacancies created
during the economic downturn. Dominant regional malls and grocery-anchored neighbor-
coNSTRUcTIoN
hood centers continue to be the strongest performers, with outlet malls also enjoying a
RENTAl RATE period of strong demand. Power centers, lifestyle centers and community centers are still
*Projected struggling, but as with every downturn, the strongest centers continue to outperform their
peers. With development at a virtual standstill, however, vacancy rates for these three
retail formats should enjoy a modest decline.
U.S. RETAIl MARkET
The U.S. economy grew 2.5 percent in the third quarter, the fifth consecutive quarter of
SUMMARy STATISTIcS, Q3 2010 positive growth. Third quarter growth was up slightly from 1.7 percent annualized growth
reported during the second quarter. Much of the increase in GDP came from growth in
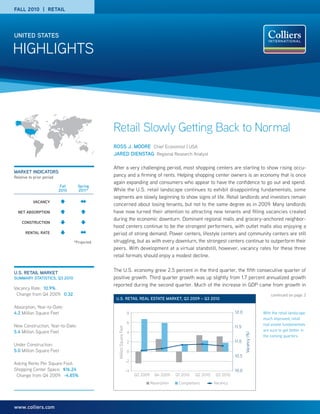
Vacancy Rate: 10.9%
Change from Q4 2009: 0.32 continued on page 3
U.S. RETAIl REAl ESTATE MARkET, Q3 2009 – Q3 2010
Absorption, Year-to-Date:
4.2 Million Square Feet 8 12.0 With the retail landscape
much improved, retail
6 real estate fundamentals
New Construction, Year-to-Date: 11.5
Million Square Feet
5.4 Million Square Feet are sure to get better in
4
Vacancy (%)
the coming quarters.
2 11.0
Under Construction:
5.0 Million Square Feet 0
10.5
-2
Asking Rents Per Square Foot:
Shopping Center Space: $16.24 -4 10.0
Change from Q4 2009: -4.85% Q3 2009 Q4 2009 Q1 2010 Q2 2010 Q3 2010
Absorption Completions Vacancy
www.colliers.com
3. HIGHLIGHTS | FALL 2010 | RETAIL | UNITED STATES
U.S. gRoSS DoMESTIc PRoDUcT gRoWTH, 2001 - 2011 in October after producing mixed results through the year. The CCI
8 declined from 53.5 in August to 48.6 in September, but then
7
6 increased in October to 50.2. The October reading is a bit higher
4
5
than the 49.8 reported in October 2009, but is off from the 2010
3 high of 63.3 reported in May.
Annual %, SAAR
2
1
0
-1
projected
With the benefit of hindsight, it is apparent that the improved read-
-2
-3 ings in the CCI earlier in the year came as consumers believed the
-4
-5 economy was more on the mend than it actually was. Relief that
-6
-7
the worst had passed was slowly replaced with nervousness
-8 about the challenges that lay ahead and the lack of sustainable job
2001 2002 2003 2004 2005 2006 2007 2008 2009 2010 2011
Source: IHS Global Insight
growth only reinforced people’s concerns.
consumer spending (2.8 percent), equipment and software (16.8 There have been months in which the CCI improved, yet consumer
percent), exports of goods and services (6.3 percent) and federal spending levels headed lower so it would be a mistake to draw too
government consumption expenditures and gross investment (4.0 close a parallel, but the general trend in consumer confidence is
percent). Final sales of domestic product came in at 1.2 percent, usually instructive as to where retail sales are going. There may
highlighting the tepid nature of the underlying economy. not be an exact relationship between the CCI and consumer
spending, but they are closely connected. In summary, it is highly
Although the economy continues to underperform, other indica- unlikely consumer confidence will significantly improve (translat-
tors displayed healthy growth. The Institute for Supply ing into stronger retail sales) until the labor market strengthens.
Management (ISM) reported a modest increase, rising 2.5 points
in October to register 56.9. According to the ISM index, new orders Without a doubt, the biggest challenge ahead for retailers and
(+7.8) and production (+6.2) rose significantly in October, a retail landlords is the hole left by the loss of 7.5 million jobs since
welcome sign and hopefully a harbinger of future growth. Of the the end of 2007. As this report went to press, the latest available
18 industries tracked within the ISM index, 14 reported growth, statistics indicated a 9.6 percent national unemployment rate in
highlighting the broad nature of the recovery in manufacturing. October. This figure was unchanged from September, but lower
However, it was not all good news, as supplier deliveries (-1.1), than the 10.2 percent reported in October 2009. On a positive
inventories (-1.7), and backlog of orders (-0.5) all went in reverse. note, holiday season hiring is expected to increase this year.
The Institute for Supply Management also reported a monthly HolIDAy SHoPPINg SEASoN PREVIEW
increase in the non-manufacturing sector, albeit at a slower pace October retail sales figures have been mostly positive, although
than the manufacturing sector. The October non-manufacturing growing at a relatively slow pace. The International Council of
index came in at 54.3, a 1.1 point increase over the prior month. Shopping Centers (ICSC) reported that October comparable chain
The primary categories that saw growth included
business activity (+5.6), new orders (+1.8), and prices coNSUMER coNFIDENcE SURVEy, 2002 - 2010
(+8.2). Despite overall growth, the survey is clouded
120
by mixed opinions regarding business conditions
varying by industry and company. Both the manufac- 100
turing sector and non-manufacturing sector indexes 80
were characterized by rising employment, at +1.2 and
Index
60
+0.7 respectively.
40
coNSUMER coNFIDENcE 20
The key to any significant bounce back in retail is 0
consumer confidence. The Conference Board’s 2002 2003 2004 2005 2006 2007 2008 2009 2010
Consumer Confidence Index (CCI) increased slightly Source: Conference Board, Nov. 2010
collIERS INTERNATIoNAl | P. 3
4. HIGHLIGHTS | FALL 2010 | RETAIL | UNITED STATES
RETAIl SAlES, lESS AUToS AND PARTS, JAN. 2001 - SEP. 2010 sales this year. The NRF predicts consumers will
12 spend $447.1 billion this holiday season. Last year,
10 sales rose slightly, increasing by 0.4 percent, after
Annual Percentage Change (%)
8
declining 3.9 percent in 2008, the worst holiday shop-
6
4 ping season in over 40 years. The NRF recently
2 released its annual Holiday Consumer Intentions and
0
Actions Survey, which found that consumers plan to
-2
-4 spend an average of $688.87 on their holiday shop-
-6 ping this year, up 1.0% from last year. Spending on
-8
gifts alone is projected to increase 2.1 percent from
-10
2001 2002 2003 2004 2005 2006 2007 2008 2009 2010 last year, for a total of $518.08.
Source: U.S. Census Bureau
It appears consumers are attempting to find the middle
store sales increased by 1.6 percent from October 2009. ICSC ground between the free spending years of the mid-2000s and the
estimates that November sales will show annualized growth of sharp pull-backs of 2008 and 2009. Although the recession is
three to four percent, with many retailers expected to begin holi- technically over, most consumers continue to think twice before
day marketing campaigns and sales earlier than usual. buying items that they do not consider to be necessities. With
SpendingPulse, a division of MasterCard, reported that year-over- unemployment remaining high, wage growth minimal and high
year total retail sales for October (excluding auto and gasoline) levels of personal debt, many consumers are simply not in a posi-
grew by 2.7 percent, with apparel sales (8.2 percent), luxury tion to increase their holiday spending. However, there is another
(excluding jewelry, 4.2 percent), and eCommerce (7.9 percent) segment of consumers who believe the worst is behind and that if
leading the way. It was disappointing, however, that the consumer they were going to lose their jobs, they would have done so by
electronics and appliances category declined by 3.1 percent. now. Members of this group have been conservative with their
spending for the last two years, but now feel they can increase
Following lackluster years in 2008 and 2009, the National Retail their spending this holiday season—just not to pre-recession levels.
Federation (NRF) is forecasting a 2.3 percent increase in holiday
Unlike in recent years, retailers appear to be better prepared to
yEAR-To-DATE SAlES ENDINg SEPTEMBER
manage inventory levels this holiday season in order to avoid large
ANNUAl quantities of unsold items. In the last few years retailers were
cATEgoRy 2010 2009 cHANgE (%)
forced to offer very steep after-holiday discounts to get unsold
All Stores 3,221,217 3,031,686 6.3
Motor Vehicle and Parts Dealers 573,561 525,291 9.2
items off their shelves. Since retailers feel they have a better idea
Gasoline Stations 322,027 273,507 17.7 of consumer spending this year, they are more likely to maintain
Food and Beverage Stores 436,104 426,214 2.3 profit margins and be in a better position financially as 2011
Grocery Stores 390,610 381,852 2.3
begins. Also, many retailers are aggressively opening pop-up loca-
Health and Personal Care Stores 194,348 188,378 3.2
Building Material and Garden 217,124 207,909 4.4 tions this holiday season as a method to increase sales and
Equipment Stores another way to move inventory.
General Merchandise Stores 432,031 419,573 3.0
Department Stores 126,893 127,791 -0.7
(excluding leased departments) We forecast improvement in holiday retail sales over last year,
Clothing and Accessories Stores 150,909 144,512 4.4 particularly in light of the relatively successful back-to-school
Furniture, Home Furnishings, Electronics 138,763 135,135 2.7
and Appliance Stores
shopping period. Although holiday sales will be a far cry from the
Furniture and Home Furnishing Stores 66,918 65,385 2.3 pre-recession years, a successful holiday season would be a great
Electronics and Appliance Stores 71,845 69,385 3.0 boost to retailers and the general economy and provide momen-
Sporting Goods, Hobby, Book and 60,925 58,760 3.7 tum going into 2011. Although most indicators point towards an
Music Stores
Miscellaneous Store Retailers 87,037 82,164 5.9 improved holiday shopping season, most consumers are focused
Nonstore Retailers 253,372 224,093 13.1 on taking advantage of retailers’ sales and promotions, trying to
Food Services and Drinking Places 355,016 346,150 2.6 purchase as much as possible without exceeding their budgets.
Source: U.S. Census Bureau. Overall, most retailers should come out of the holiday shopping
All values are expressed in millions of U.S. dollars and are not seasonally adjusted.
P. 4 | collIERS INTERNATIoNAl
5. HIGHLIGHTS | FALL 2010 | RETAIL | UNITED STATES
season with a modest increase in sales and a little more confident these markets have been able to weather the storm slightly better
about expansion and possibly new stores. because a majority of them have growing populations, positive
demographics and barriers to entry (new construction).
RETAIl SAlES By cATEgoRy
Year-to-date (YTD) sales to the end September rose 6.3% over the In many of these markets, expanding retailers have taken advan-
same period in 2009. However, this number was skewed by autos tage of vacant space that was returned to the market and as a
(and parts) and gasoline sales which expanded by 9.2% and 17.7% result prevented vacancy rates from skyrocketing. However, in
respectively. By comparison the bellwether general merchandise many cases the high number of retailers that have either gone
group registered YTD gains of 3.0%. Within the various retail out of business or closed locations has been too great for
sectors the most rapid growth (excluding autos, gasoline sales and expanding or new retailers to occupy all of the vacant space.
non-store retailers) were clothing and accessory stores along with Since each market has been impacted by different factors, recov-
building material and garden equipment stores with YTD growth of ery will vary in both timing and strength but a key theme running
4.4%. At the other end of the spectrum was department store sales through every market will be an upturn in housing and the
which contracted by 0.7% YTD. Posting modest growth were furni- creation of new jobs.
ture and home furnishing stores that saw YTD sales grow by 2.3%.
Grocery stores also saw YTD sales grow by 2.3%. occUPANcy gRoWTH/ABSoRPTIoN TRENDS
Year-to-date absorption through to the end of the third quarter
RETAIl VAcANcy registered 4.2 million square feet, a significant improvement from
Despite the fact that several major U.S. markets are beginning to last year when full year 2009 occupancy levels dropped by 17.1
see vacancy rates level off, or in some cases decline, the majority million square feet. Unlike last year, a majority (38) of the 53
of markets are still characterized by rising vacancies. Overall major markets tracked posted positive occupancy gains in the first
vacancy for the U.S. shopping center market at the end of the third nine months of 2010. By far, the Houston market recorded the
quarter stood at 10.90 percent, a modest increase from 10.58 greatest increase in occupancy with net absorption exceeding 1.7
percent recorded at the beginning of the year. Of 54 major U.S. million square feet. Including Houston, seven markets (Boston,
markets, 17 recorded vacancy of 12 percent or higher, up from 15 Denver, Ft. Lauderdale-Broward County, Miami/Dade County,
metros at the end of the fourth quarter of 2009. Detroit remains at Philadelphia, and St. Louis) recorded YTD net absorption in excess
the top of the list with a third quarter vacancy rate of 16.2 percent. of 300,000 square feet by the end of the third quarter. Much of
Other markets that reported vacancy greater than 15 percent the recorded occupancy gains came from national retailers who
include Atlanta, Las Vegas, Phoenix, and Reno. Detroit’s economy have been increasing their market share by opening new locations
has been battered by the fall of the automotive industry, while the at sites that were previously thought unattainable. Although posi-
others were significantly impacted by the collapse of the residen- tive absorption clearly does not guarantee a healthy market, it is
tial real estate market. Booming housing markets caused retailers encouraging that many markets are now characterized by occu-
to open up new stores and led to a jump in retail construction. As pancy gains and not contraction.
foreclosures picked up and residential property values fell sharply,
once-full shopping centers witnessed significant blocks of space Despite overall positive absorption, there were still markets that saw
become vacant. Until the housing market stabilizes and unemploy- negative absorption. Atlanta, Chicago, Dallas/Fort Worth, Louisville,
ment declines, vacancy rates are likely to remain high in these and Phoenix all saw occupied space contract by more than 300,000
markets. Cities that recorded a 100 basis point increase or more in square feet. Several of these markets were some of the hardest-hit
vacancy during the January – September period were Charlotte, regions in the housing collapse, with a resulting collapse in demand
Kansas City, Las Vegas, Phoenix, and Seattle/Puget Sound. On a for retail space. Markets that registered negative absorption have
positive note, 16 markets reported a decline in vacancy. However, not been aided by national retailers’ increasing their presence or the
only two (Columbus and Houston) experienced a decrease of creation of “mom and pop” shops and regional retailers that have
more than 100 basis points during the same period. typically been a key source of demand.
Of the 20 markets that have vacancy rates lower than 10 percent, RETAIl coNSTRUcTIoN
18 are located on either the East or West coasts, with only two With most major markets oversupplied, and demand for retail
markets (Little Rock and Minneapolis) being non-coastal. Most of space still relatively tepid, it comes as no surprise that new retail
collIERS INTERNATIoNAl | P. 5
6. HIGHLIGHTS | FALL 2010 | RETAIL | UNITED STATES
construction remains soft. New retail develop- U.S. RETAIl REAl ESTATE INVESTMENT PERFoRMANcE, 1999 - 2010
ments added to the market in the first three
60.0
quarters of 2010 totaled just 5.5 million square 46.8
feet, compared to 25.1 million square feet in 40.0
40.0
30.4 29.0
2009. Of the 54 major markets tracked, three 27.2 28.3**
Annual Total Returns %
21.1 17.1 23.0 20.0
20.0 18.0
added in excess of 300,000 square feet; Los 9.6
13.7 11.8 13.4 13.5
7.8 6.7 7.5*
Angeles, Northern New Jersey, and Philadelphia. 0.0
Both Los Angeles and Northern New Jersey -4.1
-11.8 -11.9
recorded single-digit vacancy rates with -20.0
-15.8
Philadelphia just above 10 percent (10.1 percent).
-40.0
More markets than not (36) have added less
-48.4
than 100,000 square feet to the market thus far -60.0
1999 2000 2001 2002 2003 2004 2005 2006 2007 2008 2009 2010
in 2010, compared to only six markets in 2009.
* YTD 2nd Quarter returns only
Private Equity Public Equity ** YTD Oct returns
With regard to projects under construction at the Source: National Council of Real Estate Investment Fiduciaries,
National Association of Real Estate Investment Trusts
end of the third quarter, the total for all markets
was only 5.0 million square feet. Only three
markets (Atlanta, Los Angeles, and Washington, DC) have over $17.07 per square foot at the beginning of the year - a drop of
300,000 square feet under construction. Developers remain 4.85 percent. Markets that experienced the sharpest declines
content to wait on the sidelines for the retail market to pick up include Las Vegas (-16.14 percent), Los Angeles-Inland Empire
before they proceed with any new centers. A combination of little (-13.48 percent), and Houston (-10.03 percent). Although asking
demand and a very challenging financing environment will keep rental rates have declined almost 5.0 percent across the country,
new retail projects to a minimum for the next few years. Similar to it is more accurate to emphasize that actual rental rates (after
the office market, going forward most retail projects that do get concessions) have dropped anywhere from 10.0 to 20.0 percent,
underway will have to secure pre-leasing commitments prior to depending on the market. Not all markets recorded declines:
breaking ground which should help to prevent large vacancies Charlotte, Columbus, Minneapolis, San Francisco, San Jose/South
developing any time soon. Bay, St. Louis, and Washington, DC all experienced an increase in
asking rental rates during the first three quarters of the year.
RENTAl RATE TRENDS
As expected, the majority (37) of the 54 surveyed markets During 2009 and the beginning of 2010, not only did landlords
recorded rental rate declines during the first nine months of 2010. lower asking rental rates for new leases, but both local “mom and
A significant portion (15 markets) experienced a decline of at least pop” shops and national retailers asked landlords for rent relief on
5.0 percent. As at the end of the third quarter, the annual average existing leases; and in most cases, compromises were reached.
asking rental rate was $16.24 per square foot, compared with However, with retail conditions on the upswing reducing rents on
existing leases has largely come to an end. Most landlords agreed
RETAIl SPAcE DElIVERIES, 2000 - 2011
to reduce rental rates on existing leases because the fear of losing
250
tenants far outweighed income loss from lower rental rates.
Landlords already had to worry about filling vacancies left by
200 tenants that could not be saved by reducing rent, so if they could
Squore Feet, Millions
prevent further vacancies, they were mostly willing to negotiate
150 with retailers. The consensus now is that retailers that required
rent relief on existing leases have already received it. However,
100
leasing dynamics still remain in the tenants’ favor with the econ-
50
omy far from robust and consumer spending remaining relatively
fragile, landlords are still being pressured to lower rents and offer
0 generous tenant improvements (TI’s). Because of high vacancy, a
2000 2001 2002 2003 2004 2005 2006 2007 2008 2009 2010 2011*
lack of expanding retailers, and the extremely low number of new
Source: CoStar *projected
retail businesses being formed, tenants have plenty of leverage
P. 6 | collIERS INTERNATIoNAl
7. HIGHLIGHTS | FALL 2010 | RETAIL | UNITED STATES
when negotiating lease terms with landlords. Retailers also hold signed long-term leases with regular rent increases. Another
most of the power in renewals: in order to prevent tenants from retail property type that should see an increase in activity does not
leaving their current space, landlords are being forced to offer have a label, but are generally 5,000 to 10,000 square feet and
competitive lease terms on renewals. However, top tier shopping contain multiple tenants (typically three to five), at least two-thirds
centers where retailers continue to report high sales have been of which are national tenants. These are attractive to investors
largely immune to this trend of concessions and lower lease rates. because most of these tenants signed long-term leases with regu-
lar rent increases, similar to single-tenant triple-net leased prop-
lookINg AHEAD erties. As for shopping centers, grocery-anchored neighborhood
Retail has always been highly sensitive to the economic cycle, and centers are expected to account for most retail properties trading
in particular employment, but this has probably never been more hands as investors look to purchase properties that are well-
true. Consumers remain cautious and until a more robust recovery leased and easiest to fill if vacancy occurs. The overall volume of
takes hold, are unlikely to return to their spendthrift ways. As a sales transactions is expected to increase by at least 20% in 2011
result, retailers will be highly selective when opening new stores as more investors return to the market in search of yield and the
and are likely to only pursue what they consider the “best real stable nature of retail real estate.
estate” in the market. Although some consumers are slowly
increasing their spending, believing the worst is over, a large S&P RETAIl INDEX (RlX), NoV. 2007 - NoV. 2010
segment of the population still is not ready to splurge on unneces-
500
sary items. In the meantime, retail sales will fluctuate month-to- 475
month, with most retailers reporting moderate year-over-year 450
425
increases. Core properties located in well-populated areas are 400
375
expected to see increased foot traffic and sales, while centers that 350
Index
were built in communities based on future housing development 325
300
will see little improvement anytime soon. 275
250
225
Although credit markets have been slow to loosen up, it is encour- 200
175
aging to see more lending institutions open to investing in 150
commercial real estate. Unlike the pre-recession years when lend- 2007 2008 2009 2010
ers were quick to provide debt capital, financing will primarily only Source: MarketWatch.com
be available for core assets that do not pose any significant degree
of risk. Even though lenders are expected to be more accommoda-
tive in 2011 than in recent years, they will remain very selective in We expect retail vacancies to be marginally lower by the spring as
which properties they lend against, following strict underwriting occupancy gains should exceed any new supply that comes on to
standards. Poorer quality properties will continue to sit on the the market. Although each market should be viewed separately,
market as the sellers of these properties find it difficult to attract average asking rental rates across the country will most likely be
buyers (and lenders) willing to take on the risks associated with flat at least through to the middle of 2011, while construction will
investing in non-core assets. continue to decline for the foreseeable future. Retailers that
survived the recession will continue to focus on increasing their
We anticipate the sales market will remain dominated by prime market share as they take advantage of low lease rates offered by
real estate occupied by well known retailers, preferably with landlords who are extremely motivated to fill large vacancies.
strong credit ratings. Single-tenant triple-net leased properties Landlords of specialty or themed centers will look to reposition
are sure to remain in high demand also. Triple-net properties were their properties by attracting tenants that are expanding in what
the first retail property type to witness a drop in cap rates and are can only be described as a very “challenging” leasing environ-
more than likely to continue leading cap rates lower. Strong retail ment. Discount stores, athletic gyms, apparel discounters, grocery
properties are sure to continue attracting multiple bids and occa- stores, and quick-service restaurants are almost certain to be the
sionally command sale prices higher than the asking price. Single dominant retailers active in the marketplace. Progress is likely to
tenant triple-net leased properties in particular will continue to be be slow but the retail landscape will almost certainly look better as
highly sought after because they offer investors a low-risk invest- 2011 unfolds. There will be no easy fixes and unfortunately a
ment through tenants who typically have strong credit and have “rising tide will not raise all boats.”
collIERS INTERNATIoNAl | P. 7