November 2014 Market Watch Report
•
0 j'aime•363 vues

See what's happening in the real estate market!

Recommandé
Recommandé
Contenu connexe
En vedette
En vedette (9)
Dernier
Dernier (20)
November 2014 Market Watch Report
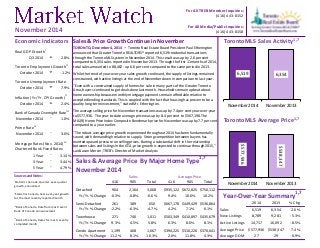
- 1. Sales & Price Growth Continue in November TORONTO, December 4, 2014 – Toronto Real Estate Board President Paul Etherington announced that Greater Toronto REALTORS® reported 6,519 residential transactions through the TorontoMLS system in November 2014. This result was up by 2.6 per cent compared to 6,354 sales reported in November 2013. Through the first 11 months of 2014, total sales amounted to 88,462 - up 6.6 per cent compared to the same period in 2013. While the trend of year-over-year sales growth continued, the supply of listings remained constrained, with active listings at the end of November down in comparison to last year. "Even with a constrained supply of homes for sale in many parts of the Greater Toronto Area, buyers continued to get deals done last month. Households remain upbeat about home ownership because monthly mortgage payments remain affordable relative to accepted lending standards. This is coupled with the fact that housing has proven to be a quality long-term investment," stated Mr. Etherington. The average selling price for November transactions was up by 7.4 per cent year-over-year to $577,936. The year-to-date average price was up by 8.4 per cent to $567,198. The MLS(R) Home Price Index Composite Benchmark price for November was up by 7.7 per cent compared to a year earlier. "The robust average price growth experienced throughout 2014 has been fundamentally sound, with demand high relative to supply. Strong competition between buyers has exerted upward pressure on selling prices. Barring a substantial shift in the relationship between sales and listings in the GTA, price growth is expected to continue through 2015," said Jason Mercer, TREB's Director of Market Analysis. 6,519 6,354 November 2014 November 2013 $577,936 $538,347 November 2014 November 2013 For All TREB Member Inquiries: (416) 443-8152 For All Media/Public Inquiries: November 2014 (416) 443-8158 Real GDP Growthi Q3 2014 t 2.8% Toronto Employment Growthi i October 2014 u -1.2% Toronto Unemployment Rate October 2014 u 7.9% Inflation (Yr./Yr. CPI Growth)i i October 2014 t 2.4% Bank of Canada Overnight Rateiii November 2014 q 1.0% Prime Rateiv November 2014 q 3.0% Mortgage Rates (Nov. 2014)iv Chartered Bank Fixed Rates 1 Year q 3.14% 3 Year q 3.44% 5 Year q 4.79% Sources and Notes: Economic Indicators iStatistics Canada, Quarter-over-quarter growth, annualized iiStatistics Canada, Year-over-year growth for the most recently reported month iiiBank of Canada, Rate from most recent Bank of Canada announcement ivBank of Canada, Rates for most recently completed month Sales & Average Price By Major Home Type1,7 416 905 Total 416 905 Total Detached 904 2,164 3,068 $935,122 $672,825 $750,112 Yr./Yr. % Change -0.3% -0.8% -0.6% 9.4% 10.6% 10.2% Semi-Detached 261 389 650 $667,178 $449,429 $536,864 Yr./Yr. % Change -2.2% -6.3% -4.7% 4.2% 7.1% 6.1% Townhouse 271 740 1,011 $503,349 $410,897 $435,679 Yr./Yr. % Change 9.3% 4.5% 5.8% 6.3% 8.6% 8.1% Condo Apartment 1,199 468 1,667 $394,225 $310,220 $370,641 Yr./Yr. % Change 11.2% 8.1% 10.3% 2.0% 11.8% 4.3% November 2014 Sales Average Price 2014 2013 % Chg. Sales 6,519 6,354 2.6% New Listings 8,789 9,281 -5.3% Active Listings 14,717 16,092 -8.5% Average Price $577,936 $538,347 7.4% Average DOM 27 29 -6.9% Year-Over-Year Summary1,7 TorontoMLS Sales Activity1,7 TorontoMLS Average Price1,7
- 2. Price Range Detached Semi-Detached Att/Row/Twnhouse Condo Townhouse Condo Apt Link Co-op Apt Det Condo Co-ownership Apt Total $0 to $99,999 2 0 1 2 9 0 1 0 0 15 $100,000 to $199,999 18 3 2 27 147 0 5 0 2 204 $200,000 to $299,999 103 35 24 108 547 8 1 0 3 829 $300,000 to $399,999 331 109 146 169 475 30 1 2 0 1,263 $400,000 to $499,999 433 197 154 132 249 10 1 1 0 1,177 $500,000 to $599,999 530 148 90 28 100 17 1 1 0 915 $600,000 to $699,999 437 70 43 17 62 21 1 1 0 652 $700,000 to $799,999 319 40 21 11 21 13 1 0 0 426 $800,000 to $899,999 224 15 7 7 14 0 0 0 0 267 $900,000 to $999,999 154 12 6 2 7 1 0 0 0 182 $1,000,000 to $1,249,999 197 6 6 5 18 0 0 0 1 233 $1,250,000 to $1,499,999 117 7 1 1 6 0 0 0 0 132 $1,500,000 to $1,749,999 89 3 1 0 7 0 0 0 0 100 $1,750,000 to $1,999,999 31 3 0 0 2 0 0 0 0 36 $2,000,000 + 83 2 0 0 3 0 0 0 0 88 Total Sales 3,068 650 502 509 1,667 100 12 5 6 6,519 Share of Total Sales 47.1% 10.0% 7.7% 7.8% 25.6% 1.5% 0.2% 0.1% 0.1% - Average Price $750,112 $536,864 $481,428 $390,559 $370,641 $507,173 $310,125 $465,000 $360,833 $577,936 Price Range Detached Semi-Detached Att/Row/Twnhouse Condo Townhouse Condo Apt Link Co-op Apt Det Condo Co-ownership Apt Total $0 to $99,999 18 1 2 21 101 0 5 0 3 151 $100,000 to $199,999 328 35 9 358 1,938 1 34 1 11 2,715 $200,000 to $299,999 1,648 463 464 1,632 6,639 169 24 7 28 11,074 $300,000 to $399,999 4,441 1,627 1,995 2,433 6,364 305 13 30 15 17,223 $400,000 to $499,999 6,895 2,910 2,161 1,493 2,875 218 15 18 1 16,586 $500,000 to $599,999 7,402 2,065 1,263 384 1,250 286 6 15 3 12,674 $600,000 to $699,999 6,234 984 617 181 657 283 8 10 0 8,974 $700,000 to $799,999 4,440 467 294 130 285 106 2 2 0 5,726 $800,000 to $899,999 3,252 303 108 54 118 14 2 1 0 3,852 $900,000 to $999,999 2,078 192 54 25 97 2 2 2 0 2,452 $1,000,000 to $1,249,999 2,610 116 67 32 127 1 1 1 1 2,956 $1,250,000 to $1,499,999 1,432 55 25 8 72 0 0 0 0 1,592 $1,500,000 to $1,749,999 802 33 5 5 36 0 0 0 0 881 $1,750,000 to $1,999,999 459 14 2 2 20 0 0 0 0 497 $2,000,000 + 1,023 25 3 3 54 0 0 1 0 1,109 Total Sales 43,062 9,290 7,069 6,761 20,633 1,385 112 88 62 88,462 Share of Total Sales 48.7% 10.5% 8.0% 7.6% 23.3% 1.6% 0.1% 0.1% 0.1% - Average Price $722,344 $527,192 $477,290 $377,363 $361,808 $494,149 $330,423 $488,908 $279,248 $567,198 SALES BY PRICE RANGE AND HOUSE TYPE1,7 NOVEMBER 2014 SALES BY PRICE RANGE AND HOUSE TYPE1,7 YEAR-TO-DATE, 2014 Market Watch, November 2014 2 Toronto Real Estate Board
- 3. ALL HOME TYPES, NOVEMBER 2014 ALL TREB AREAS Number of Sales Dollar Volume1 Average Price1 Median Price1 New Listings2 SNLR (Trend)8 Active Listings3 Mos. Inv. (Trend)9 Avg. SP/LP4 Avg. DOM5 TREB Total 6,519 $3,767,564,445 $577,936 $477,000 8,789 59.5% 14,717 2.2 99% 27 Halton Region 501 $306,858,279 $612,492 $519,000 599 64.4% 1,216 2.1 97% 31 Burlington 118 $70,809,400 $600,080 $527,500 127 67.5% 284 2.3 97% 41 Halton Hills 61 $31,102,500 $509,877 $490,000 78 65.6% 173 2.2 99% 33 Milton 149 $70,386,739 $472,394 $460,000 163 67.1% 221 1.5 99% 22 Oakville 173 $134,559,640 $777,801 $678,000 231 60.8% 538 2.4 97% 30 Peel Region 1,310 $636,338,164 $485,754 $436,500 1,733 58.7% 2,772 2.2 98% 28 Brampton 521 $231,862,943 $445,034 $415,000 737 60.2% 965 1.9 98% 25 Caledon 63 $38,225,500 $606,754 $538,500 73 56.9% 208 3.5 96% 52 Mississauga 726 $366,249,721 $504,476 $450,000 923 57.7% 1,599 2.2 98% 29 City of Toronto 2,661 $1,639,522,493 $616,130 $490,800 3,823 56.2% 6,296 2.4 99% 26 York Region 1,112 $807,761,055 $726,404 $640,850 1,535 59.3% 2,672 2.2 98% 28 Aurora 61 $37,822,200 $620,036 $538,250 82 64.0% 139 2.1 97% 29 E. Gwillimbury 24 $13,879,600 $578,317 $536,500 35 65.9% 68 2.5 98% 36 Georgina 66 $24,437,250 $370,261 $372,500 80 66.2% 144 2.3 98% 34 King 23 $26,823,149 $1,166,224 $850,000 42 41.6% 174 6.1 96% 41 Markham 308 $231,876,503 $752,846 $682,500 402 62.1% 591 1.8 99% 25 Newmarket 81 $43,824,179 $541,039 $505,000 104 70.7% 145 1.4 99% 21 Richmond Hill 227 $174,143,909 $767,154 $697,000 337 55.5% 553 2.3 99% 28 Vaughan 270 $219,435,490 $812,724 $699,950 393 55.0% 716 2.4 97% 28 Whitchurch-Stouffville 52 $35,518,775 $683,053 $603,400 60 62.8% 142 2.6 97% 33 Durham Region 740 $299,104,804 $404,196 $370,000 893 69.8% 1,094 1.5 99% 23 Ajax 132 $59,604,763 $451,551 $409,000 170 74.7% 121 1.0 99% 17 Brock 20 $5,808,000 $290,400 $235,500 22 55.3% 73 5.2 96% 66 Clarington 107 $37,361,590 $349,174 $332,000 145 67.8% 194 1.6 98% 21 Oshawa 187 $57,149,199 $305,611 $300,000 222 70.4% 231 1.3 99% 20 Pickering 90 $44,704,100 $496,712 $447,450 125 69.2% 146 1.4 99% 20 Scugog 26 $13,151,600 $505,831 $427,000 32 59.8% 87 3.5 97% 61 Uxbridge 30 $18,185,400 $606,180 $545,000 31 61.4% 101 4.0 96% 43 Whitby 148 $63,140,152 $426,623 $400,000 146 72.3% 141 1.2 99% 17 Dufferin County 50 $17,854,050 $357,081 $328,500 42 64.5% 131 3.0 98% 40 Orangeville 50 $17,854,050 $357,081 $328,500 42 64.5% 131 3.0 98% 40 Simcoe County 145 $60,125,600 $414,659 $375,000 164 60.5% 536 3.4 97% 50 Adjala-Tosorontio 14 $7,515,400 $536,814 $441,000 12 54.4% 66 5.4 96% 60 Bradford West Gwillimbury 37 $17,409,100 $470,516 $455,000 39 59.5% 124 2.7 97% 49 Essa 13 $5,458,000 $419,846 $376,000 18 66.2% 56 3.1 97% 86 Innisfil 36 $14,150,300 $393,064 $347,500 61 54.2% 179 4.0 96% 48 New Tecumseth 45 $15,592,800 $346,507 $323,000 34 68.1% 111 3.2 97% 39 SUMMARY OF EXISTING HOME TRANSACTIONS ! TURN PAGE FOR CITY OF TORONTO TABLES OR CLICK HERE: Market Watch, November 2014 3 Toronto Real Estate Board
- 4. Market Watch, November 2014 Page 3 July 2010 4 Toronto Real Estate Board ALL HOME TYPES, NOVEMBER 2014 CITY OF TORONTO MUNICIPAL BREAKDOWN Number of Sales Dollar Volume1 Average Price1 Median Price1 New Listings2 SNLR (Trend)8 Active Listings3 Mos. Inv. (Trend)9 Avg. SP/LP4 Avg. DOM5 TREB Total 6,519 $3,767,564,445 $577,936 $477,000 8,789 59.5% 14,717 2.2 99% 27 City of Toronto Total 2,661 $1,639,522,493 $616,130 $490,800 3,823 56.2% 6,296 2.4 99% 26 Toronto West 656 $338,531,228 $516,054 $464,000 916 57.4% 1,563 2.4 100% 28 Toronto W01 45 $28,384,490 $630,766 $600,000 74 52.8% 111 2.7 103% 19 Toronto W02 55 $36,729,535 $667,810 $625,000 67 70.4% 90 1.3 104% 22 Toronto W03 65 $31,447,689 $483,811 $465,000 93 59.9% 97 1.6 101% 21 Toronto W04 67 $27,936,959 $416,970 $384,000 76 62.3% 124 2.1 99% 27 Toronto W05 82 $32,380,950 $394,890 $435,250 101 61.6% 188 2.5 98% 32 Toronto W06 104 $54,784,700 $526,776 $485,000 175 45.4% 360 3.7 99% 34 Toronto W07 21 $14,686,400 $699,352 $715,000 23 72.1% 33 1.2 102% 15 Toronto W08 113 $71,066,005 $628,903 $460,000 164 54.8% 335 2.7 98% 29 Toronto W09 43 $18,787,900 $436,928 $430,000 40 61.7% 71 2.2 98% 30 Toronto W10 61 $22,326,600 $366,010 $415,000 103 59.3% 154 2.4 98% 30 Toronto Central 1,231 $903,432,500 $733,901 $490,000 1,969 50.6% 3,686 2.9 98% 29 Toronto C01 346 $168,960,445 $488,325 $411,000 602 44.6% 1,203 3.7 98% 32 Toronto C02 63 $76,537,579 $1,214,882 $989,000 95 48.5% 209 3.7 98% 30 Toronto C03 39 $38,570,600 $988,990 $671,000 77 55.7% 111 2.3 99% 26 Toronto C04 78 $99,657,678 $1,277,663 $1,135,000 125 55.9% 176 2.2 99% 20 Toronto C06 31 $19,946,165 $643,425 $659,990 41 49.9% 93 3.2 99% 30 Toronto C07 87 $61,772,100 $710,024 $488,000 140 51.8% 256 2.9 98% 28 Toronto C08 131 $63,018,049 $481,054 $410,000 202 53.9% 334 2.6 99% 31 Toronto C09 24 $33,264,400 $1,386,017 $1,192,500 32 54.4% 82 2.8 97% 36 Toronto C10 54 $40,843,938 $756,369 $649,900 95 60.7% 116 1.9 101% 22 Toronto C11 28 $16,186,088 $578,075 $381,000 43 71.5% 51 1.4 101% 25 Toronto C12 30 $64,684,100 $2,156,137 $1,985,000 48 48.0% 147 4.0 96% 32 Toronto C13 72 $58,673,959 $814,916 $572,500 83 65.1% 103 1.6 100% 21 Toronto C14 150 $103,292,324 $688,615 $435,400 218 45.5% 483 3.4 97% 34 Toronto C15 98 $58,025,075 $592,093 $457,500 168 54.4% 322 2.5 99% 26 Toronto East 774 $397,558,765 $513,642 $505,000 938 66.9% 1,047 1.4 101% 21 Toronto E01 60 $39,888,186 $664,803 $632,750 80 69.5% 69 1.1 105% 17 Toronto E02 59 $43,690,664 $740,520 $715,000 65 67.5% 73 1.2 102% 17 Toronto E03 84 $52,282,894 $622,415 $610,500 108 68.2% 90 1.0 103% 17 Toronto E04 81 $34,973,950 $431,777 $465,000 98 68.2% 100 1.4 100% 20 Toronto E05 79 $38,718,039 $490,102 $423,000 88 70.9% 88 1.1 102% 20 Toronto E06 53 $28,804,740 $543,486 $512,000 54 59.3% 54 1.5 101% 18 Toronto E07 78 $34,203,600 $438,508 $368,500 109 62.8% 154 1.8 101% 25 Toronto E08 55 $28,152,400 $511,862 $498,000 73 65.3% 79 1.7 99% 21 Toronto E09 116 $48,336,588 $416,695 $455,500 115 65.7% 165 1.7 100% 26 Toronto E10 41 $21,982,701 $536,163 $541,500 67 65.4% 84 1.7 100% 21 Toronto E11 68 $26,525,003 $390,074 $395,000 81 70.4% 91 1.4 100% 23 SUMMARY OF EXISTING HOME TRANSACTIONS
- 5. ALL HOME TYPES, YEAR-TO-DATE 2014 ALL TREB AREAS Number of Sales Dollar Volume1 Average Price1 Median Price1 New Listings2 Avg. SP/LP4 Avg. DOM5 TREB Total 88,462 $50,175,443,533 $567,198 $475,000 151,535 99% 24 Halton Region 7,446 $4,640,460,814 $623,215 $530,000 11,812 98% 25 Burlington 1,497 $837,381,344 $559,373 $495,000 2,276 98% 30 Halton Hills 966 $485,610,887 $502,703 $467,250 1,512 98% 25 Milton 2,127 $1,044,592,983 $491,111 $458,000 3,231 99% 20 Oakville 2,856 $2,272,875,601 $795,825 $682,500 4,793 98% 26 Peel Region 18,540 $9,003,124,688 $485,605 $441,000 32,080 98% 24 Brampton 7,920 $3,514,676,557 $443,772 $420,000 13,293 98% 23 Caledon 889 $544,007,584 $611,932 $560,000 1,576 97% 37 Mississauga 9,731 $4,944,440,547 $508,112 $459,000 17,211 98% 24 City of Toronto 33,174 $20,315,703,280 $612,398 $485,000 60,078 100% 24 York Region 16,215 $11,089,853,010 $683,926 $620,000 27,958 99% 23 Aurora 883 $575,130,127 $651,336 $576,000 1,400 98% 23 E. Gwillimbury 345 $204,194,690 $591,869 $510,000 528 97% 36 Georgina 855 $315,665,855 $369,200 $354,000 1,309 98% 30 King 312 $299,675,861 $960,500 $830,000 776 96% 47 Markham 4,510 $3,194,883,990 $708,400 $652,000 7,416 100% 21 Newmarket 1,402 $743,234,925 $530,125 $505,000 2,014 99% 21 Richmond Hill 3,347 $2,541,533,472 $759,347 $700,000 6,212 99% 22 Vaughan 3,763 $2,690,707,364 $715,043 $651,500 7,017 98% 23 Whitchurch-Stouffville 798 $524,826,728 $657,678 $590,000 1,286 98% 28 Durham Region 10,367 $4,064,139,687 $392,027 $365,000 15,081 99% 20 Ajax 1,908 $818,903,136 $429,195 $401,500 2,563 99% 16 Brock 196 $56,459,463 $288,058 $251,000 354 96% 57 Clarington 1,682 $571,625,938 $339,849 $320,000 2,504 99% 22 Oshawa 2,596 $807,036,459 $310,877 $295,000 3,781 99% 18 Pickering 1,323 $620,259,056 $468,828 $435,000 1,956 99% 18 Scugog 341 $149,334,812 $437,932 $404,000 587 97% 43 Uxbridge 324 $179,368,900 $553,608 $485,500 543 97% 42 Whitby 1,997 $861,151,924 $431,223 $401,000 2,793 99% 17 Dufferin County 574 $208,836,733 $363,827 $339,450 901 98% 38 Orangeville 574 $208,836,733 $363,827 $339,450 901 98% 38 Simcoe County 2,146 $853,325,320 $397,635 $369,900 3,625 97% 41 Adjala-Tosorontio 150 $69,496,823 $463,312 $418,000 289 97% 60 Bradford West Gwillimbury 589 $271,858,604 $461,560 $443,000 1,023 98% 31 Essa 265 $89,165,306 $336,473 $297,000 403 98% 43 Innisfil 546 $210,763,640 $386,014 $344,750 1,023 97% 42 New Tecumseth 596 $212,040,947 $355,773 $336,000 887 97% 44 ! TURN PAGE FOR CITY OF TORONTO TABLES OR CLICK HERE: SUMMARY OF EXISTING HOME TRANSACTIONS Market Watch, November 2014 Page 3 July 2010 5 Toronto Real Estate Board
- 6. Market Watch, November 2014 Page 3 July 2010 6 Toronto Real Estate Board ALL HOME TYPES, YEAR-TO-DATE 2014 CITY OF TORONTO MUNICIPAL BREAKDOWN Number of Sales Dollar Volume1 Average Price1 Median Price1 New Listings2 Avg. SP/LP4 Avg. DOM5 TREB Total 88,462 $50,175,443,533 $567,198 $475,000 151,535 99% 24 City of Toronto Total 33,174 $20,315,703,280 $612,398 $485,000 60,078 100% 24 Toronto West 8,304 $4,392,382,089 $528,948 $470,000 14,793 100% 26 Toronto W01 519 $340,722,754 $656,499 $575,000 1,003 102% 23 Toronto W02 838 $567,013,669 $676,627 $647,000 1,220 104% 16 Toronto W03 674 $323,132,591 $479,425 $477,500 1,157 102% 19 Toronto W04 734 $317,092,531 $432,006 $432,500 1,218 100% 25 Toronto W05 1,083 $433,507,167 $400,284 $429,000 1,800 98% 31 Toronto W06 1,139 $560,268,054 $491,895 $467,900 2,575 100% 31 Toronto W07 281 $229,516,756 $816,786 $760,000 398 102% 15 Toronto W08 1,693 $1,082,806,620 $639,579 $509,500 3,144 99% 28 Toronto W09 492 $239,551,530 $486,893 $525,900 815 99% 25 Toronto W10 851 $298,770,418 $351,082 $395,000 1,463 98% 29 Toronto Central 15,248 $11,060,838,079 $725,396 $489,000 30,655 99% 26 Toronto C01 4,127 $2,026,089,350 $490,935 $410,000 9,420 99% 30 Toronto C02 699 $788,162,863 $1,127,558 $860,000 1,462 100% 25 Toronto C03 537 $608,696,393 $1,133,513 $769,000 977 100% 22 Toronto C04 983 $1,258,975,017 $1,280,748 $1,200,000 1,788 100% 20 Toronto C06 334 $202,809,973 $607,215 $609,000 676 99% 27 Toronto C07 1,148 $750,607,538 $653,839 $460,000 2,269 98% 28 Toronto C08 1,520 $721,764,418 $474,845 $415,000 2,878 99% 27 Toronto C09 321 $514,662,762 $1,603,311 $1,380,000 602 98% 24 Toronto C10 603 $454,175,303 $753,193 $667,500 1,012 102% 19 Toronto C11 520 $385,321,232 $741,002 $436,750 721 102% 20 Toronto C12 411 $770,641,353 $1,875,040 $1,580,000 871 97% 30 Toronto C13 792 $563,929,068 $712,032 $528,500 1,217 102% 19 Toronto C14 1,757 $1,157,687,091 $658,900 $435,000 3,952 98% 29 Toronto C15 1,496 $857,315,719 $573,072 $443,500 2,810 100% 24 Toronto East 9,622 $4,862,483,113 $505,351 $493,650 14,630 102% 18 Toronto E01 872 $579,181,431 $664,199 $649,950 1,301 106% 13 Toronto E02 773 $580,231,863 $750,623 $680,000 1,172 103% 13 Toronto E03 1,001 $632,747,165 $632,115 $603,500 1,496 105% 14 Toronto E04 1,154 $494,286,560 $428,325 $465,000 1,699 101% 19 Toronto E05 1,026 $487,102,198 $474,758 $398,500 1,467 102% 17 Toronto E06 441 $245,916,390 $557,634 $509,000 765 101% 15 Toronto E07 960 $428,905,717 $446,777 $428,000 1,580 102% 21 Toronto E08 621 $287,143,257 $462,388 $470,000 977 99% 22 Toronto E09 1,250 $472,178,505 $377,743 $360,000 1,915 100% 23 Toronto E10 654 $328,840,270 $502,814 $490,000 1,020 101% 20 Toronto E11 870 $325,949,757 $374,655 $373,500 1,238 100% 21 SUMMARY OF EXISTING HOME TRANSACTIONS
- 7. Market Watch, November 2014 Industrial Leasing Page 3 July 2010 7 Toronto Real Estate Board ALL TREB AREAS Sales1 Dollar Volume1 Average Price1 Median Price1 New Listings2 Active Listings3 Avg. SP/LP4 Avg. DOM5 TREB Total 3,0-68 $2,301,-344,096 $750-,112 $625-,000 3,9-77 6,8-47 98-% 2-7 Halton Region 275 $209,596,901 $762,171 $645,000 346 832 97% 35 Burlington 70 $51,926,600 $741,809 $625,750 68 187 96% 52 Halton Hills 45 $25,435,000 $565,222 $562,000 59 149 98% 38 Milton 62 $35,393,351 $570,861 $560,000 90 142 99% 23 Oakville 9-8 $96,84- 1,950 $988-,183 $836-,500 12- 9 35- 4 97-% 2-8 Peel Region 561 $362,331,229 $645,867 $586,000 809 1,390 97% 29 Brampton 278 $145,918,291 $524,886 $504,000 435 606 97% 25 Caledon 47 $31,605,300 $672,453 $625,000 62 199 96% 62 Mississauga 23- 6 $184,8-07,638 $783-,083 $686-,250 31- 2 58- 5 97-% 2-7 City of Toronto 904 $845,350,369 $935,122 $725,000 1,148 1,538 100% 20 - - - - - - - - York Region 662 $587,917,622 $888,093 $770,000 860 1,603 98% 28 Aurora 33 $23,717,850 $718,723 $658,800 48 98 97% 35 E. Gwillimbury 23 $13,527,600 $588,157 $539,500 34 68 98% 37 Georgina 57 $21,347,950 $374,525 $383,500 70 131 97% 34 King 22 $26,063,149 $1,184,689 $863,500 33 145 96% 42 Markham 147 $148,865,926 $1,012,693 $890,000 179 223 99% 21 Newmarket 54 $32,926,279 $609,746 $599,500 62 104 99% 21 Richmond Hill 131 $129,719,396 $990,224 $895,000 179 291 98% 28 Vaughan 159 $163,698,797 $1,029,552 $840,000 205 406 97% 27 Whitchurch-Stouffville 3-6 $28,05- 0,675 $779-,185 $647-,000 5-0 13- 7 96-% 4-2 Durham Region 513 $230,552,425 $449,420 $417,500 637 873 98% 25 Ajax 84 $42,934,525 $511,125 $511,750 112 84 99% 20 Brock 18 $5,457,000 $303,167 $246,200 21 70 96% 66 Clarington 66 $25,862,350 $391,854 $363,750 105 157 98% 22 Oshawa 133 $45,215,599 $339,967 $325,000 166 176 99% 19 Pickering 55 $32,241,700 $586,213 $515,000 68 92 99% 21 Scugog 25 $12,766,600 $510,664 $429,000 32 86 98% 62 Uxbridge 27 $17,408,400 $644,756 $590,000 25 93 96% 44 Whitby 10- 5 $48,66- 6,251 $463-,488 $436-,250 10- 8 11- 5 99-% 1-9 Dufferin County 34 $13,619,150 $400,563 $357,500 31 113 97% 44 Orangeville 3-4 $13,61- 9,150 $400-,563 $357-,500 3-1 11- 3 97-% 4-4 Simcoe County 119 $51,976,400 $436,776 $395,000 146 498 97% 54 Adjala-Tosorontio 14 $7,515,400 $536,814 $441,000 12 66 96% 60 Bradford West Gwillimbury 29 $14,687,300 $506,459 $516,000 34 113 97% 56 Essa 11 $4,906,000 $446,000 $407,000 17 56 97% 99 Innisfil 32 $13,109,800 $409,681 $363,000 55 172 96% 50 New Tecumseth 33 $11,757,900 $356,300 $335,000 28 91 97% 38 SUMMARY OF EXISTING HOME TRANSACTIONS DETACHED HOUSES, NOVEMBER 2014 ! TURN PAGE FOR CITY OF TORONTO TABLES OR CLICK HERE:
- 8. Market Watch, November 2014 Industrial Leasing Page 3 July 2010 8 Toronto Real Estate Board CITY OF TORONTO MUNICIPAL BREAKDOWN Sales1 Dollar Volume1 Average Price1 Median Price1 New Listings2 Active Listings3 Avg. SP/LP4 Avg. DOM5 TREB Total 3,068 $2,301,344,096 $750,112 $625,000 3,977 6,847 98% 27 City of Toronto Total 904 $845,350,369 $935,122 $725,000 1,148 1,538 100% 20 Toronto West 245 $177,296,665 $723,660 $631,100 337 498 100% 22 Toronto W01 14 $14,136,500 $1,009,750 $908,000 17 13 105% 11 Toronto W02 16 $14,782,555 $923,910 $962,500 23 28 107% 10 Toronto W03 35 $18,394,100 $525,546 $480,000 53 51 100% 21 Toronto W04 26 $16,740,900 $643,881 $583,500 37 58 98% 25 Toronto W05 19 $10,952,400 $576,442 $576,500 24 46 99% 23 Toronto W06 38 $24,544,610 $645,911 $617,500 45 49 101% 20 Toronto W07 11 $8,904,000 $809,455 $724,000 15 22 103% 16 Toronto W08 45 $45,496,100 $1,011,024 $805,000 59 132 98% 24 Toronto W09 16 $10,553,500 $659,594 $679,000 18 37 98% 26 Toronto W10 25 $12,792,000 $511,680 $512,000 46 62 100% 31 Toronto Central 298 $435,942,723 $1,462,895 $1,260,009 384 655 99% 24 Toronto C01 7 $8,995,000 $1,285,000 $1,152,000 7 8 100% 19 Toronto C02 10 $16,817,574 $1,681,757 $1,155,000 12 31 99% 30 Toronto C03 24 $29,085,500 $1,211,896 $706,000 41 54 98% 30 Toronto C04 58 $88,316,278 $1,522,694 $1,440,000 96 138 99% 20 Toronto C06 15 $13,791,000 $919,400 $825,000 23 37 99% 28 Toronto C07 39 $43,313,000 $1,110,590 $1,020,000 50 89 98% 22 Toronto C08 6 $7,436,999 $1,239,500 $1,285,000 3 2 99% 13 Toronto C09 11 $24,660,000 $2,241,818 $1,740,000 10 43 97% 42 Toronto C10 12 $15,333,600 $1,277,800 $1,247,500 15 15 103% 12 Toronto C11 6 $8,520,100 $1,420,017 $1,267,000 9 10 101% 14 Toronto C12 23 $59,533,100 $2,588,396 $2,350,000 36 104 96% 33 Toronto C13 31 $42,012,196 $1,355,232 $1,072,000 22 22 100% 15 Toronto C14 35 $53,929,988 $1,540,857 $1,378,000 35 69 97% 32 Toronto C15 21 $24,198,388 $1,152,304 $1,056,500 25 33 101% 21 Toronto East 361 $232,110,981 $642,967 $588,000 427 385 102% 16 Toronto E01 14 $12,808,911 $914,922 $829,000 12 6 113% 17 Toronto E02 18 $16,711,548 $928,419 $851,825 17 22 101% 17 Toronto E03 48 $33,139,721 $690,411 $644,000 69 62 102% 16 Toronto E04 44 $23,433,150 $532,572 $535,500 51 39 100% 16 Toronto E05 28 $20,323,300 $725,832 $727,500 30 30 104% 12 Toronto E06 30 $18,462,250 $615,408 $582,500 36 35 101% 17 Toronto E07 21 $15,222,200 $724,867 $651,800 36 34 103% 15 Toronto E08 36 $23,993,900 $666,497 $561,000 49 43 100% 15 Toronto E09 64 $34,261,800 $535,341 $526,000 53 40 100% 20 Toronto E10 28 $17,882,201 $638,650 $608,000 45 49 100% 18 Toronto E11 30 $15,872,000 $529,067 $538,500 29 25 99% 16 DETACHED HOUSES, NOVEMBER 2014 SUMMARY OF EXISTING HOME TRANSACTIONS
- 9. Industrial Leasing Toronto Real Estate Board ALL TREB AREAS Sales1 Dollar Volume1 Average Price1 Median Price1 New Listings2 Active Listings3 Avg. SP/LP4 Avg. DOM5 TREB Total 65- 0 $348,9-61,380 $536-,864 $489-,450 71- 5 65- 8 10-0% 1-8 Halton Region 35 $17,080,700 $488,020 $458,000 31 39 99% 23 Burlington 4 $1,753,500 $438,375 $448,750 5 5 99% 11 Halton Hills 1 $340,000 $340,000 $340,000 2 5 94% 12 Milton 21 $9,513,200 $453,010 $448,000 13 15 99% 19 Oakville 9- $5,47-4,000 $608-,222 $490-,000 1-1 1-4 99-% 3-8 Peel Region 215 $95,497,695 $444,175 $433,500 261 252 99% 19 Brampton 105 $41,170,451 $392,100 $385,000 131 136 98% 18 Caledon 4 $1,754,300 $438,575 $443,650 4 4 100% 17 Mississauga 10- 6 $52,57- 2,944 $495-,971 $502-,950 12- 6 11- 2 99-% 2-0 City of Toronto 261 $174,133,563 $667,178 $594,800 284 253 102% 16 - - - - - - - - York Region 75 $42,729,722 $569,730 $562,000 89 77 100% 20 Aurora 3 $1,396,700 $465,567 $481,700 4 4 98% 23 E. Gwillimbury - - - - - - - - Georgina 3 $1,021,900 $340,633 $375,000 1 - 100% 19 King - - - - - - - - Markham 17 $10,409,700 $612,335 $617,500 19 15 100% 18 Newmarket 5 $2,128,000 $425,600 $448,000 14 15 99% 44 Richmond Hill 11 $6,586,500 $598,773 $590,000 11 7 100% 19 Vaughan 31 $18,739,922 $604,514 $565,000 37 36 100% 19 Whitchurch-Stouffville 5- $2,44-7,000 $489-,400 $495-,000 3- -- 10-0% 1-0 Durham Region 54 $16,290,700 $301,680 $290,750 48 31 100% 17 Ajax 11 $4,241,600 $385,600 $395,000 8 3 100% 12 Brock - - - - - - - - Clarington 4 $1,052,500 $263,125 $251,500 4 2 99% 31 Oshawa 26 $6,339,300 $243,819 $242,000 20 14 99% 16 Pickering 6 $2,387,800 $397,967 $395,000 10 7 99% 12 Scugog - - - - - 1 - - Uxbridge 1 $292,000 $292,000 $292,000 - - 97% 66 Whitby 6- $1,97-7,500 $329-,583 $326-,000 6- 4- 99-% 1-5 Dufferin County 4 $1,162,000 $290,500 $287,500 - 4 99% 36 Orangeville 4- $1,16-2,000 $290-,500 $287-,500 -- 4- 99-% 3-6 Simcoe County 6 $2,067,000 $344,500 $358,500 2 2 98% 25 Adjala-Tosorontio - - - - - - - - Bradford West Gwillimbury 4 $1,577,000 $394,250 $401,500 1 2 97% 31 Essa - - - - - - - - Innisfil - - - - - - - - New Tecumseth 2 $490,000 $245,000 $245,000 1 - 100% 12 ! TURN PAGE FOR CITY OF TORONTO TABLES OR CLICK HERE: SUMMARY OF EXISTING HOME TRANSACTIONS SEMI-DETACHED HOUSES, NOVEMBER 2014 Page 3 July 2010 Market Watch, November 2014 9
- 10. Industrial Leasing Page 3 July 2010 Toronto Real Estate Board Market Watch, November 2014 CITY OF TORONTO MUNICIPAL BREAKDOWN Sales1 Dollar Volume1 Average Price1 Median Price1 New Listings2 Active Listings3 Avg. SP/LP4 Avg. DOM5 TREB Total 650 $348,961,380 $536,864 $489,450 715 658 100% 18 City of Toronto Total 261 $174,133,563 $667,178 $594,800 284 253 102% 16 Toronto West 87 $49,188,119 $565,381 $510,000 92 109 101% 21 Toronto W01 4 $3,169,000 $792,250 $800,500 4 3 98% 20 Toronto W02 20 $13,383,780 $669,189 $637,000 18 16 105% 17 Toronto W03 17 $9,108,389 $535,788 $515,300 27 32 103% 21 Toronto W04 1 $500,400 $500,400 $500,400 10 11 100% 9 Toronto W05 26 $12,488,050 $480,310 $465,750 20 31 98% 26 Toronto W06 3 $2,334,000 $778,000 $550,000 2 3 95% 31 Toronto W07 1 $620,000 $620,000 $620,000 1 - 105% 6 Toronto W08 3 $1,679,900 $559,967 $598,000 1 3 98% 15 Toronto W09 4 $2,261,500 $565,375 $577,500 2 6 99% 23 Toronto W10 8 $3,643,100 $455,388 $441,300 7 4 97% 17 Toronto Central 73 $64,434,275 $882,661 $728,000 84 68 101% 14 Toronto C01 17 $15,331,710 $901,865 $850,000 10 11 98% 22 Toronto C02 14 $21,221,000 $1,515,786 $1,541,000 20 15 101% 8 Toronto C03 6 $3,164,100 $527,350 $532,500 11 5 103% 10 Toronto C04 1 $920,000 $920,000 $920,000 5 3 102% 6 Toronto C06 2 $1,183,365 $591,683 $591,683 - - 97% 58 Toronto C07 - - - - 3 5 - - Toronto C08 - - - - 2 5 - - Toronto C09 1 $1,075,000 $1,075,000 $1,075,000 3 5 93% 11 Toronto C10 8 $6,620,000 $827,500 $783,500 6 1 105% 9 Toronto C11 3 $2,246,000 $748,667 $782,000 4 - 105% 7 Toronto C12 1 $654,000 $654,000 $654,000 - 1 96% 46 Toronto C13 9 $4,850,300 $538,922 $530,000 9 5 103% 8 Toronto C14 - - - - - - - - Toronto C15 11 $7,168,800 $651,709 $648,000 11 12 103% 12 Toronto East 101 $60,511,169 $599,120 $566,000 108 76 104% 14 Toronto E01 21 $13,314,000 $634,000 $610,000 27 20 103% 15 Toronto E02 24 $15,781,516 $657,563 $632,000 25 18 106% 12 Toronto E03 25 $15,850,273 $634,011 $627,000 26 15 105% 11 Toronto E04 7 $3,208,500 $458,357 $435,500 6 6 106% 17 Toronto E05 7 $3,773,880 $539,126 $545,000 8 3 106% 11 Toronto E06 3 $1,609,000 $536,333 $512,000 2 3 99% 10 Toronto E07 6 $3,306,000 $551,000 $542,500 2 2 102% 16 Toronto E08 - - - - - - - - Toronto E09 3 $1,225,000 $408,333 $425,000 3 1 98% 12 Toronto E10 3 $1,443,000 $481,000 $440,000 4 4 95% 40 Toronto E11 2 $1,000,000 $500,000 $500,000 5 4 97% 12 SUMMARY OF EXISTING HOME TRANSACTIONS SEMI-DETACHED HOUSES, NOVEMBER 2014 10
- 11. Industrial Leasing Page 3 July 2010 Toronto Real Estate Board Market Watch, November 2014 ALL TREB AREAS Sales1 Dollar Volume1 Average Price1 Median Price1 New Listings2 Active Listings3 Avg. SP/LP4 Avg. DOM5 TREB Total 50- 9 $198,7-94,420 $390-,559 $369-,500 57- 0 82- 7 99-% 2-5 Halton Region 42 $15,858,900 $377,593 $356,450 47 73 98% 26 Burlington 18 $7,058,300 $392,128 $383,250 19 29 98% 22 Halton Hills 3 $753,100 $251,033 $243,100 4 6 97% 18 Milton 6 $1,715,000 $285,833 $282,000 6 9 100% 21 Oakville 1-5 $6,33-2,500 $422-,167 $390-,000 1-8 2-9 98-% 3-3 Peel Region 188 $69,012,389 $367,087 $353,750 176 243 98% 26 Brampton 39 $11,272,600 $289,041 $267,000 39 64 98% 28 Caledon 2 $890,000 $445,000 $445,000 1 1 96% 41 Mississauga 14- 7 $56,84- 9,789 $386-,733 $374-,990 13- 6 17- 8 98-% 2-5 City of Toronto 184 $79,405,780 $431,553 $411,500 217 347 99% 25 - - - - - - - - York Region 44 $22,218,500 $504,966 $472,000 72 102 98% 24 Aurora 4 $3,194,000 $798,500 $854,500 4 9 96% 36 E. Gwillimbury - - - - - - - - Georgina - - - - 2 2 - - King - - - - - - - - Markham 25 $12,098,100 $483,924 $489,900 31 42 99% 23 Newmarket 1 $364,600 $364,600 $364,600 7 9 99% 8 Richmond Hill 8 $3,622,700 $452,838 $461,000 11 19 100% 24 Vaughan 5 $2,664,000 $532,800 $477,000 16 20 97% 23 Whitchurch-Stouffville 1- $275-,100 $275-,100 $275-,100 1- 1- 99-% 1-1 Durham Region 44 $10,704,951 $243,294 $254,500 56 58 100% 22 Ajax 8 $2,392,750 $299,094 $302,250 6 5 100% 17 Brock 2 $351,000 $175,500 $175,500 1 3 94% 61 Clarington 5 $1,204,900 $240,980 $267,900 7 8 99% 27 Oshawa 10 $1,432,900 $143,290 $133,000 17 17 99% 20 Pickering 11 $3,362,600 $305,691 $295,000 17 16 100% 27 Scugog - - - - - - - - Uxbridge 2 $485,000 $242,500 $242,500 3 4 100% 12 Whitby 6- $1,47-5,801 $245-,967 $251-,901 5- 5- 10-1% 1-2 Dufferin County 5 $1,104,400 $220,880 $218,000 1 2 98% 36 Orangeville 5- $1,10-4,400 $220-,880 $218-,000 1- 2- 98-% 3-6 Simcoe County 2 $489,500 $244,750 $244,750 1 2 99% 21 Adjala-Tosorontio - - - - - - - - Bradford West Gwillimbury 1 $277,000 $277,000 $277,000 - - 99% 7 Essa - - - - - - - - Innisfil - - - - - - - - New Tecumseth 1 $212,500 $212,500 $212,500 1 2 99% 35 ! TURN PAGE FOR CITY OF TORONTO TABLES OR CLICK HERE: SUMMARY OF EXISTING HOME TRANSACTIONS CONDOMINIUM TOWNHOUSES, NOVEMBER 2014 11
- 12. Industrial Leasing Page 3 July 2010 Toronto Real Estate Board Market Watch, November 2014 12 CITY OF TORONTO MUNICIPAL BREAKDOWN Sales1 Dollar Volume1 Average Price1 Median Price1 New Listings2 Active Listings3 Avg. SP/LP4 Avg. DOM5 TREB Total 509 $198,794,420 $390,559 $369,500 570 827 99% 25 City of Toronto Total 184 $79,405,780 $431,553 $411,500 217 347 99% 25 Toronto West 44 $16,072,590 $365,286 $369,500 54 102 99% 27 Toronto W01 5 $2,666,000 $533,200 $595,000 4 4 100% 10 Toronto W02 6 $2,698,300 $449,717 $427,450 3 6 99% 45 Toronto W03 2 $531,000 $265,500 $265,500 2 2 97% 26 Toronto W04 8 $2,813,500 $351,688 $369,500 3 9 100% 21 Toronto W05 9 $1,970,900 $218,989 $242,900 16 25 98% 18 Toronto W06 6 $2,911,890 $485,315 $482,500 4 15 99% 40 Toronto W07 - - - - 1 1 - - Toronto W08 4 $1,519,100 $379,775 $399,550 8 14 98% 25 Toronto W09 1 $339,900 $339,900 $339,900 4 4 99% 7 Toronto W10 3 $622,000 $207,333 $239,000 9 22 94% 54 Toronto Central 75 $39,242,600 $523,235 $473,000 96 152 99% 27 Toronto C01 15 $7,565,400 $504,360 $530,500 27 37 101% 17 Toronto C02 3 $2,435,000 $811,667 $895,000 2 3 100% 26 Toronto C03 - - - - 1 4 - - Toronto C04 1 $840,000 $840,000 $840,000 1 - 99% 6 Toronto C06 1 $513,500 $513,500 $513,500 1 5 99% 10 Toronto C07 5 $2,186,000 $437,200 $435,000 9 18 98% 45 Toronto C08 7 $3,296,900 $470,986 $430,000 8 11 100% 33 Toronto C09 1 $757,500 $757,500 $757,500 - - 101% 11 Toronto C10 3 $1,352,500 $450,833 $443,000 5 7 101% 18 Toronto C11 - - - - 1 2 - - Toronto C12 3 $1,842,000 $614,000 $675,000 7 14 97% 41 Toronto C13 2 $1,013,000 $506,500 $506,500 5 4 102% 8 Toronto C14 13 $6,929,900 $533,069 $488,000 9 22 98% 28 Toronto C15 21 $10,510,900 $500,519 $456,000 20 25 97% 31 Toronto East 65 $24,090,590 $370,624 $353,000 67 93 100% 22 Toronto E01 3 $1,500,400 $500,133 $469,000 4 8 99% 22 Toronto E02 5 $3,714,000 $742,800 $640,000 6 4 100% 13 Toronto E03 2 $463,000 $231,500 $231,500 1 - 95% 10 Toronto E04 4 $1,461,000 $365,250 $359,000 7 10 102% 13 Toronto E05 16 $5,675,300 $354,706 $358,000 16 14 99% 22 Toronto E06 3 $1,078,890 $359,630 $399,900 5 4 100% 12 Toronto E07 9 $3,501,000 $389,000 $411,000 7 7 100% 13 Toronto E08 3 $660,000 $220,000 $180,000 3 4 99% 61 Toronto E09 6 $1,461,500 $243,583 $257,000 5 14 97% 44 Toronto E10 3 $873,000 $291,000 $289,000 3 10 98% 16 Toronto E11 11 $3,702,500 $336,591 $350,000 10 18 101% 21 SUMMARY OF EXISTING HOME TRANSACTIONS CONDOMINIUM TOWNHOUSES, NOVEMBER 2014
- 13. Industrial Leasing Page 3 July 2010 Toronto Real Estate Board Market Watch, November 2014 ALL TREB AREAS Sales1 Dollar Volume1 Average Price1 Median Price1 New Listings2 Active Listings3 Avg. SP/LP4 Avg. DOM5 TREB Total 1,6-67 $617,8-58,916 $370-,641 $322-,000 2,8-27 5,7-10 97-% 3-5 Halton Region 46 $18,525,600 $402,730 $290,500 77 162 96% 39 Burlington 16 $5,570,800 $348,175 $277,200 24 47 95% 35 Halton Hills 1 $332,000 $332,000 $332,000 3 8 98% 22 Milton 9 $2,697,000 $299,667 $285,000 7 14 98% 38 Oakville 2-0 $9,92-5,800 $496-,290 $347-,500 4-3 9-3 96-% 4-5 Peel Region 238 $64,206,150 $269,774 $250,500 369 773 97% 38 Brampton 31 $7,061,300 $227,784 $220,000 52 86 97% 32 Caledon 3 $1,177,000 $392,333 $395,000 1 1 99% 38 Mississauga 20- 4 $55,96- 7,850 $274-,352 $255-,000 31- 6 68- 6 97-% 3-9 City of Toronto 1,199 $472,675,942 $394,225 $346,000 2,031 3,996 98% 34 - - - - - - - - York Region 156 $55,545,124 $356,058 $321,000 302 707 97% 42 Aurora 9 $3,830,900 $425,656 $478,000 8 18 98% 22 E. Gwillimbury - - - - - - - - Georgina - - - - 4 4 - - King - - - - 3 21 - - Markham 55 $20,454,244 $371,895 $316,000 105 253 98% 47 Newmarket 8 $2,483,500 $310,438 $304,000 7 10 97% 21 Richmond Hill 41 $12,176,690 $296,992 $286,000 89 191 97% 41 Vaughan 43 $16,599,790 $386,042 $360,000 86 208 97% 47 Whitchurch-Stouffville -- -- -- -- -- 2- -- -- Durham Region 24 $5,980,400 $249,183 $234,250 45 64 98% 24 Ajax 3 $671,000 $223,667 $212,000 4 5 101% 17 Brock - - - - - - - - Clarington 4 $831,500 $207,875 $200,000 3 7 98% 12 Oshawa 4 $540,900 $135,225 $139,000 7 15 96% 70 Pickering 7 $1,999,500 $285,643 $252,000 20 24 96% 22 Scugog - - - - - - - - Uxbridge - - - - 3 4 - - Whitby 6- $1,93-7,500 $322-,917 $318-,750 8- 9- 98-% 9- Dufferin County 2 $497,000 $248,500 $248,500 1 2 97% 27 Orangeville 2- $497-,000 $248-,500 $248-,500 1- 2- 97-% 2-7 Simcoe County 2 $428,700 $214,350 $214,350 2 6 99% 87 Adjala-Tosorontio - - - - - - - - Bradford West Gwillimbury 1 $218,800 $218,800 $218,800 1 2 98% 15 Essa - - - - - - - - Innisfil - - - - - - - - New Tecumseth 1 $209,900 $209,900 $209,900 1 4 100% 159 ! TURN PAGE FOR CITY OF TORONTO TABLES OR CLICK HERE: SUMMARY OF EXISTING HOME TRANSACTIONS CONDOMINIUM APARTMENT, NOVEMBER 2014 13
- 14. Industrial Leasing Page 3 July 2010 Toronto Real Estate Board Market Watch, November 2014 14 CITY OF TORONTO MUNICIPAL BREAKDOWN Sales1 Dollar Volume1 Average Price1 Median Price1 New Listings2 Active Listings3 Avg. SP/LP4 Avg. DOM5 TREB Total 1,667 $617,858,916 $370,641 $322,000 2,827 5,710 97% 35 City of Toronto Total 1,199 $472,675,942 $394,225 $346,000 2,031 3,996 98% 34 Toronto West 247 $78,317,084 $317,073 $290,000 402 820 97% 36 Toronto W01 20 $7,025,490 $351,275 $327,500 45 87 99% 27 Toronto W02 9 $3,565,900 $396,211 $376,000 20 36 99% 35 Toronto W03 10 $2,844,200 $284,420 $282,600 8 9 98% 20 Toronto W04 27 $5,492,100 $203,411 $182,000 22 43 97% 34 Toronto W05 21 $4,748,600 $226,124 $204,000 38 82 96% 50 Toronto W06 52 $22,292,700 $428,706 $377,500 119 287 97% 44 Toronto W07 4 $1,247,400 $311,850 $300,000 3 6 97% 27 Toronto W08 59 $20,858,194 $353,529 $310,000 91 182 98% 35 Toronto W09 21 $5,408,000 $257,524 $275,000 16 23 96% 34 Toronto W10 24 $4,834,500 $201,438 $198,500 40 65 96% 32 Toronto Central 753 $339,826,614 $451,297 $385,000 1,354 2,729 97% 33 Toronto C01 301 $132,091,585 $438,842 $390,000 544 1,132 97% 34 Toronto C02 32 $31,360,005 $980,000 $751,875 56 149 96% 42 Toronto C03 8 $5,196,000 $649,500 $601,250 20 41 98% 29 Toronto C04 17 $9,358,400 $550,494 $523,900 19 24 98% 22 Toronto C06 13 $4,458,300 $342,946 $330,000 17 51 98% 30 Toronto C07 41 $14,999,800 $365,849 $350,000 76 141 98% 32 Toronto C08 114 $49,493,150 $434,150 $391,250 183 305 98% 33 Toronto C09 7 $4,386,900 $626,700 $543,000 17 28 99% 36 Toronto C10 27 $15,141,600 $560,800 $543,000 67 92 98% 26 Toronto C11 18 $4,668,988 $259,388 $192,300 27 36 98% 33 Toronto C12 3 $2,655,000 $885,000 $630,000 5 25 98% 10 Toronto C13 28 $9,288,463 $331,731 $299,500 44 70 97% 33 Toronto C14 100 $41,207,436 $412,074 $382,500 169 385 98% 36 Toronto C15 44 $15,520,987 $352,750 $317,500 110 250 97% 31 Toronto East 199 $54,532,244 $274,031 $247,500 275 447 98% 33 Toronto E01 12 $5,604,500 $467,042 $486,500 28 32 99% 25 Toronto E02 6 $2,430,100 $405,017 $365,500 13 25 98% 51 Toronto E03 8 $2,110,000 $263,750 $204,250 10 11 96% 44 Toronto E04 20 $3,922,800 $196,140 $194,000 28 36 97% 31 Toronto E05 24 $6,687,171 $278,632 $266,000 27 34 98% 28 Toronto E06 17 $7,654,600 $450,271 $412,000 9 10 102% 24 Toronto E07 36 $9,091,300 $252,536 $253,250 56 105 98% 38 Toronto E08 14 $2,596,500 $185,464 $172,000 17 30 97% 28 Toronto E09 42 $10,932,288 $260,293 $249,900 53 110 98% 34 Toronto E10 4 $708,500 $177,125 $170,500 7 16 99% 26 Toronto E11 16 $2,794,485 $174,655 $185,793 27 38 98% 39 SUMMARY OF EXISTING HOME TRANSACTIONS CONDOMINIUM APARTMENT, NOVEMBER 2014
- 15. Industrial Leasing Page 3 July 2010 Toronto Real Estate Board Market Watch, November 2014 ALL TREB AREAS Sales1 Dollar Volume1 Average Price1 Median Price1 New Listings2 Active Listings3 Avg. SP/LP4 Avg. DOM5 TREB Total 10- 0 $50,71- 7,328 $507-,173 $511-,500 9-9 7-8 10-0% 1-9 Halton Region 10 $4,798,000 $479,800 $487,500 7 1 99% 17 Burlington 1 $380,000 $380,000 $380,000 1 - 97% 11 Halton Hills - - - - - - - - Milton 2 $960,000 $480,000 $480,000 2 1 98% 31 Oakville 7- $3,45-8,000 $494-,000 $513-,000 4- -- 10-0% 1-4 Peel Region 8 $4,008,000 $501,000 $514,500 10 8 99% 16 Brampton 2 $894,000 $447,000 $447,000 4 3 99% 9 Caledon - - - - 1 1 - - Mississauga 6- $3,11-4,000 $519-,000 $514-,500 5- 4- 98-% 1-9 City of Toronto 9 $5,233,488 $581,499 $595,800 17 12 100% 16 - - - - - - - - York Region 38 $25,135,000 $661,447 $687,500 40 33 102% 19 Aurora 1 $470,000 $470,000 $470,000 1 - 99% 6 E. Gwillimbury - - - - - - - - Georgina 2 $678,000 $339,000 $339,000 - - 97% 24 King - - - - 2 3 - - Markham 27 $18,861,000 $698,556 $699,900 27 22 102% 19 Newmarket - - - - - - - - Richmond Hill 5 $3,246,000 $649,200 $638,000 6 4 100% 13 Vaughan 3 $1,880,000 $626,667 $650,000 4 4 98% 30 Whitchurch-Stouffville -- -- -- -- -- -- -- -- Durham Region 28 $9,439,340 $337,119 $328,000 23 19 99% 18 Ajax 2 $626,000 $313,000 $313,000 5 5 104% 11 Brock - - - - - - - - Clarington 18 $5,868,840 $326,047 $320,000 10 9 98% 20 Oshawa 2 $545,000 $272,500 $272,500 1 1 104% 27 Pickering 1 $386,000 $386,000 $386,000 2 1 102% 4 Scugog 1 $385,000 $385,000 $385,000 - - 95% 35 Uxbridge - - - - - - - - Whitby 4- $1,62-8,500 $407-,125 $401-,250 5- 3- 10-0% 1-1 Dufferin County - - - - - - - - Orangeville -- -- -- -- -- -- -- -- Simcoe County 7 $2,103,500 $300,500 $297,000 2 5 98% 25 Adjala-Tosorontio - - - - - - - - Bradford West Gwillimbury 2 $649,000 $324,500 $324,500 2 4 101% 16 Essa 1 $297,000 $297,000 $297,000 - - 99% 21 Innisfil 1 $295,000 $295,000 $295,000 - 1 95% 20 New Tecumseth 3 $862,500 $287,500 $293,500 - - 98% 33 SUMMARY OF EXISTING HOME TRANSACTIONS LINK, NOVEMBER 2014 ! TURN PAGE FOR CITY OF TORONTO TABLES OR CLICK HERE: 15
- 16. Industrial Leasing Page 3 July 2010 Toronto Real Estate Board Market Watch, November 2014 16 CITY OF TORONTO MUNICIPAL BREAKDOWN Sales1 Dollar Volume1 Average Price1 Median Price1 New Listings2 Active Listings3 Avg. SP/LP4 Avg. DOM5 TREB Total 100 $50,717,328 $507,173 $511,500 99 78 100% 19 City of Toronto Total 9 $5,233,488 $581,499 $595,800 17 12 100% 16 Toronto West - - - - - 1 - - Toronto W01 - - - - - - - - Toronto W02 - - - - - - - - Toronto W03 - - - - - - - - Toronto W04 - - - - - - - - Toronto W05 - - - - - - - - Toronto W06 - - - - - - - - Toronto W07 - - - - - - - - Toronto W08 - - - - - - - - Toronto W09 - - - - - 1 - - Toronto W10 - - - - - - - - Toronto Central 3 $1,899,300 $633,100 $626,000 2 - 101% 23 Toronto C01 - - - - - - - - Toronto C02 - - - - - - - - Toronto C03 - - - - - - - - Toronto C04 - - - - - - - - Toronto C06 - - - - - - - - Toronto C07 2 $1,273,300 $636,650 $636,650 - - 102% 32 Toronto C08 - - - - - - - - Toronto C09 - - - - - - - - Toronto C10 - - - - - - - - Toronto C11 - - - - - - - - Toronto C12 - - - - - - - - Toronto C13 - - - - - - - - Toronto C14 - - - - - - - - Toronto C15 1 $626,000 $626,000 $626,000 2 - 98% 6 Toronto East 6 $3,334,188 $555,698 $578,000 15 11 99% 12 Toronto E01 - - - - - - - - Toronto E02 - - - - - - - - Toronto E03 - - - - - - - - Toronto E04 - - - - - - - - Toronto E05 3 $1,757,388 $585,796 $580,000 4 4 97% 18 Toronto E06 - - - - - - - - Toronto E07 2 $1,146,800 $573,400 $573,400 6 5 103% 5 Toronto E08 - - - - - - - - Toronto E09 - - - - - - - - Toronto E10 - - - - 1 1 - - Toronto E11 1 $430,000 $430,000 $430,000 4 1 98% 10 SUMMARY OF EXISTING HOME TRANSACTIONS LINK, NOVEMBER 2014
- 17. Industrial Leasing Page 3 July 2010 Toronto Real Estate Board Market Watch, November 2014 ALL TREB AREAS Sales1 Dollar Volume1 Average Price1 Median Price1 New Listings2 Active Listings3 Avg. SP/LP4 Avg. DOM5 TREB Total 50- 2 $241,6-76,805 $481-,428 $447-,000 57- 2 52- 7 10-0% 1-9 Halton Region 93 $40,998,178 $440,841 $423,500 91 108 99% 22 Burlington 9 $4,120,200 $457,800 $432,000 10 16 98% 18 Halton Hills 11 $4,242,400 $385,673 $399,000 10 5 100% 17 Milton 49 $20,108,188 $410,371 $406,000 45 40 99% 21 Oakville 2-4 $12,52- 7,390 $521-,975 $498-,500 2-6 4-7 99-% 2-9 Peel Region 99 $40,767,701 $411,795 $403,000 106 97 98% 24 Brampton 65 $25,031,301 $385,097 $385,000 74 64 98% 27 Caledon 7 $2,798,900 $399,843 $403,000 4 2 99% 9 Mississauga 2-7 $12,93- 7,500 $479-,167 $470-,000 2-8 3-1 98-% 2-0 City of Toronto 87 $57,001,851 $655,194 $624,000 103 104 101% 15 - - - - - - - - York Region 137 $74,215,087 $541,716 $534,000 171 149 100% 17 Aurora 11 $5,212,750 $473,886 $473,000 16 9 98% 20 E. Gwillimbury 1 $352,000 $352,000 $352,000 1 - 101% 2 Georgina 4 $1,389,400 $347,350 $342,700 3 7 99% 50 King 1 $760,000 $760,000 $760,000 4 5 98% 6 Markham 37 $21,187,533 $572,636 $550,800 41 36 101% 15 Newmarket 13 $5,921,800 $455,523 $452,000 14 7 99% 13 Richmond Hill 31 $18,792,623 $606,214 $599,000 41 41 102% 20 Vaughan 29 $15,852,981 $546,655 $549,900 45 42 99% 13 Whitchurch-Stouffville 1-0 $4,74-6,000 $474-,600 $484-,000 6- 2- 10-0% 1-3 Durham Region 76 $25,971,988 $341,737 $350,250 84 49 100% 14 Ajax 24 $8,738,888 $364,120 $365,000 35 19 101% 10 Brock - - - - - - - - Clarington 9 $2,376,500 $264,056 $272,500 16 11 100% 10 Oshawa 12 $3,075,500 $256,292 $260,000 11 8 100% 22 Pickering 10 $4,326,500 $432,650 $405,250 8 6 100% 17 Scugog - - - - - - - - Uxbridge - - - - - - - - Whitby 2-1 $7,45-4,600 $354-,981 $350-,000 1-4 5- 10-0% 1-5 Dufferin County 5 $1,471,500 $294,300 $307,500 9 10 99% 30 Orangeville 5- $1,47-1,500 $294-,300 $307-,500 9- 1-0 99-% 3-0 Simcoe County 5 $1,250,500 $250,100 $255,000 8 10 98% 26 Adjala-Tosorontio - - - - - - - - Bradford West Gwillimbury - - - - 1 3 - - Essa 1 $255,000 $255,000 $255,000 1 - 100% 13 Innisfil 3 $745,500 $248,500 $265,000 6 6 97% 35 New Tecumseth 1 $250,000 $250,000 $250,000 - 1 97% 10 ! TURN PAGE FOR CITY OF TORONTO TABLES OR CLICK HERE: SUMMARY OF EXISTING HOME TRANSACTIONS ATTACHED/ROW/TOWNHOUSE, NOVEMBER 2014 17
- 18. Industrial Leasing Page 3 July 2010 Toronto Real Estate Board Market Watch, November 2014 18 CITY OF TORONTO MUNICIPAL BREAKDOWN Sales1 Dollar Volume1 Average Price1 Median Price1 New Listings2 Active Listings3 Avg. SP/LP4 Avg. DOM5 TREB Total 502 $241,676,805 $481,428 $447,000 572 527 100% 19 City of Toronto Total 87 $57,001,851 $655,194 $624,000 103 104 101% 15 Toronto West 28 $16,983,270 $606,545 $604,030 26 23 101% 19 Toronto W01 2 $1,387,500 $693,750 $693,750 3 2 112% 9 Toronto W02 4 $2,299,000 $574,750 $572,000 3 4 99% 30 Toronto W03 1 $570,000 $570,000 $570,000 3 3 104% 8 Toronto W04 5 $2,390,059 $478,012 $449,000 4 3 100% 14 Toronto W05 4 $1,910,000 $477,500 $485,000 1 2 97% 33 Toronto W06 4 $2,564,000 $641,000 $619,500 4 3 98% 31 Toronto W07 5 $3,915,000 $783,000 $795,000 3 3 100% 6 Toronto W08 2 $1,512,711 $756,356 $756,356 4 3 103% 5 Toronto W09 - - - - - - - - Toronto W10 1 $435,000 $435,000 $435,000 1 - 98% 16 Toronto Central 19 $17,326,988 $911,947 $860,000 33 49 102% 11 Toronto C01 6 $4,976,750 $829,458 $807,500 14 15 104% 15 Toronto C02 4 $4,704,000 $1,176,000 $1,327,000 3 7 100% 10 Toronto C03 - - - - 1 3 - - Toronto C04 - - - - 2 5 - - Toronto C06 - - - - - - - - Toronto C07 - - - - 1 2 - - Toronto C08 3 $2,566,000 $855,333 $825,000 5 7 103% 9 Toronto C09 - - - - - - - - Toronto C10 2 $1,791,238 $895,619 $895,619 1 - 102% 15 Toronto C11 1 $751,000 $751,000 $751,000 1 2 100% 6 Toronto C12 - - - - - 2 - - Toronto C13 2 $1,510,000 $755,000 $755,000 2 1 103% 7 Toronto C14 1 $1,028,000 $1,028,000 $1,028,000 3 4 96% 4 Toronto C15 - - - - - 1 - - Toronto East 40 $22,691,593 $567,290 $537,350 44 32 101% 15 Toronto E01 10 $6,660,375 $666,038 $687,450 9 3 102% 11 Toronto E02 6 $5,053,500 $842,250 $814,750 2 1 100% 8 Toronto E03 1 $719,900 $719,900 $719,900 2 2 100% 0 Toronto E04 5 $2,817,500 $563,500 $548,000 6 9 100% 16 Toronto E05 1 $501,000 $501,000 $501,000 3 3 93% 46 Toronto E06 - - - - 2 2 - - Toronto E07 4 $1,936,300 $484,075 $481,000 2 1 103% 17 Toronto E08 2 $902,000 $451,000 $451,000 4 2 99% 7 Toronto E09 1 $456,000 $456,000 $456,000 1 - 102% 13 Toronto E10 2 $919,000 $459,500 $459,500 7 4 103% 11 Toronto E11 8 $2,726,018 $340,752 $347,500 6 5 100% 26 SUMMARY OF EXISTING HOME TRANSACTIONS ATTACHED/ROW/TOWNHOUSE, NOVEMBER 2014
- 19. Industrial Leasing Page 3 July 2010 Toronto Real Estate Board Market Watch, November 2014 ALL TREB AREAS Sales1 Dollar Volume1 Average Price1 Median Price1 New Listings2 Active Listings3 Avg. SP/LP4 Avg. DOM5 TREB Total 1-2 $3,72-1,500 $310-,125 $195-,000 1-4 3-0 97-% 4-6 Halton Region - - - - - - - - Burlington - - - - - - - - Halton Hills - - - - - - - - Milton - - - - - - - - Oakville -- -- -- -- -- -- -- -- Peel Region - - - - - 1 - - Brampton - - - - - - - - Caledon - - - - - - - - Mississauga -- -- -- -- -- 1- -- -- City of Toronto 11 $3,556,500 $323,318 $225,000 14 29 97% 45 - - - - - - - - York Region - - - - - - - - Aurora - - - - - - - - E. Gwillimbury - - - - - - - - Georgina - - - - - - - - King - - - - - - - - Markham - - - - - - - - Newmarket - - - - - - - - Richmond Hill - - - - - - - - Vaughan - - - - - - - - Whitchurch-Stouffville -- -- -- -- -- -- -- -- Durham Region 1 $165,000 $165,000 $165,000 - - 97% 51 Ajax - - - - - - - - Brock - - - - - - - - Clarington 1 $165,000 $165,000 $165,000 - - 97% 51 Oshawa - - - - - - - - Pickering - - - - - - - - Scugog - - - - - - - - Uxbridge - - - - - - - - Whitby -- -- -- -- -- -- -- -- Dufferin County - - - - - - - - Orangeville -- -- -- -- -- -- -- -- Simcoe County - - - - - - - - Adjala-Tosorontio - - - - - - - - Bradford West Gwillimbury - - - - - - - - Essa - - - - - - - - Innisfil - - - - - - - - New Tecumseth - - - - - - - - SUMMARY OF EXISTING HOME TRANSACTIONS CO-OP APARTMENT, NOVEMBER 2014 ! TURN PAGE FOR CITY OF TORONTO TABLES OR CLICK HERE: 19
- 20. Industrial Leasing Page 3 July 2010 Toronto Real Estate Board Market Watch, November 2014 20 CITY OF TORONTO MUNICIPAL BREAKDOWN Sales1 Dollar Volume1 Average Price1 Median Price1 New Listings2 Active Listings3 Avg. SP/LP4 Avg. DOM5 TREB Total 12 $3,721,500 $310,125 $195,000 14 30 97% 46 City of Toronto Total 11 $3,556,500 $323,318 $225,000 14 29 97% 45 Toronto West 4 $548,500 $137,125 $121,750 3 8 94% 34 Toronto W01 - - - - - 1 - - Toronto W02 - - - - - - - - Toronto W03 - - - - - - - - Toronto W04 - - - - - - - - Toronto W05 2 $186,000 $93,000 $93,000 2 2 91% 40 Toronto W06 1 $137,500 $137,500 $137,500 - 2 95% 27 Toronto W07 - - - - - 1 - - Toronto W08 - - - - 1 1 - - Toronto W09 1 $225,000 $225,000 $225,000 - - 96% 28 Toronto W10 - - - - - 1 - - Toronto Central 5 $2,720,000 $544,000 $530,000 10 20 97% 50 Toronto C01 - - - - - - - - Toronto C02 - - - - 2 3 - - Toronto C03 - - - - 1 1 - - Toronto C04 - - - - 1 3 - - Toronto C06 - - - - - - - - Toronto C07 - - - - 1 1 - - Toronto C08 - - - - 1 1 - - Toronto C09 4 $2,385,000 $596,250 $612,500 1 5 98% 30 Toronto C10 1 $335,000 $335,000 $335,000 1 1 93% 134 Toronto C11 - - - - 1 1 - - Toronto C12 - - - - - - - - Toronto C13 - - - - - - - - Toronto C14 - - - - 1 3 - - Toronto C15 - - - - - 1 - - Toronto East 2 $288,000 $144,000 $144,000 1 1 98% 55 Toronto E01 - - - - - - - - Toronto E02 - - - - 1 1 - - Toronto E03 - - - - - - - - Toronto E04 1 $131,000 $131,000 $131,000 - - 97% 33 Toronto E05 - - - - - - - - Toronto E06 - - - - - - - - Toronto E07 - - - - - - - - Toronto E08 - - - - - - - - Toronto E09 - - - - - - - - Toronto E10 1 $157,000 $157,000 $157,000 - - 98% 76 Toronto E11 - - - - - - - - SUMMARY OF EXISTING HOME TRANSACTIONS CO-OP APARTMENT, NOVEMBER 2014
- 21. Industrial Leasing Page 3 July 2010 Toronto Real Estate Board Market Watch, November 2014 ALL TREB AREAS Sales1 Dollar Volume1 Average Price1 Median Price1 New Listings2 Active Listings3 Avg. SP/LP4 Avg. DOM5 TREB Total 5- $2,32-5,000 $465-,000 $425-,000 6- 2-4 96-% 3-5 Halton Region - - - - - 1 - - Burlington - - - - - - - - Halton Hills - - - - - - - - Milton - - - - - - - - Oakville -- -- -- -- -- 1- -- -- Peel Region 1 $515,000 $515,000 $515,000 2 8 91% 20 Brampton 1 $515,000 $515,000 $515,000 2 6 91% 20 Caledon - - - - - - - - Mississauga -- -- -- -- -- 2- -- -- City of Toronto - - - - - 1 - - - - - - - - - - York Region - - - - 1 1 - - Aurora - - - - 1 1 - - E. Gwillimbury - - - - - - - - Georgina - - - - - - - - King - - - - - - - - Markham - - - - - - - - Newmarket - - - - - - - - Richmond Hill - - - - - - - - Vaughan - - - - - - - - Whitchurch-Stouffville -- -- -- -- -- -- -- -- Durham Region - - - - - - - - Ajax - - - - - - - - Brock - - - - - - - - Clarington - - - - - - - - Oshawa - - - - - - - - Pickering - - - - - - - - Scugog - - - - - - - - Uxbridge - - - - - - - - Whitby -- -- -- -- -- -- -- -- Dufferin County - - - - - - - - Orangeville -- -- -- -- -- -- -- -- Simcoe County 4 $1,810,000 $452,500 $408,500 3 13 98% 39 Adjala-Tosorontio - - - - - - - - Bradford West Gwillimbury - - - - - - - - Essa - - - - - - - - Innisfil - - - - - - - - New Tecumseth 4 $1,810,000 $452,500 $408,500 3 13 98% 39 ! TURN PAGE FOR CITY OF TORONTO TABLES OR CLICK HERE: SUMMARY OF EXISTING HOME TRANSACTIONS DETACHED CONDOMINIUM, NOVEMBER 2014 21
- 22. Industrial Leasing Page 3 July 2010 Toronto Real Estate Board Market Watch, November 2014 22 CITY OF TORONTO MUNICIPAL BREAKDOWN Sales1 Dollar Volume1 Average Price1 Median Price1 New Listings2 Active Listings3 Avg. SP/LP4 Avg. DOM5 TREB Total 5 $2,325,000 $465,000 $425,000 6 24 96% 35 City of Toronto Total - - - - - 1 - - Toronto West - - - - - - - - Toronto W01 - - - - - - - - Toronto W02 - - - - - - - - Toronto W03 - - - - - - - - Toronto W04 - - - - - - - - Toronto W05 - - - - - - - - Toronto W06 - - - - - - - - Toronto W07 - - - - - - - - Toronto W08 - - - - - - - - Toronto W09 - - - - - - - - Toronto W10 - - - - - - - - Toronto Central - - - - - 1 - - Toronto C01 - - - - - - - - Toronto C02 - - - - - - - - Toronto C03 - - - - - - - - Toronto C04 - - - - - - - - Toronto C06 - - - - - - - - Toronto C07 - - - - - - - - Toronto C08 - - - - - - - - Toronto C09 - - - - - - - - Toronto C10 - - - - - - - - Toronto C11 - - - - - - - - Toronto C12 - - - - - 1 - - Toronto C13 - - - - - - - - Toronto C14 - - - - - - - - Toronto C15 - - - - - - - - Toronto East - - - - - - - - Toronto E01 - - - - - - - - Toronto E02 - - - - - - - - Toronto E03 - - - - - - - - Toronto E04 - - - - - - - - Toronto E05 - - - - - - - - Toronto E06 - - - - - - - - Toronto E07 - - - - - - - - Toronto E08 - - - - - - - - Toronto E09 - - - - - - - - Toronto E10 - - - - - - - - Toronto E11 - - - - - - - - SUMMARY OF EXISTING HOME TRANSACTIONS DETACHED CONDOMINIUM, NOVEMBER 2014
- 23. Industrial Leasing Page 3 July 2010 Toronto Real Estate Board Market Watch, November 2014 23 ALL TREB AREAS Sales1 Dollar Volume1 Average Price1 Median Price1 New Listings2 Active Listings3 Avg. SP/LP4 Avg. DOM5 TREB Total 6- $2,16-5,000 $360-,833 $224-,000 9- 1-6 99-% 3-1 Halton Region - - - - - - - - Burlington - - - - - - - - Halton Hills - - - - - - - - Milton - - - - - - - - Oakville -- -- -- -- -- -- -- -- Peel Region - - - - - - - - Brampton - - - - - - - - Caledon - - - - - - - - Mississauga -- -- -- -- -- -- -- -- City of Toronto 6 $2,165,000 $360,833 $224,000 9 16 99% 31 - - - - - - - - York Region - - - - - - - - Aurora - - - - - - - - E. Gwillimbury - - - - - - - - Georgina - - - - - - - - King - - - - - - - - Markham - - - - - - - - Newmarket - - - - - - - - Richmond Hill - - - - - - - - Vaughan - - - - - - - - Whitchurch-Stouffville -- -- -- -- -- -- -- -- Durham Region - - - - - - - - Ajax - - - - - - - - Brock - - - - - - - - Clarington - - - - - - - - Oshawa - - - - - - - - Pickering - - - - - - - - Scugog - - - - - - - - Uxbridge - - - - - - - - Whitby -- -- -- -- -- -- -- -- Dufferin County - - - - - - - - Orangeville -- -- -- -- -- -- -- -- Simcoe County - - - - - - - - Adjala-Tosorontio - - - - - - - - Bradford West Gwillimbury - - - - - - - - Essa - - - - - - - - Innisfil - - - - - - - - New Tecumseth - - - - - - - - ! TURN PAGE FOR CITY OF TORONTO TABLES OR CLICK HERE: SUMMARY OF EXISTING HOME TRANSACTIONS CO-OWNERSHIP APARTMENT, NOVEMBER 2014
- 24. Industrial Leasing Page 3 July 2010 Toronto Real Estate Board Market Watch, November 2014 24 CITY OF TORONTO MUNICIPAL BREAKDOWN Sales1 Dollar Volume1 Average Price1 Median Price1 New Listings2 Active Listings3 Avg. SP/LP4 Avg. DOM5 TREB Total 6 $2,165,000 $360,833 $224,000 9 16 99% 31 City of Toronto Total 6 $2,165,000 $360,833 $224,000 9 16 99% 31 Toronto West 1 $125,000 $125,000 $125,000 2 2 94% 61 Toronto W01 - - - - 1 1 - - Toronto W02 - - - - - - - - Toronto W03 - - - - - - - - Toronto W04 - - - - - - - - Toronto W05 1 $125,000 $125,000 $125,000 - - 94% 61 Toronto W06 - - - - 1 1 - - Toronto W07 - - - - - - - - Toronto W08 - - - - - - - - Toronto W09 - - - - - - - - Toronto W10 - - - - - - - - Toronto Central 5 $2,040,000 $408,000 $225,000 6 12 99% 25 Toronto C01 - - - - - - - - Toronto C02 - - - - - 1 - - Toronto C03 1 $1,125,000 $1,125,000 $1,125,000 2 3 102% 9 Toronto C04 1 $223,000 $223,000 $223,000 1 3 94% 9 Toronto C06 - - - - - - - - Toronto C07 - - - - - - - - Toronto C08 1 $225,000 $225,000 $225,000 - 3 90% 49 Toronto C09 - - - - 1 1 - - Toronto C10 1 $270,000 $270,000 $270,000 - - 96% 38 Toronto C11 - - - - - - - - Toronto C12 - - - - - - - - Toronto C13 - - - - 1 1 - - Toronto C14 1 $197,000 $197,000 $197,000 1 - 99% 19 Toronto C15 - - - - - - - - Toronto East - - - - 1 2 - - Toronto E01 - - - - - - - - Toronto E02 - - - - 1 2 - - Toronto E03 - - - - - - - - Toronto E04 - - - - - - - - Toronto E05 - - - - - - - - Toronto E06 - - - - - - - - Toronto E07 - - - - - - - - Toronto E08 - - - - - - - - Toronto E09 - - - - - - - - Toronto E10 - - - - - - - - Toronto E11 - - - - - - - - SUMMARY OF EXISTING HOME TRANSACTIONS CO-OWNERSHIP APARTMENT, NOVEMBER 2014
- 25. Industrial Leasing Page 3 July 2010 Toronto Real Estate Board Market Watch, November 2014 25 FOCUS ON THE MLS® HOME PRICE INDEX INDEX AND BENCHMARK PRICE, NOVEMBER 2014 ALL TREB AREAS Index Benchmark Yr./Yr. % Chg. Index Benchmark Yr./Yr. % Chg. Index Benchmark Yr./Yr. % Chg. Index Benchmark Yr./Yr. % Chg. Index Benchmark Yr./Yr. % Chg. TREB Total 170.1 $518,900 7.73% 172.2 $640,300 8.71% 177.3 $500,900 8.71% 164.9 $361,200 6.66% 156.5 $314,300 4.26% Halton Region 178.1 $584,200 6.71% 175.4 $650,400 6.76% 178.8 $464,100 6.81% 166.5 $329,600 2.21% - - - Burlington 184.9 $532,900 8.00% 180.8 $617,900 7.30% 185.0 $441,000 9.73% 176.5 $354,400 2.20% - - - Halton Hills 160.1 $466,200 3.36% 159.7 $510,900 3.43% 171.4 $422,100 4.83% 155.5 $280,400 0.26% - - - Milton 168.3 $472,000 5.12% 157.0 $546,900 4.39% 171.1 $427,200 5.10% - - - - - - Oakville 187.5 $691,700 7.51% 186.7 $773,800 7.73% 189.7 $513,500 8.52% 166.5 $367,800 2.27% - - - Peel Region 161.9 $442,900 7.08% 164.1 $555,500 7.54% 166.2 $424,100 8.13% 164.9 $341,200 5.50% 140.9 $242,500 4.29% Brampton 156.4 $399,000 7.94% 156.7 $458,000 7.92% 158.4 $373,100 8.27% 149.9 $278,500 6.24% 130.1 $203,600 6.81% Caledon 150.5 $536,200 3.58% 150.9 $553,900 3.07% 165.3 $408,700 6.65% - - - - - - Mississauga 167.3 $467,600 6.83% 175.3 $653,200 7.88% 175.4 $479,400 8.20% 169.9 $364,900 5.53% 142.9 $250,200 3.93% City of Toronto 173.1 $567,300 6.98% 180.4 $782,100 8.87% 186.6 $618,800 8.61% 169.9 $410,900 6.52% 159.8 $330,000 3.97% York Region 182.8 $627,300 9.59% 184.0 $722,900 10.05% 187.4 $542,900 9.98% 166.3 $423,900 8.06% 156.0 $338,900 4.49% Aurora 172.6 $555,800 6.87% 171.2 $636,000 6.34% 178.0 $460,700 8.14% 143.9 $364,500 1.62% 153.1 $318,100 1.86% E. Gwillimbury 161.4 $521,800 8.54% 161.6 $530,800 8.09% 171.5 $363,100 7.79% - - - - - - Georgina 160.9 $333,900 8.42% 166.4 $342,800 8.26% 173.9 $342,700 9.99% - - - - - - King 168.5 $714,300 6.44% 170.1 $717,700 6.58% - - - - - - - - - Markham 190.3 $655,500 11.09% 195.6 $804,400 11.39% 195.6 $582,500 12.41% 171.9 $427,100 9.98% 158.2 $365,900 3.06% Newmarket 165.7 $488,700 8.16% 163.0 $548,700 8.59% 171.0 $403,000 8.43% 171.2 $345,700 6.14% 157.2 $264,700 3.15% Richmond Hill 191.4 $693,000 10.44% 203.3 $861,300 12.07% 196.7 $595,900 9.52% 154.3 $436,300 6.27% 151.0 $314,500 2.30% Vaughan 179.6 $649,200 8.06% 172.5 $717,900 7.81% 183.8 $559,500 7.55% 176.7 $482,800 9.28% 158.1 $350,800 8.73% Whitchurch-Stouffville 186.0 $701,300 13.55% 185.5 $711,800 12.70% 166.4 $457,100 14.68% - - - - - - Durham Region 153.7 $361,700 9.71% 152.5 $397,600 9.16% 159.3 $319,100 10.40% 146.7 $241,100 12.67% 149.9 $268,200 13.22% Ajax 161.6 $399,300 9.78% 161.0 $431,200 9.30% 168.2 $361,700 9.86% 153.2 $280,000 14.67% 144.0 $244,500 11.63% Brock 132.5 $251,200 6.43% 133.2 $253,100 6.47% 150.6 $240,000 11.97% - - - - - - Clarington 148.2 $313,600 8.41% 143.5 $344,900 7.65% 152.1 $290,400 9.98% 163.3 $292,300 9.30% 150.9 $213,600 12.61% Oshawa 146.6 $280,500 9.24% 145.1 $308,900 8.61% 153.2 $256,600 10.53% 128.8 $172,300 11.23% 146.1 $174,800 9.11% Pickering 161.5 $436,900 10.47% 161.2 $504,300 8.85% 165.9 $386,700 10.97% 158.5 $285,900 13.78% 155.4 $304,300 15.37% Scugog 154.7 $401,500 10.34% 158.9 $409,200 9.97% 150.1 $314,100 18.47% - - - - - - Uxbridge 148.3 $453,500 9.37% 148.8 $460,900 8.53% 145.2 $356,300 12.12% - - - - - - Whitby 155.5 $405,700 10.68% 156.6 $449,900 10.91% 158.3 $349,200 10.24% 147.6 $270,600 12.41% 147.0 $286,700 12.64% Dufferin County 154.0 $352,900 4.76% 159.5 $363,400 5.35% 151.5 $284,000 3.63% - - - - - - Orangeville 154.0 $352,900 4.76% 159.5 $363,400 5.35% 151.5 $284,000 3.63% - - - - - - Simcoe County 151.3 $321,500 6.18% 147.5 $325,300 6.04% 156.8 $301,100 6.31% - - - - - - Adjala-Tosorontio 137.0 $431,500 3.55% 136.9 $431,700 3.56% - - - - - - - - - Bradford West Gwillimbury 163.3 $405,900 8.72% 148.4 $454,600 9.52% 167.6 $348,400 7.92% - - - - - - Essa 144.9 $328,600 1.05% 142.3 $352,000 1.07% 148.3 $252,600 1.71% - - - - - - Innisfil 153.7 $284,800 7.71% 153.7 $285,300 6.96% 170.1 $264,600 15.24% - - - - - - New Tecumseth 135.8 $313,700 1.04% 132.3 $340,800 0.92% 142.7 $273,000 1.64% - - - - - - Townhouse Apartment ! TURN PAGE FOR CITY OF TORONTO TABLES OR CLICK HERE: Composite Single-Family Detached Single-Family Attached CLICK HERE FOR MORE BACKGROUND INFORMATION ON THE MLS® HPI
- 26. Industrial Leasing Page 3 July 2010 Toronto Real Estate Board Market Watch, November 2014 26 FOCUS ON THE MLS® HOME PRICE INDEX INDEX AND BENCHMARK PRICE, NOVEMBER 2014 CITY OF TORONTO Index Benchmark Yr./Yr. % Chg. Index Benchmark Yr./Yr. % Chg. Index Benchmark Yr./Yr. % Chg. Index Benchmark Yr./Yr. % Chg. Index Benchmark Yr./Yr. % Chg. TREB Total 170.1 $518,900 7.73% 172.2 $640,300 8.71% 177.3 $500,900 8.71% 164.9 $361,200 6.66% 156.5 $314,300 4.26% City of Toronto 173.1 $567,300 6.98% 180.4 $782,100 8.87% 186.6 $618,800 8.61% 169.9 $410,900 6.52% 159.8 $330,000 3.97% Toronto W01 163.2 $666,000 4.75% 169.9 $875,700 8.49% 178.7 $689,500 8.70% 198.7 $409,100 -2.26% 136.7 $319,000 -0.07% Toronto W02 191.1 $689,300 3.13% 195.6 $802,900 7.83% 216.8 $664,100 3.48% 146.9 $405,000 5.68% 135.4 $562,800 5.04% Toronto W03 181.8 $469,600 8.28% 185.9 $505,600 7.77% 188.2 $482,200 9.87% - - - 131.7 $244,300 2.25% Toronto W04 159.2 $416,900 6.77% 167.4 $528,300 6.76% 163.7 $476,700 9.21% 135.3 $329,200 -1.89% 140.9 $207,600 6.74% Toronto W05 147.4 $350,900 3.80% 160.5 $535,100 5.04% 148.8 $435,200 4.64% 146.8 $241,700 -0.81% 126.1 $165,600 2.69% Toronto W06 157.3 $456,600 7.74% 190.0 $603,000 10.66% 160.3 $486,000 11.71% 165.6 $487,900 1.85% 127.7 $315,900 3.65% Toronto W07 171.0 $728,800 9.20% 178.0 $769,300 9.00% 165.2 $677,400 11.25% 138.3 $508,400 0.73% 110.4 $447,700 0.55% Toronto W08 150.2 $611,100 4.96% 164.3 $859,400 7.88% 168.9 $634,500 8.06% 149.6 $365,700 2.75% 134.3 $270,400 2.28% Toronto W09 158.8 $408,100 8.77% 172.8 $646,500 8.75% 159.0 $450,100 10.49% 141.1 $357,900 2.32% 135.4 $173,600 7.04% Toronto W10 151.2 $350,900 7.01% 163.0 $479,600 6.40% 158.8 $431,500 5.10% 140.1 $252,400 6.54% 131.7 $201,100 6.21% Toronto C01 187.7 $465,600 3.36% 200.2 $706,700 7.58% 213.2 $739,700 8.94% 180.8 $542,700 5.85% 183.0 $380,900 1.89% Toronto C02 186.6 $886,000 7.80% 173.5 $1,375,200 11.00% 195.2 $1,027,100 11.93% 185.2 $866,100 10.44% 182.8 $509,800 3.63% Toronto C03 193.8 $997,400 11.51% 188.7 $1,137,200 10.16% 196.8 $728,600 10.31% - - - 204.7 $540,800 19.36% Toronto C04 167.8 $1,039,600 7.22% 174.0 $1,216,300 6.75% 172.3 $823,700 6.89% 156.4 $584,300 1.82% 139.5 $331,700 9.07% Toronto C06 180.1 $712,700 7.59% 186.8 $799,500 9.37% 154.0 $566,400 5.34% 151.4 $413,100 4.05% 174.3 $385,400 5.44% Toronto C07 169.9 $583,500 6.05% 196.3 $898,600 9.85% 164.8 $585,700 4.63% 144.0 $422,700 5.34% 150.6 $354,700 1.35% Toronto C08 178.3 $459,100 9.32% 159.7 $496,300 9.23% 192.2 $795,500 16.34% 184.7 $560,100 3.76% 177.5 $391,500 8.70% Toronto C09 134.5 $998,800 5.74% 129.3 $1,624,200 11.37% 149.5 $1,216,600 10.01% 169.9 $877,000 9.97% 135.6 $449,300 0.22% Toronto C10 190.7 $743,900 6.60% 181.8 $1,115,600 8.60% 183.7 $907,300 9.74% 225.8 $517,800 8.45% 194.8 $466,700 5.93% Toronto C11 171.7 $615,200 12.00% 175.8 $1,177,000 14.53% 199.7 $876,200 13.98% 118.1 $188,400 -0.67% 167.7 $238,700 9.61% Toronto C12 160.4 $1,374,600 6.65% 149.4 $1,605,600 5.43% 170.8 $738,000 1.43% 185.7 $629,000 15.92% 184.3 $579,700 6.84% Toronto C13 163.4 $602,800 7.29% 176.0 $943,000 8.04% 163.8 $525,500 7.69% 170.2 $484,700 12.05% 147.1 $291,000 4.55% Toronto C14 178.3 $605,900 5.44% 211.4 $1,146,900 11.91% 188.9 $921,500 0.00% 220.7 $745,700 1.24% 161.4 $405,900 2.09% Toronto C15 176.3 $589,400 10.60% 204.1 $956,700 15.57% 188.6 $615,500 15.99% 180.5 $444,700 5.00% 145.7 $340,500 5.20% Toronto E01 207.0 $642,900 10.22% 204.5 $689,000 11.02% 217.0 $680,800 11.63% 201.4 $407,300 -0.59% 190.3 $451,400 8.13% Toronto E02 185.8 $691,100 3.57% 170.8 $752,200 1.43% 195.7 $652,700 4.37% 163.2 $545,600 2.58% 182.8 $483,700 7.53% Toronto E03 176.0 $542,200 10.55% 180.0 $604,700 12.08% 174.8 $569,200 8.57% - - - 139.4 $208,500 6.33% Toronto E04 175.6 $440,800 6.62% 180.3 $532,400 6.43% 176.5 $428,200 8.08% 177.0 $382,500 10.01% 173.3 $262,500 4.21% Toronto E05 170.1 $454,900 10.81% 189.8 $670,200 9.58% 186.0 $512,700 10.78% 171.5 $372,800 10.93% 146.3 $287,400 12.02% Toronto E06 185.9 $525,300 6.59% 186.4 $532,700 6.09% 195.3 $461,900 8.26% - - - 172.4 $380,100 11.59% Toronto E07 182.4 $449,700 9.81% 202.7 $663,400 12.86% 193.2 $505,000 11.74% 180.3 $389,900 13.18% 160.2 $274,300 7.37% Toronto E08 167.7 $411,000 7.92% 178.3 $556,600 6.13% 169.4 $433,600 10.14% 172.4 $349,000 10.37% 144.9 $231,300 12.67% Toronto E09 164.3 $396,700 7.81% 179.2 $510,000 9.54% 167.3 $410,600 9.92% 160.5 $295,800 9.33% 147.2 $276,100 4.92% Toronto E10 177.6 $502,800 12.26% 178.1 $570,100 11.38% 173.0 $450,000 10.40% 183.9 $322,100 12.89% 139.1 $224,200 13.64% Toronto E11 165.6 $365,100 11.07% 186.5 $517,900 10.42% 177.7 $403,200 10.58% 134.3 $263,900 13.52% 130.9 $195,400 7.74% Composite Single-Family Detached Single-Family Attached Townhouse Apartment CLICK HERE FOR MORE BACKGROUND INFORMATION ON THE MLS® HPI
- 27. Page 3 July 2010 Toronto Real Estate Board Market Watch, November 2014 27 YEAR SALES AVERAGE PRICE 2003 78,898 $293,067 2004 83,501 $315,231 2005 84,145 $335,907 2006 83,084 $351,941 2007 93,193 $376,236 2008 74,552 $379,347 2009 87,308 $395,460 2010 85,545 $431,276 2011 89,096 $465,014 2012 85,496 $497,130 2013 87,053 $522,963 January 4,230 $482,028 February 5,615 $509,447 March 7,536 $517,247 April 9,537 $524,823 May 9,945 $540,581 June 8,821 $529,614 July 8,367 $512,286 August 7,390 $501,742 September 7,257 $532,455 October 7,940 $539,354 November 6,354 $538,347 December 4,058 $520,189 Annual 87,053 $522,963 January 4,103 $526,965 February 5,696 $552,857 March 8,052 $557,982 April 9,661 $578,358 May 11,017 $584,902 June 10,137 $569,284 July 9,158 $550,658 August 7,573 $546,782 September 8,009 $574,338 October 8,537 $587,795 November 6,519 $577,936 December - - Year-to-Date 88,462 $567,198 HISTORIC ANNUAL STATISTICS1,6,7 2014 MONTHLY STATISTICS1,7 2013 MONTHLY STATISTICS1,7 *For historic annual sales and average price data over a longer time frame go to: http://www.torontorealestateboard.com/market_news/market_watch/histori c_stats/pdf/TREB_historic_statistics.pdf NOTES 8SNLR = Sales-to-New Listings Ratio. Calculated using a 12-month moving average (sales/new listings). 9Mos. Inv. = Months of Inventory. Calculated using a 12-month moving average (active listings/sales). 7Past monthly and year-to-date figures are revised on a monthly basis. 1Sales, dollar volume, average sale prices and median sale prices are based on firm transactions entered into the TorontoMLS® system between the first and last day of the month/period being reported. 2New listings entered into the TorontoMLS® system between the first and last day of the month/period being reported. 3Active listings at the end of the last day of the month/period being reported. 4Ratio of the average selling price to the average listing price for firm transactions entered into the TorontoMLS® system between the first and last day of the month/period being reported. 5Average number of days on the market for firm transactions entered into the TorontoMLS® system between the first and last day of the month/period being reported. 6Due to past changes to TREB's service area, caution should be exercised when making historical comparisons. Copyright® 2014 Toronto Real Estate Board