Understanding Skills Shortages and Regional Economies
•
1 j'aime•3,920 vues

How are changing demographics affecting the economic heart of Greater Minnesota, its workforce?

Recommandé
Recommandé
Contenu connexe
Tendances
Tendances (19)
En vedette
En vedette (19)
Similaire à Understanding Skills Shortages and Regional Economies
Similaire à Understanding Skills Shortages and Regional Economies (20)
Plus de Center for Rural Policy & Development
Plus de Center for Rural Policy & Development (16)
Dernier
Dernier (9)
Understanding Skills Shortages and Regional Economies
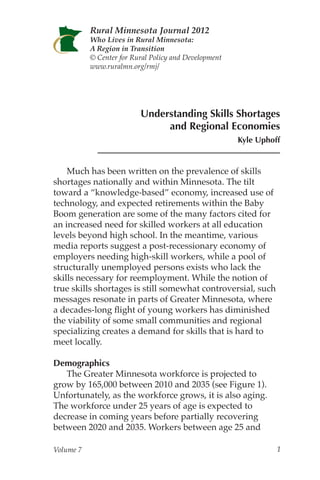
- 1. Rural Minnesota Journal 2012 Who Lives in Rural Minnesota: A Region in Transition © Center for Rural Policy and Development www.ruralmn.org/rmj/ Understanding Skills Shortages and Regional Economies Kyle Uphoff Much has been written on the prevalence of skills shortages nationally and within Minnesota. The tilt toward a “knowledge-based” economy, increased use of technology, and expected retirements within the Baby Boom generation are some of the many factors cited for an increased need for skilled workers at all education levels beyond high school. In the meantime, various media reports suggest a post-recessionary economy of employers needing high-skill workers, while a pool of structurally unemployed persons exists who lack the skills necessary for reemployment. While the notion of true skills shortages is still somewhat controversial, such messages resonate in parts of Greater Minnesota, where a decades-long flight of young workers has diminished the viability of some small communities and regional specializing creates a demand for skills that is hard to meet locally. Demographics The Greater Minnesota workforce is projected to grow by 165,000 between 2010 and 2035 (see Figure 1). Unfortunately, as the workforce grows, it is also aging. The workforce under 25 years of age is expected to decrease in coming years before partially recovering between 2020 and 2035. Workers between age 25 and Volume 7 1
- 2. Rural Minnesota Journal Figure 1: Workforce projections by age for Greater Minnesota (non- Twin Cities,) 2000-2035. 800,000 700,000 600,000 500,000 400,000 300,000 200,000 100,000 0 2000 2005 2010 2015 2020 2025 2030 2035 Age 16-24 Age 25-44 Age 45-64 Age 65 plus Source: Minnesota Office of the State Demographer, Workforce Projections. 44 will grow before reaching a plateau in 2020. Workers between the ages of 45 and 64 have already reached that plateau. Indeed, the only group that seems to be growing is the age 65+ cohort. The message of this chart is that most of our future labor (about three quarters) is already working or is at least of working age. If employers require a more skilled workforce, the old model of training young workers may not be sufficient to meet demand. To put these projections into perspective, the Minnesota Department of Employment and Economic Development projects job growth of about 159,000 jobs in Greater Minnesota between 2010 and 2020. In that ten- year span, however, the workforce is expected to grow by only 98,500. That leaves more than 60,000 jobs potentially unfilled. 2 Volume 7
- 3. Uphoff There are a number of ways this job gap could be managed. Obviously, the area outside of the Twin Cities is highly diverse in terms of industry makeup and demographic trends. Table 1 shows projected regional job growth and the top three industries expected to grow jobs. Potential workforce challenges could be met by an influx of new workers looking for employment or higher wages, as is happening in western North Dakota. Workers may stay in the labor force longer, as is portrayed in Figure 1, or perhaps hold multiple jobs. The Table 1: Projected employment growth by region and top three industries: Greater Minnesota, 2010-2020. Total Regional Top Three Regional Growth Projected Projected Job Industries Job Growth Region Growth Health Care & Social Assistance 16,314 Central 51,622 Construction 6,043 Retail Trade 4,461 Health Care & Social Assistance 9,875 Northeast 20,350 Construction 1,772 Retail Trade 1,445 Health Care & Social Assistance 10,627 Northwest 36,235 Manufacturing 4,238 Construction 3,573 Health Care & Social Assistance 17,564 Southeast 36,384 Retail Trade 3,468 Construction 2,954 Health Care & Social Assistance 8,052 Southwest 21,377 Manufacturing 2,157 Construction 2,131 Source: Minnesota Dept. of Employment and Economic Development, 2010-2020 Regional Projections. Volume 7 3
- 4. Rural Minnesota Journal region might also see an increase in persons commuting daily across borders. On the other hand, worker shortages could result in lower job growth if employers choose to rely on new- labor saving technologies or, in the worst case, simply leave the region. And more might be expected of the population that already works in Greater Minnesota. Educational Attainment Access to a skilled workforce is critical to maintaining the economic vitality of any region. Greater Minnesota has a relatively high level of educational attainment and might be well placed to take on additional training needs. Over half the population over the age of 25 has some Figure 2: Educational attainment of persons age 25 and over in Greater Minnesota (non-Twin Cities). Graduate or professional degree Less than 7% HS education 10% Bachelor's degree 15% Associate's degree 11% High school graduate 34% Some college 23% Source: U.S. Census, American Community Survey. 4 Volume 7
- 5. Uphoff education beyond high school (56%, see Figure 2). Even when counties encompassed by metropolitan areas (e.g. Fargo-Moorhead, St. Cloud, Rochester, etc.) are taken out of the analysis, 52.5% of the population has some amount of training beyond high school. In the seven counties of the Twin Cities Metropolitan Region, 69.8% of persons over age 25 have higher amounts of education. The disparity in educational attainment between rural and metropolitan areas or across different regions within the state reflects the industrial makeup and occupational needs of the different regions. Industries such as finance or software development require a highly trained workforce and often cluster in urban areas. Manufacturing might require people with a range of educational preparation, from high school diplomas to associate’s degrees and four-year degrees, while tourism-related jobs may require little education outside of on-the-job training. However, many rural areas are at a disadvantage in that they lack dense labor markets— geographically compact markets with high numbers of employers, workers, and training institutions. Demand for workers with a particular skill may not reach a critical mass necessary for training institutions to create (or maintain) a program. For instance, Anoka County has 243 firms (7,951 jobs) involved in the production of fabricated metal as of First Quarter 2012. In the seven counties of Northwestern Minnesota that comprise Economic Development Region 1 (Kittson, Marshall, Norman, Pennington, Polk, Red Lake and Roseau), there are nine such firms employing 199 workers spread out over an area that is about 19 times the area of Anoka County. The industry is important in both regions, and both regions maintain quality training programs. However, an institution in Anoka County may find it easier to develop a new program across employers given the high density of firms and larger potential pool of workers. Volume 7 5
- 6. Rural Minnesota Journal Figure 3: Annual Employment Growth: Minnesota, Metro and Greater Minnesota, Q1 2000-2012 3.5% 3.0% 2.5% 2.0% 1.5% 1.0% 0.5% 0.0% -0.5% -1.0% -1.5% -2.0% -2.5% -3.0% -3.5% 2000 2001 2002 2003 2004 2005 2006 2007 2008 2009 2010 2011 -01 -02 -03 -04 -05 -06 -07 -08 -09 -10 -11 -12 Greater MN Metro Minnesota Source: Minnesota Dept. of Employment and Economic Development, Quarterly Census of Employment and Wages. One percent of workers requiring new training in Anoka County would yield 80 students compared to only 2 in EDR 1. In the face of shortage, employers may find themselves drawing upon labor well beyond their region or training existing staff. Prior to shutting down due to the recent recession, Suzlon, a maker of wind turbines, engaged in a program of busing workers to their plant in Pipestone from Worthington, a city one hour away. With potential employers spread out over large distances, skilled workers may not find immediate employment opportunities that draw upon their skills and interests. In such a case, anecdotal evidence of skills shortages coexisting with underemployment is sure to exist. In any case, labor mobility is necessary to fulfill the supply and demand sides of the labor market. 6 Volume 7
- 7. Uphoff Supply and Demand Labor conditions in Greater Minnesota are often different from those of the state as a whole or the Twin Cities Metro Region. The 2007-08 recession impacted Greater Minnesota less than the state as a whole or the Twin Cities Metro, though the recovery has also brought less job growth (see Figure 3). At 5.6%, the August 2012 unemployment rate in the balance of Minnesota without the Twin Cities was equal to the state seasonally unadjusted rate and compared well with 5.7% in the Twin Cities. However, counties in Greater Minnesota have the highest unemployment rates, with the top ten rates being in northern and east central Minnesota. One rough measure of the mismatch between labor supply and demand is a comparison of the number of job openings with the actual number of unemployed workers. Figure 4 shows the ratio of unemployed workers to job vacancies for Second Quarter 2012. Ratios vary from relatively tight labor markets in the west central region (EDR 4) where the ratio stands at 1.6 to a much looser labor market in east central Minnesota (EDR 7e) where the ratio stands at 8 job seekers for every job opening. Incidentally, this represents an improvement from a 32-to-1 ratio in 2009. Potential skills shortages are more likely to occur in parts of western Minnesota, whereas long-term unemployment may be occurring in the northern and east central parts of the state. All Skills are Local As the labor market recovers, the potential for workforce shortages are likely to increase. The data in Figure 4 point to a simple disconnect between jobs and “warm bodies,” the simplistic assumption that one person can fill any one job. Obviously, employer needs are more complex and vary with each industry. Table 2 lists a set of skilled occupations that have high location Volume 7 7
- 8. Rural Minnesota Journal Figure 4: Ratio of Unemployed per Job Vacancy Figure 4: Ratio of unemployedQ2 2012 by EDR, per job vacancy by Economic Development Region, Q2 2012. 2.8 3 3.6 2.1 1.6 8 # Unemployed/Job Opening 1.6 2.9 1.7 - 2.5 2.6 - 3.0 2.3 3.1 - 3.6 3.3 2.5 3.7 - 8.0 2 2.9 2.3 Source: Minnesota Dept. of Employment and Economic Development, Minnesota Job Vacancy Survey. quotients (LQ) in Greater Minnesota. Occupations with high location quotients are those that have a high concentration in a particular area compared to the nation as a whole. For example, one might expect automotive assembly jobs to have a high location quotient in Detroit. The magnitude of the location quotient indicates the degree to which that occupation is concentrated in the region. For instance, there are 5.4 times more farm 8 Volume 7
- 9. Uphoff Table 2: Distinguishing high-skill occupations in Greater Minnesota. Projected Median Employment Hourly Wage Location Change (MN, Q2 Occupation Quotient 2010-2020 2012) Farm Equipment Mechanics 5.44 510 $17.86 Soil & Plant Scientists 3.98 340 $30.01 Conservation Scientists 3.30 60 $28.83 Zoologists & Wildlife Biologists 3.12 80 $26.24 Stationary Engineers & Boiler Operators 2.91 260 $26.91 Ag./Food Science Technicians 2.83 170 $17.69 Locomotive Engineers 2.56 350 $24.82 Industrial Engineering Technicians 2.39 290 $24.95 Electrical Power Line Installers & Repairers 2.34 880 $24.80 Numerical Tool & Process Control Programmers 2.00 120 $24.80 Forest/Conservation Technicians 2.00 300 $18.97 Welders & Related 1.79 2,290 $18.50 Licensed Practical and Vocational Nurses 1.78 5,360 $19.35 Occupational Therapist Assistants 1.75 210 $19.78 Surgeons 1.72 280 >$80.00 Medical & Clinical Lab Technologists 1.71 840 $28.86 Mechanical Engineering Technicians 1.71 160 $25.75 Chiropractors 1.67 350 $32.88 Bus/Truck Mechanics & Diesel Engine Specialists 1.62 1,120 $20.92 Mechanical Drafters 1.61 330 $24.95 Tool and Die Makers 1.61 50 $22.91 Civil Engineering Technicians 1.60 180 $27.65 Industrial Machinery Mechanics 1.59 1,660 $23.02 Source: Minnesota Dept. of Employment and Economic Development, Occupational Employment Statistics and 2010-2020 Regional Projections; U.S. Bureau of Labor Statistics, Occupational Employment Statistics. Volume 7 9
- 10. Rural Minnesota Journal equipment mechanics per worker in Greater Minnesota than in the U.S. as a whole. Table 2 represents a small part of the special workforce needs of Greater Minnesota. Obviously, these needs are going to vary by region, with Northeast Minnesota needing skilled mining workers and the Rochester area requiring more healthcare workers. The list above is instructive, though, in that it shows a heavy reliance on workers employed in natural resources, agriculture, transportation, utilities, manufacturing, and healthcare. Indeed, manufacturing represents 13.6% of total jobs in Greater Minnesota compared to 11.6% in Minnesota and 10.4% in the Twin Cities. Healthcare is another big employer, accounting for 20.2% of employment compared to 16.7% of state and 14.5% of Metro employment. Rural Minnesota’s aging populations and wider spaces (more healthcare facilities spread over a large area) create a relatively high need for healthcare workers. Table 2 is more than a snapshot of skilled occupations representative of Greater Minnesota. These examples represent a slice of the occupations that are particularly critical to industries in the region and are thus critical to the economic health of the region. Life scientists are needed not only to maintain the health of natural resource-driven industries such as forestry and agriculture but also the tourism industry in some cases. Engineering, food science, and production workers support the manufacturing sectors that are particularly strong in Greater Minnesota, such as machinery, food, and fabricated metals. Healthcare workers obviously serve the needs of local populations but also support the healthcare industry as a regional economic driver, as in the Rochester area. Concerns about economic vitality in rural Minnesota are driven in part by the prospect of workforce shortages. As the demographic trends laid out 10 Volume 7
- 11. Uphoff earlier in this article are borne out, prospects of regional “brain drains” become more likely. These occupations are not always expected to grow in large numbers over the next ten years. An increase of 50 tool and die makers or 100 food scientists may not seem particularly difficult to fill. However, small numbers of openings can still result in tight labor conditions. In Second Quarter 2012, there were 84 job openings for computer-controlled machine tool operators in Greater Minnesota, according to the Minnesota Job Vacancy Survey. This is certainly far less that the 563 openings for registered nurses or 1,511 openings for fast food workers. However, these 84 openings represent 8.0% of the total employment in that occupation in the region, a number indicative of tight though not necessarily shortage conditions. A Question of Degrees According to the Minnesota Office of Higher Education (OHE), in the 2009-10 academic year there were about 36,600 degrees and certificates conferred in Greater Minnesota (see Table 3). Two rounds of the Minnesota Job Vacancy Survey in 2010 found about 11,800 job openings in Greater Minnesota that required some education beyond high school. If one can extrapolate that number to an annual figure, one might find about 24,000 such openings in Greater Minnesota in 2010. This is obviously an over-simplification in many ways, but it shows some degree of surplus of educated workers against available openings. Of course, many of these students have no intention of staying in Greater Minnesota after graduation and will migrate to the Twin Cities or outside the state for employment or additional education. Indeed, producing more educated workers may be less important in some regions than retaining trained workers after graduation. Volume 7 11
- 12. Rural Minnesota Journal Table 3: Certificates and Degrees Awarded in Greater Minnesota, 2009-10 Academic Year. Number of Certificates & Degree/Certificate Awarded Degrees Awarded Award of Less than one Year 2,858 Award of at Least one but Less than Two Years 3,078 Associate’s Degree 8,245 Award of at Least Two but Less than Four Years 1,331 Bachelor’s Degree 17,123 Post-baccalaureate Certificate 633 Master’s Degree 3,131 Post Master’s Degree 49 Doctor’s Degree (Research) 79 Doctor’s Degree (Professional Practice) 96 Source: Minnesota Office of Higher Education. Table 4: Employment Projections for Greater Minnesota by Educational Preparation: 2010-2020. Educational Growth Replacement Total Percent Preparation Openings Openings Openings Growth Less than high school 52,735 91,127 145,101 16.3% High school diploma or equivalent 64,380 119,421 191,425 12.1% Some college, no degree 364 862 1,233 11.2% Postsecondary non-degree award 9,911 11,969 22,248 15.7% Associate’s degree 9,380 11,441 21,169 15.7% Bachelor’s degree 14,468 28,520 43,332 11.4% Master’s degree 2,172 3,206 5,398 14.8% Doctoral or professional degree 4,685 4,622 9,311 19.8% Source: Minnesota Dept. of Employment and Economic Development, Occupational Employment Statistics and 2010-2020 Regional Projections. 12 Volume 7
- 13. Uphoff Table 4 summarizes projected job growth for Greater Minnesota by educational preparation. The future economy will continue to produce jobs across the skill spectrum. Of all the jobs made available through growth and replacement, 23% will require some education beyond high school. The creation of higher-skill (and presumably higher-wage) jobs supports the creation of many more lower-paid jobs typical of much of the service sector. This is generally true in both the metropolitan and rural parts of the country. The issue of workforce shortage is less salient to these low-skill jobs since automation, multiple job-holding, or wage increases may solve potential labor shortages. The high-skill jobs deserve attention as these represent the occupations found in Table 2 and are critical to regional economic development. Obviously, labor conditions are not the same for all training levels: a bachelor’s degree in psychology might provide preparation for a variety of jobs but not necessarily for a higher demand job in welding or machining. Combining the results of Tables 3 and 4 provides some insights into where some areas of scarcity might occur. If one annualizes the 10-year projections above by simply dividing by 10, we would expect there to be about 4,300 openings in jobs requiring a bachelor’s degree. In most years, Greater Minnesota produces over 10,000 graduates (17,000 in 2009-10). A similar story plays out with jobs requiring associate’s degrees, growing at about 2,100 per year, while in comparison, 2009-10 produced 8,000 graduates. In other words, there are likely to be surpluses of workers with bachelor’s and associates degrees. Specific shortages could exist, however, in particular areas such as IT, engineering, or nursing, where graduate numbers are comparatively small, demand is projected to be very large, or students migrate to metropolitan areas in larger Volume 7 13
- 14. Rural Minnesota Journal Table 5: Projected employment change by occupational category: Greater Minnesota, 2010-2020. Occupational Growth Total Representative Occupations (Projected Group Rate Openings Openings) General & Operations Managers (2,470) Management 3.5% 23,040 Health & Medical Managers (1,080) Industrial Production Managers (710) Accountants & Auditors (2,400) Business & Management Analysts (960) Financial 16.3% 14,960 Operations Market Research Analysts (660) Software Developers (1,010) Computer & Computer Support Specialists (970) 15.5% 4,480 Math Network & Computer Systems Administrators (760) Mechanical Engineers (640) Architecture & Industrial Engineers (490) 9.2% 4,170 Engineering Mechanical Drafters (330) Clinical, Counseling, and School Psychologists (830) Sciences 12.2% 3,540 Biological Technicians (400) Forest & Conservation Technicians (300) Child, Family & School Social Workers (850) Community & Education, Guidance, School & 19.3% 11,110 Vocational Counselors (510) Social Services Substance Abuse & Behavior Counselors (490) Lawyers (860) Legal 12.6% 1,340 Paralegals and Legal Assistants (270) Court Reporters (60) Elementary School Teachers (2,840) Education, Secondary School Teachers (2,180) Training & 5.1% 18,820 Library Special Education Teachers (1,360) Registered Nurses (9,640) Healthcare Licensed Practical & Vocational Nurses Practitioners & 23.6% 31,610 (5,360) Technical Emergency Medical Technicians & Paramedics (1,720) Source: Minnesota Dept. of Employment and Economic Development, 2010-2020 Regional Projections. 14 Volume 7
- 15. Uphoff numbers. Although educational categories in Tables 3 and 4 do not match up precisely, the general trend is that Greater Minnesota does not have a problem producing graduates. The greater problem might be producing graduates in programs where there is demand and then keeping workers within the region. Table 5 lists projected employment conditions in various occupational categories in Greater Minnesota that typically require some amount of education beyond high school. Future labor shortages could potentially develop in some of these areas, particularly as the Baby Boom generation retires. When comparing the number of graduates in various programs with occupations, Greater Minnesota typically over-produces graduates when broadly compared to occupational needs. This is particularly true in an area of study such as psychology (1,081 graduates in 2010), where one year of graduates could satisfy 10 years of employment growth. Engineering (399 graduates) and information technology (663 graduates) programs might theoretically produce enough graduates, but the number of workers leaving for metropolitan areas might still leave the region short of workers. Conclusion While much of the data above does not support the notion of actual widespread workforce shortages across the entire state, there are bound to be local differences with regional employers having highly specific needs and demographic changes that have direct impacts on those needs. Minnesota State Colleges and Universities recently carried out a series of listening sessions across the state to determine the nature of shortages in various industries, including manufacturing, transportation, information technology, agriculture, and healthcare. The results are found at www.mnworkforceneeds.org Volume 7 15
- 16. Rural Minnesota Journal and indicate that employers have a wide range of needs around workforce ranging from very simple “soft skills” to highly specific technical knowledge. Those employers reported a range of difficulties in hiring as well, from a plentitude of applicants without ideal training or experience to a complete absence of applicants. Regional differences abound. For example, employers in northwest Minnesota have been particularly impacted by workers being lured to western North Dakota. A number of initiatives will help inform our workforce situation in coming months. The Workforce Data Quality Initiative, which links education data to employment data, will allow DEED to answer questions about where graduates work after school in terms of industry, wage, and geography. This will provide more information on the potential for “brain drain” in regions of the state, as well as the employment outcomes concerning programs without a clear-cut path between school and occupational employment (e.g. various liberal arts degrees). DEED is also carrying out a survey on skill needs around key areas in healthcare, manufacturing, and engineering. Preliminary results indicate that issues of shortages are highly complex and involve many factors, including working conditions (location and hours), relatively low wages, lack of experienced applicants, inadequate education, and poor work ethic. While the magnitude and nature of workforce shortages are being studied and debated, regional entities with a stake in workforce development will need to work together to solve present or future shortages. Educational providers need to work closely with employers to ensure that workers are graduating with the right skills. It is also important to help students make informed decisions about careers and what is available and critical. According to the 2010 American Community Survey, 13% of Minnesota bartenders have a bachelor of arts degree or 16 Volume 7
- 17. Uphoff higher. Twenty-two percent of retail sales workers have the same background. Presumably, these workers had different expectations when they received those degrees. It is essential that regional education institutions provide materials to students and parents that help them make informed decisions on high-demand occupations in their own backyards. Volume 7 17
- 18. Rural Minnesota Journal 18 Volume 7