The Future Roadmap for the Composable Data Stack - Wes McKinney - Data Counci...
Jrc jan 2012b
1. !
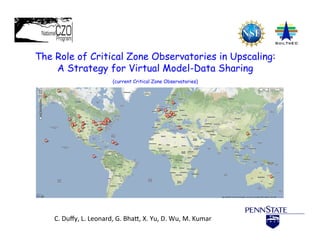
The Role of Critical Zone Observatories in Upscaling:
A Strategy for Virtual Model-Data Sharing
(current Critical Zone Observatories)
C.
Duffy,
L.
Leonard,
G.
Bha3,
X.
Yu,
D.
Wu,
M.
Kumar
2. 2,268 USGS
HUC 8
watersheds
The Watershed as Basis
For Model-Data Sharing
103,444 USGS
HUC 12
watersheds
4. Issues, Questions, Goals
Data
Issues:
What
&
Where
are
the
Essen=al
Terrestrial
Variables?
Simula=on
Framework:
What
scales,
processes,
computa=on
resources?
The
Role
of
Testbeds
&
Observatories
to
Scaling
Up
to
Con=nents
Unique
Cyberinfrastructure
Needs
for
Catchment
Data
and
Models?
Towards
a
prototype
for
sharing
geospa=al/temporal
data
and
models
Goal:
Scien=fic
discovery
and
improved
decision
making
5. What are the Essential Terrestrial Variables?
• Atmospheric Forcing (precipitation, snow cover, wind, relative
humidity, temperature, net radiation, albedo, photosynthestic
atmospheric radiation, leaf area index)
• Digital elevation models
• River/Stream Discharge
• Soil (class, hydrologic properties)
• Groundwater (levels, extent, hydro-geologic properties)
• Lake/Reservoir (levels, extent)
• Land Cover/Use (biomass, human infrastructure, demography,
ecosystem disturbance)
• Water Use
Most data reside on federal servers ….many petabytes
6. A-‐Priori
Data
Sources
Feature/
Property Source
Time Series
Porosity;
CONUS, SSURGO and STATSGO
Sand, Silt,
http://www.soilinfo.psu.edu/index.cgi?soil_data&conus
Soil Clay
http://datagateway.nrcs.usda.gov/NextPage.asp
Fractions;
http://www.ncgc.nrcs.usda.gov/products/datasets/statsgo/
Bulk Density
Bed Rock
Depth;
http://www.dcnr.state.pa.us/topogeo/,
Horizontal
Geology http://www.lias.psu.edu/emsl/guides/X.html
and Vertical
Hydraulic
Conductivity
http://glcf.umiacs.umd.edu/data/landcover/data.shtml,
http://ldas.gsfc.nasa.gov/LDAS8th/MAPPED.VEG/LDASmapveg.shtml;
LAI
Land Cover
Manning’s
Hernandez et. al., 2000
Roughtness
Topology:
From Node –
To Node, Derived using PIHMgis (Bhatt et. al., 2008)
Neighboring
Elements;
Manning’s
Dingman (2002)
Roughness;
River
Coefficient of
ModHms Manual (Panday and Huyakorn, 2004)
Discharge
Shape and Derived from regression using depth, width and discharge data from
Dimensions; http://nwis.waterdata.usgs.gov/usa/nwis/measurements
Prec, Temp.
Forcing RH, Wind, National Land Data Assimilation System : NLDAS-2
Rad.
DEM http://seamless.usgs.gov/
Streamflow http://nwis.waterdata.usgs.gov/nwis/sw
Groundwater http://nwis.waterdata.usgs.gov/nwis/gw
21. Benefits
• Scalable
compu=ng
power
in
real
fast
• Can
run
simula=ons
and
other
tasks
any
where
in
the
world
with
internet
• No
need
to
concern
about
machines
and
backups
22. Web Services for data access & rapid Model prototyping
Example of PIHM Web Services
24. Watershed Reanalysis for Assessing the
Impact of Climate and Landuse
Change
Re-analyze and assimilate past observations
with current modeling context
Reanalysis products produce space-time fields
valuable to scientists, stakeholders and
resource managers
37. Upscaling Model-Data-Process:
Chesapeake Bay
• Groundwater-Stream-Land-Surface model
• Fully coupled surface water, soil water,
groundwater, and land surface components
• C-N-Sediments
• Vegetation Growth
• Environmental Tracers
38. Data :: Climate :: NLDAS v2 (1979 – recent)
8km Hourly time-series
1. Precipitation
2. Temperature
3. Solar Radiation
4. Vapor Pressure
5. Relative Humidity
6. Wind Speed
We have developed
tools that extracts
forcing variables (from
NLDAS-2 grib2 data)
and formats all above
mentioned variables
according to PIHM
data structure
~3300
Climate
Grids
or
Time-‐series
Data
for
each
climate
variables!
38
39. Data :: Land Cover :: NLCD 2006 + Veg Parameters
Vegetation Parameters
1. Leaf Area Index (TS)
2. Roughness Length (TS)
3. Min. Stomata Resist.
4. Albedo
5. Vegetation Fraction
6. Rooting Depth
Vegeta:on
parameters
are
mapped
to
each
LC-‐type
using
custom
rou:nes
39
40. Data :: Soils :: SSURGO-STATSGO
Soil Hydraulic Properties
1. Sat. Hydraulic Cond.
2. Porosity
3. Residual porosity
4. van-Genuchten α
5. van-Genuchten β
6. Macropore fraction
6. Macropore K
for CB watersheds:
598 STATSGO classes
vs.
28,611 SSURGO classes
Pedo-‐transfer
func:ons
are
used
to
obtain
hydraulic
proper:es
from
texture
informa:on
40
41. Test Bed :: Juniata River Basin
The test-bed consists of:
97 HUC-12 units
Large
scale
applica:on
strategy
development
and
tes:ng
41
42. Scaling up to River Basins: Juniata River
DD statistics:
Number of Mesh: 85817
Smallest Area: 0.00096 sq. km
Largest Area: 0.02 sq. km
Shortest Edge: 0.027 km
Longest Edge: 1.360 km
Unit
Watershed
and
Parameteriza:on
42
43. HPC: Juniata River Domain Partitioning
Auto
execu=on
sequence
of
the
model
par==ons
would
be:
#1:
1,
2,
4,
5,
7,
9,10,
11,
13,
14,
17,
18,
21,
23,
25,
26
28
#2:
3,
6,
12,
19,
22,
24
#3:
8,
15
#4:
16
#5:
20
#6:
27
Headwaters
>>
Downstream
::
6
Step
Execu:on
43
44. Issues, Questions, Goals
Data
Issues:
What
&
Where
are
the
Essen=al
Terrestrial
Variables?
Simula=on
Framework:
What
scales,
processes,
computa=on
resources?
The
Role
of
Testbeds
&
Observatories
to
Scaling
Up
to
Con=nents
Unique
Cyberinfrastructure
Needs
for
Catchment
Data
and
Models?
Towards
a
prototype
for
sharing
geospa=al/temporal
data
and
models
Goal:
Scien=fic
discovery
and
improved
decision
making