Anandtara Iris Residences Mundhwa Pune Brochure.pdf
Case Shiller Home Prices Improve 10 09
1. Home Prices Continue to Improve According to
the S&P/Case-Shiller Home Price Indices
New York, October 27, 2009 – Data through August 2009, released today by Standard & Poor’s for its
S&P/Case-Shiller 1 Home Price Indices, the leading measure of U.S. home prices, show that the annual
rate of decline of the 10-City and 20-City Composites improved compared to last month’s reading. This
marks approximately seven months of improved readings in these statistics, beginning in early 2009.
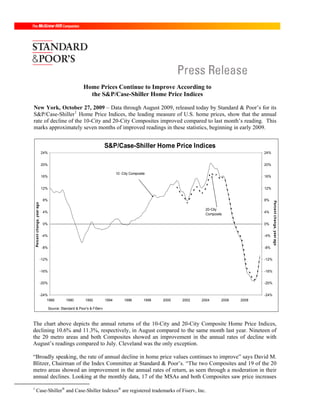
S&P/Case-Shiller Home Price Indices
24% 24%
20% 20%
10 -City Composite
16% 16%
12% 12%
8% 8%
Percent change, year ago
Percent change, year ago
20-City
4% 4%
Composite
0% 0%
-4% -4%
-8% -8%
-12% -12%
-16% -16%
-20% -20%
-24% -24%
1988 1990 1992 1994 1996 1998 2000 2002 2004 2006 2008
Source: Standard & Poor's & FiServ
The chart above depicts the annual returns of the 10-City and 20-City Composite Home Price Indices,
declining 10.6% and 11.3%, respectively, in August compared to the same month last year. Nineteen of
the 20 metro areas and both Composites showed an improvement in the annual rates of decline with
August’s readings compared to July. Cleveland was the only exception.
“Broadly speaking, the rate of annual decline in home price values continues to improve” says David M.
Blitzer, Chairman of the Index Committee at Standard & Poor’s. “The two Composites and 19 of the 20
metro areas showed an improvement in the annual rates of return, as seen through a moderation in their
annual declines. Looking at the monthly data, 17 of the MSAs and both Composites saw price increases
1
Case-Shiller® and Case-Shiller Indexes® are registered trademarks of Fiserv, Inc.
2. in August over July. While many of the markets remain down versus this time last year, the relative rate
of decline has shown some real improvement. California, in particular, has seen some real positive prints
in recent months. We see this general trend whether you look at the as-reported data or the seasonally
adjusted figures. Once again, however, we do want to remind people of the upcoming expiration of the
Federal First-Time Buyer’s Tax Credit in November and anticipated higher unemployment rates through
year-end. Both may have a dampening effect on home prices.”
250
S&P/Case-Shiller Home Price Indices 250
20-City
Composite
225 225
200 200
175 175
Both indices are back to their
Autumn 2003 levels
150 150
125 125
10 -City Composite
100 100
75 75
50 50
1987 1989 1991 1993 1995 1997 1999 2001 2003 2005 2007 2009
Source: Standard & Poor's and Fiserv
The chart above shows the index levels for the 10-City and 20-City Composite Indices. As of August
2009, average home prices across the United States are at similar levels to where they were in the autumn
of 2003. From the peak in the second quarter of 2006 through the trough in April 2009, the 10-City
Composite is down 33.5% and the 20-City Composite is down 32.6%. With the relative improvement of
the past few months, the peak-to-date figures through August 2009 are -30.2% and
-29.3%, respectively.
In terms of annual declines, all metro areas and the two composites remain in negative territory, albeit
most showing an improvement over the previous month’s figures. Dallas and Denver are continuing their
trend from the past month, edging closer into positive territory with August figures of -1.2% and -1.9%,
respectively. In addition, both New York and San Diego have emerged out of double-digit declines.
New York was down 9.6% in August and San Diego was down 8.9%.
In the monthly data, only Charlotte, Cleveland and Las Vegas reported monthly declines in August over
July. Minneapolis and San Francisco reported positive returns greater than +2.0%, and nine of the MSAs
plus the two Composites reported monthly returns greater than +1.0%.
The table on the next page summarizes the results for August 2009. The S&P/Case-Shiller Home Price
Indices are revised for the 24 prior months, based on the receipt of additional source data. More than 22
years of history for these data series is available, and can be accessed in full by going to
www.homeprice.standardandpoors.com
3. August 2009 August/July July/June
Metropolitan Area Level Change (%) Change (%) 1-Year Change (%)
Atlanta 111.19 1.0% 2.3% -10.6%
Boston 155.95 0.9% 1.2% -4.2%
Charlotte 120.72 -0.4% 0.6% -8.6%
Chicago 130.55 1.7% 2.7% -12.7%
Cleveland 107.42 -0.5% 1.5% -2.8%
Dallas 121.44 0.2% 1.2% -1.2%
Denver 130.07 1.0% 1.5% -1.9%
Detroit 71.59 1.9% 1.1% -22.6%
Las Vegas 105.78 -0.3% -1.1% -29.9%
Los Angeles 166.52 1.6% 1.8% -12.0%
Miami 148.91 1.1% 1.3% -18.8%
Minneapolis 122.66 3.2% 4.8% -13.7%
New York 174.89 0.5% 0.9% -9.6%
Phoenix 108.41 1.6% 1.8% -25.1%
Portland 150.46 0.3% 1.1% -12.5%
San Diego 153.34 1.6% 2.5% -8.9%
San Francisco 132.47 2.8% 3.3% -12.5%
Seattle 149.54 0.1% -0.1% -14.7%
Tampa 143.43 0.4% 1.4% -17.7%
Washington 178.84 1.4% 1.9% -7.9%
Composite-10 157.93 1.3% 1.7% -10.6%
Composite-20 146.00 1.2% 1.6% -11.3%
Source: Standard & Poor's and Fiserv
Data through August 2009
Since its launch in early 2006, the S&P/Case-Shiller Home Price Indices have published, and the markets
have followed and reported on, the non-seasonally adjusted data set used in the headline indices. For
analytical purposes, Standard & Poor’s does publish a seasonally adjusted data set covered in the
headline indices, as well as for the 17 of 20 markets with tiered price indices and the five condo markets
that are tracked. A summary of the monthly changes using the seasonally adjusted (SA) and non-
seasonally adjusted (NSA) data can be found in the table below.
August/July C hange (%) July/June Change (%)
Metropolitan Area NSA SA NSA SA
Atlanta 1.0% 0.5% 2.3% 1.6%
Boston 0.9% 1.0% 1.2% 0.6%
Charlotte -0.4% -0.4% 0.6% 0.1%
Chicago 1.7% 1.2% 2.7% 2.1%
Cleveland -0.5% -1.0% 1.5% 1.0%
Dallas 0.2% 0.0% 1.2% 0.8%
Denver 1.0% 1.0% 1.5% 0.7%
Detroit 1.9% 1.0% 1.1% -0.3%
Las Vegas -0.3% -0.8% -1.1% -1.8%
Los Angeles 1.6% 1.3% 1.8% 1.2%
Miami 1.1% 1.0% 1.3% 0.8%
Minneapolis 3.2% 2.3% 4.8% 3.5%
New York 0.5% 0.3% 0.9% 0.9%
Phoenix 1.6% 1.0% 1.8% 1.1%
Portland 0.3% 0.2% 1.1% 0.5%
San D iego 1.6% 1.5% 2.5% 2.0%
San Francisco 2.8% 2.6% 3.3% 2.8%
Seattle 0.1% -0.2% -0.1% -0.3%
Tampa 0.4% 0.4% 1.4% 0.5%
Washington 1.4% 1.2% 1.9% 1.6%
Composite-10 1.3% 1.0% 1.7% 1.3%
Composite-20 1.2% 1.0% 1.6% 1.2%
Source: Standard & Poor's and Fiserv
Data through August 2009
4. The S&P/Case-Shiller Home Price Indices are published on the last Tuesday of each month at 9:00 am
ET. They are constructed to accurately track the price path of typical single-family homes located in each
metropolitan area provided. Each index combines matched price pairs for thousands of individual houses
from the available universe of arms-length sales data. The S&P/Case-Shiller National U.S. Home Price
Index tracks the value of single-family housing within the United States. The index is a composite of
single-family home price indices for the nine U.S. Census divisions and is calculated quarterly. The
S&P/Case-Shiller Composite of 10 Home Price Index is a value-weighted average of the 10 original
metro area indices. The S&P/Case-Shiller Composite of 20 Home Price Index is a value-weighted
average of the 20 metro area indices. The indices have a base value of 100 in January 2000; thus, for
example, a current index value of 150 translates to a 50% appreciation rate since January 2000 for a
typical home located within the subject market.
These indices are generated and published under agreements between Standard & Poor’s and Fiserv, Inc.
The S&P/Case-Shiller Home Price Indices are produced by Fiserv, Inc. In addition to the S&P/Case-
Shiller Home Price Indices, Fiserv also offers home price index sets covering thousands of zip codes,
counties, metro areas, and state markets. The indices, published by Standard & Poor's, represent just a
small subset of the broader data available through Fiserv.
About Standard & Poor’s Index Services
Standard & Poor's Index Services, the world’s leading index provider, maintains a wide variety of
investable and benchmark indices to meet an array of investor needs. Over $1 trillion is directly indexed
to Standard & Poor's family of indices, which includes the S&P 500, the world's most followed stock
market index, the S&P Global 1200, a composite index comprised of seven regional and country
headline indices, the S&P Global BMI, an index with approximately 11,000 constituents, and the S&P
GSCI, the industry's most closely watched commodities index. For more information, please visit
www.standardandpoors.com/indices.
About Standard & Poor’s
Standard & Poor's, a subsidiary of The McGraw-Hill Companies (NYSE:MHP), is the world's foremost
provider of independent credit ratings, indices, risk evaluation, investment research and data. With
offices in 23 countries and markets, Standard & Poor's is an essential part of the world's financial
infrastructure and has played a leading role for nearly 150 years in providing investors with the
independent benchmarks they need to feel more confident about their investment and financial decisions.
For more information, visit http://www.standardandpoors.com
For more information contact:
David Blitzer David Guarino
Chairman of the Index Committee Communications
Standard & Poor’s Standard & Poor’s
212 438 3907 1 212 438 1471
david_blitzer@standardandpoors.com dave_guarino@standardandpoors.com