1. Task: LA 1.23 p 72
Statistical Significance & P Value:
Read pages 71
For results to be considered significant (IV did affect) the P value (probability of chance) has to be
< 0.05 = to 5/100 OR 5% (all 3 figures mean the same).
A statistical test is done on the results (comparison of control & experimental groups) which then gives the
experimenter a p value.
0.01 = 1/100 = 1% This is a very good result; it means that the IV did affect the DV. The experiment’s
results are significant. Null hypothesis is rejected because the chance factor is very low. Results could not of
been due to chance.
What if the probability of the results being due to chance were less than 1% or 1/100.
How do you write this out?
Remember: 1/100 = 10/1000 = 1% = 0.01 = 1/100 = 10/1000
These all mean the same thing: probability of chance is 1%.
If the probability of chance is less than 1% you would represent it like this:
*If just under 1% = 1/100 OR 10/1000 use this figure
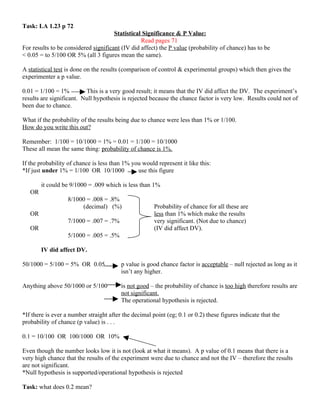
it could be 9/1000 = .009 which is less than 1%
OR
8/1000 = .008 = .8%
(decimal) (%) Probability of chance for all these are
OR less than 1% which make the results
7/1000 = .007 = .7% very significant. (Not due to chance)
OR (IV did affect DV).
5/1000 = .005 = .5%
IV did affect DV.
50/1000 = 5/100 = 5% OR 0.05 p value is good chance factor is acceptable – null rejected as long as it
isn’t any higher.
Anything above 50/1000 or 5/100 is not good – the probability of chance is too high therefore results are
not significant.
The operational hypothesis is rejected.
*If there is ever a number straight after the decimal point (eg; 0.1 or 0.2) these figures indicate that the
probability of chance (p value) is . . .
0.1 = 10/100 OR 100/1000 OR 10%
Even though the number looks low it is not (look at what it means). A p value of 0.1 means that there is a
very high chance that the results of the experiment were due to chance and not the IV – therefore the results
are not significant.
*Null hypothesis is supported/operational hypothesis is rejected
Task: what does 0.2 mean?
2. ____ = ____ = ____% = Is null or operational hypothesis supported?
100 1000
*To remember the p value limit that is acceptable think of our limit for alcohol consumption and driving
= 0.05*
Very Important: in the exam ensure that you are able to:
• Identify the decimal figures (what they mean).
• Explain the decimal figures. (eg; for a score of 0.08 – the probability of chance was higher than
0.05 therefore null hypothesis is supported the results of the experiment were not significant.
Operational hypothesis – rejected (IV did not affect DV).
• To write out an equation. (eg; p < 0.05 or p > 0.05)
Know what these mean:
< = less than > = more than < = equal to or less than >= equal to or more than
There will be multiple choice questions on this, maybe even part of a short answer. (Not required for sac 1)
* = exam
3. Independent & Dependent Variables
From the following examples identify the:
• Control group
• Experimental group
• Independent variable
• Dependent variable
1. A teacher wanted to identify whether a new textbook will enhance student knowledge. One class
used the old textbook while the other used the new one. At the end of the school year subjects
received a 90 multiple choice exam.
2. A researcher wants to test the efficiency of four new contraceptive drugs. Volunteers are
randomly assigned to each of the four groups or to a fifth group who receives a placebo (sugar
tablet).
3. Researchers wanted to investigate whether positive reinforcement of subjects would affect their
performance in a psychology course.
4. Researchers wanted to investigate the affect that sleep deprivation would have on subject motor
skills. One group were deprived of sleep for 24 hours and then asked to complete a test. The
other group had as much sleep as they required and were also asked to complete the test.
5. A researcher wanted to determine/compare the degree of social interaction undertaken by Prep
students who did not attend any day care centres and where cared for by mums at home compared
to children who attended Pre-school and playgroup.
4. Data:
Subjective Data: are those which are based on self reports given by subjects. This data is often biased as
subjects are usually required to provide personal information.
- Subjects are asked to give details about their mental experiences
- It is more detailed data but it is difficult to interpret accurately.
Objective Data: collected by direct observation.
- Data collected using an assessment device which yields a score such as an intelligence or aptitude
test are also considered to be objective.
- Easy to interpret.
Quantitative: can be expressed in units of measurement.
- Most psychological tests get quantitative data.
- Eg; scores of some sort (numbers)
Qualitative: usually takes the form of facts.
- Anything a person thinks, feels or does.
- Descriptions of observed phenomena and the conditions under which the phenomena occurs or
changes may be written or verbal.
Objectivity: Involves taking steps to prevent personal factors from influencing any aspect of the research or
its report.
- It requires that observations are made and recorded free of bias, prejudice or other personal
factors which may distort the data obtained.
Hawthorn Effect: well known experiments.
- When subjects are aware that they are members of an experimental group, performance may
improve simply because of the fact (rather than because of the IV to which they are exposed).
Experimenter Bias: involves not only the personal qualities and actions of the experimenter but also
unintentional biases in the collection and treatment of data.
- Self-fulfilling prophecy is an example of experimenter bias. It is the tendency of subjects to
behave according with how they believe an experimenter expects them to behave.
- Eg; experimenters facial expressions, mannerism, voice.
The experimental method is used to test a cause-effect relationship between variable.
IV affects DV.
* Correlation studies - positive or negative – relationship between 2 variables, not cause and effect.*