Analyzing Fibonacci levels to predict market bounce
•
0 j'aime•394 vues

Elliott wave zigzag, motive wave, corrective wave, counting waves, Fibonacci extension, Fibonacci retracement and nested waves are profiled in this report by TheMarketDetective.com

Recommandé
Contenu connexe
Similaire à Analyzing Fibonacci levels to predict market bounce
Similaire à Analyzing Fibonacci levels to predict market bounce (20)
Plus de David Waggoner
Plus de David Waggoner (6)
Dernier
Dernier (20)
Analyzing Fibonacci levels to predict market bounce
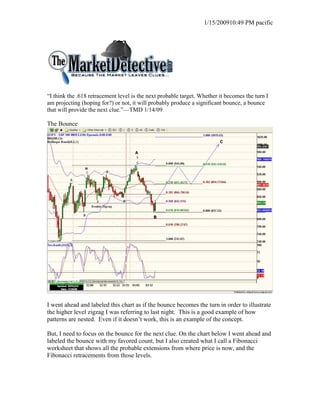
- 1. 1/15/200910:49 PM pacific “I think the .618 retracement level is the next probable target. Whether it becomes the turn I am projecting (hoping for?) or not, it will probably produce a significant bounce, a bounce that will provide the next clue.”—TMD 1/14/09 The Bounce I went ahead and labeled this chart as if the bounce becomes the turn in order to illustrate the higher level zigzag I was referring to last night. This is a good example of how patterns are nested. Even if it doesn’t work, this is an example of the concept. But, I need to focus on the bounce for the next clue. On the chart below I went ahead and labeled the bounce with my favored count, but I also created what I call a Fibonacci worksheet that shows all the probable extensions from where price is now, and the Fibonacci retracements from those levels.
- 2. 1/15/200910:49 PM pacific From here it is all about probability based on common Fibonacci extensions and retracements. If the e-minis turn down hard at 851 then I will monitor the retracement from .618 extension column. Retracement of a 5 wave motive set would most commonly be .500 or .618. If price breaks to the upside through the .618 level without a retracement, or a very shallow one, 865 becomes the target before retracing. I move to the retracement from 1.00 extension column. I will first look for a shallow retracement (price doesn’t go below the confluence of the .618 breakout / .250 retracement level). If it stays shallow, I now target the 1.618 Fibonacci extension of the first column. If that confluence level is broken to the downside, then I target the .500 level of the retracement from 1.00 extension column, then .618. Back to the positive scenario, if the 1.618 extension from the first column is reached with only shallow retracements, then I will target the .382 level of the retracement from 1.618 extension column. During this process I will scan many timeframes to try and gain additional wave count clues. At any point during the process, if price breaks lower than the expected
- 3. 1/15/200910:49 PM pacific retracement level, then the bias changes to down, and I look for patterns in the other direction. The most probable level for price to turn back down in the short-term is the 865 level which is a Fibonacci confluence with the .382 retracement level of the move down from the recent high (not shown.). Conversely, a break above this level would be very positive. TMD/DW The market detective provides personal market opinion based on sound technical analysis and research. However, no warranty is given or implied as to its true reliability. The market detective will make errors and mistakes. The market detective is not an investment adviser and is not making recommendations to buy, sell, or place orders relating to the futures contracts, ETFs, or stocks that he writes about. The responsibility for decisions made from information contained in this service are solely that of the individual subscriber. The individual must fully research and make his/her own decisions before acting on any information provided by the market detective. The market detective assumes no responsibility for subscriber investment or trading results.