Tools for Metabolomic Data Analysis and Visualization
•Télécharger en tant que PPTX, PDF•
3 j'aime•7,213 vues

This document discusses tools and methods for metabolomic data analysis and visualization. It covers visualization techniques like plots and networks to explore patterns in data. It also discusses statistical analysis methods like ANOVA and clustering for significance testing and pattern detection. Additionally, it discusses predictive modeling, network analysis using pathways, and network mapping to relate metabolites based on biochemical transformations, structural similarity, or empirical dependencies. Common analysis tasks and featured open-source tools are also highlighted.

Recommandé
Recommandé
Contenu connexe
Tendances
Tendances (20)
Similaire à Tools for Metabolomic Data Analysis and Visualization
Similaire à Tools for Metabolomic Data Analysis and Visualization (20)
Plus de Dmitry Grapov
Plus de Dmitry Grapov (9)
Dernier
Dernier (20)
Tools for Metabolomic Data Analysis and Visualization
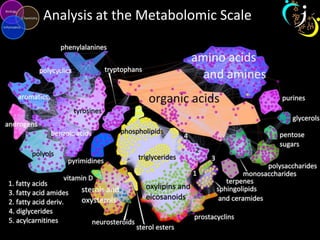
- 1. Analysis at the Metabolomic Scale
- 2. Dmitry Grapov, PhD Tools for Metabolomic Data Analysis and Visualization
- 3. 1. Visualization (how does it look?) • histograms, density plots, box plots, line plots, scatter plots, networks, etc. 2. Statistical Analysis (what is statistically significant?) • summary tables, ANOVA, FDR adjustment, power analysis, etc. 3. Exploration (what are the major patterns/trends?) • clustering, PCA, ICA, etc. 4. Predictive Modeling (what explains my hypothesis?) • mixed effects, partial least squares (O-/PLS/-DA), etc. 5. Network Analysis (how are things related?) • Pathway Enrichment • Biochemical, mass spectral, empirical, etc. 6. Network Mapping Common Data Analysis Tasks
- 4. Featured Tools Data Analysis and Visualization •DeviumWeb- Dynamic multivariate data analysis and visualization platform url: https://github.com/dgrapov/DeviumWeb •imDEV- Microsoft Excel add-in for multivariate analysis url: http://sourceforge.net/projects/imdev/ Network Analysis •MetaMapR- Network analysis tools for metabolomics url: https://github.com/dgrapov/MetaMapR Network Mapping • MetaMapR + DeviumWeb + Cytoscape
- 6. Network Mapping Visualization and analysis of statistical and multivariate results within a biochemical and/or empirical context. Conduct Data Analysis Generate Network Map Results to Network Grapov D., Fiehn O., Multivariate and network tools for analysis and visualization of metabolomic data, ASMS, June 08, 2013, Minneapolis, MN
- 7. Network Generation Biochemical • enzymatic transformations Structural Similarity • structural fingerprints • mass spectra Empirical (dependency) •correlation •partial-correlation BMC Bioinformatics 2012, 13:99 doi:10.1186/1471-2105-13-99
- 8. Metabolic Perturbations in Tumorigenesis Biochemical and chemical similarity network comparing changes in metabolites between tumor and control tissue Mappings: • direction of change • statistical significance • multivariate importance • molecular biochemical domain
- 11. Empirical Networks Experiment specific data driven relationships can offer novel insight into biochemical perturbations urea cycle nucleotide synthesis protein glycosylation
- 12. Mass Spectral Networks Use mass spectra as a proxy for structure to help make sense of unknown compounds’ biochemical identities. Mix and match different relationships to help narrow down structures of unknowns Partial derivatization products of glucose
- 14. Data visualization as form of data analysis DM Liver CYP2D6 Dextromethorphan = additives in dextrorphan •high fructose corn syrup • antioxidants •flavor
- 15. Identification of treatment effects
- 16. Differential metabolic responses Treatment 1 Treatment 2
- 17. Other Resources •TeachingDemos- Tutorials and Demonstrations in R •url: http://sourceforge.net/projects/teachingdemos/?source=directory •url: https://github.com/dgrapov/TeachingDemos •CDS Blog- Data analysis Case Studies and Tutorials url: http://imdevsoftware.wordpress.com/
- 18. dgrapov@ucdavis.edu metabolomics.ucdavis.edu This research was supported in part by NIH 1 U24 DK097154