Child and Maternal Health in Kenya 2011 Report

This report evaluates access to maternal and child healthcare and health outcomes in Kenya using geographic information systems (GIS), statistical analysis, and a comprehensive review of existing literature. It seeks to aid in identifying distributions of health facilities and services relative to key maternal and child health indicators (e.g., safe delivery, care and treatment of birth injuries, antenatal and postnatal care, immunization, and nutrition). It also seeks to contribute a portfolio of geospatial maps for identifying, analyzing, and monitoring health needs in one of the world’s poorest, most densely populated, and most vulnerable regions. In addition to identifying and analyzing information currently available, the report highlights limitations of both Kenya’s existing data sets and overreliance on distance as a measure of “access” and “use.” This report responds to a request from Direct Relief International (DRI) to identify healthcare access and health outcomes in Kenya as part of its multi-organizational collaborative project to enhance health services in an integrated and efficient manner. Along with the African Medical Research Foundation (AMREF), Marie Stopes International (MSI), and district-level health ministries in Kenya, Tanzania, and Uganda, DRI is attempting to determine critical gaps in health infrastructure.

Recommandé
Recommandé
Contenu connexe
Tendances
Tendances (20)
En vedette
En vedette (20)
Similaire à Child and Maternal Health in Kenya 2011 Report
Similaire à Child and Maternal Health in Kenya 2011 Report (20)
Plus de Direct Relief
Plus de Direct Relief (20)
Dernier
Dernier (20)
Child and Maternal Health in Kenya 2011 Report
- 1. University of Michigan Gerald R. Ford School of Public Policy Applied Policy Seminar, Winter 2012 Produced in Collaboration with Direct Relief International Child and Maternal Health in Kenya A Review and Analysis of Access and Outcomes Valerie Benka, Salvador Maturana, Devi Glick Winter 2012
- 2. Table of Contents Executive Summary ......................................................................................................................................... 2 Introduction ....................................................................................................................................................... 3 Background and Research Rationale ........................................................................................................ 4 Overview of the Kenyan Healthcare System .......................................................................................... 6 Background and History ........................................................................................................................... 6 Government health facilities ................................................................................................................... 7 Private health providers ........................................................................................................................... 8 Private-Public collaboration ................................................................................................................... 9 Health providers relevant to maternal and child health in Kenya ........................................ 10 Sector quality ............................................................................................................................................. 11 Literature review .......................................................................................................................................... 13 Use of GIS to analyze health care access and health outcomes .............................................. 13 Use of Spatial Data to analyze maternal/child health care and health outcomes in Kenya/East Africa .................................................................................................................................... 16 Limitations of spatial data/non-geographic factors influencing health care access and use .................................................................................................................................................................. 25 Conclusions ................................................................................................................................................. 27 Overview of data collected and available for analysis .................................................................... 28 Data sets ....................................................................................................................................................... 29 Survey Design ................................................................................................................................................. 33 General Approach ..................................................................................................................................... 33 Kenya SPA Survey Sample Design...................................................................................................... 35 Statistical Analysis ........................................................................................................................................ 36 Spatial analysis of data ................................................................................................................................ 36 Summary and conclusion ........................................................................................................................... 37 Works Cited ..................................................................................................................................................... 38 1
- 3. Executive Summary Access to maternal and child healthcare as well as health outcomes are of significant importance to researchers as a measure of equity and health system performance in Kenya. Through both qualitative and quantitative analysis we evaluated the body of literature and select data available on maternal and child health access and outcomes in Kenya. From existing studies there is strong evidence that distance does play a role in use of health facilities and obtainment of skilled medical care, though how big a role varies according to the particular study, the distances in question, the facilities available, and the urgency of the medical situation. Overall people in rural areas will have to travel further than people in urban areas. Studies suggest differential marginal benefit from adding health facilities based on the geographic area - adding new facilities in remote locations in Coast, Eastern, Rift Valley, and North Eastern will increase access more so than adding new facilities in Central, Nairobi, Nyanza, and Western provinces. Perceived or actual quality issues, education and perception were also found to affect facility choice and use. Studies showed a significant drop between women’s use of skilled providers for antenatal care and for delivery, and call out the need to educate women about the benefits of giving birth with the help of a skilled provider. Although the DHS and SPA datasets provided a wealth of data on the National and Provincial level, the sampling methodology limited our ability to do analysis at a smaller geographic scale than Province. We conducted a significant amount of statistical and spatial analysis of the DHS and SPA data at the Provincial level to illustrate what level of analysis is currently possible with the data. Our recommendation for DRI is to focus data collection on one province at a time and increase the geographic scale for which the data is representative. 2
- 4. Introduction This report evaluates access to maternal and child healthcare and health outcomes in Kenya using geographic information systems (GIS), statistical analysis, and a comprehensive review of existing literature. It seeks to aid in identifying distributions of health facilities and services relative to key maternal and child health indicators (e.g., safe delivery, care and treatment of birth injuries, antenatal and postnatal care, immunization, and nutrition). It also seeks to contribute a portfolio of geospatial maps for identifying, analyzing, and monitoring health needs in one of the world’s poorest, most densely populated, and most vulnerable regions. In addition to identifying and analyzing information currently available, the report highlights limitations of both Kenya’s existing data sets and overreliance on distance as a measure of “access” and “use.” This report responds to a request from Direct Relief International (DRI) to identify healthcare access and health outcomes in Kenya as part of its multi-organizational collaborative project to enhance health services in an integrated and efficient manner. Along with the African Medical Research Foundation (AMREF), Marie Stopes International (MSI), and district-level health ministries in Kenya, Tanzania, and Uganda, DRI is attempting to determine critical gaps in health infrastructure. The research team consisted of Valerie Benka (MPP/MS candidate), Devi Glick (MPP/MS candidate), and Salvador Maturana (MPP candidate), who completed this project as part of the Applied Policy Seminar at the University of Michigan’s Ford School of Public Policy. Devi completed the GIS analysis portion of the project, having taken multiple GIS courses in both her undergraduate and graduate studies. Valerie focused on research and data collection. She has experience working in central Kenya on health-related research (Q fever) and 3
- 5. with qualitative research methods. Finally, Salvador analyzed population data and health surveys. He has previously worked with such international datasets as the Integrated Public Use Microdata Series (IPUMS)-International Database, the Organisation for Economic Co-operation and Development (OECD) Social and Economic Indicators, the World Health Organisation (WHO) Mortality Database, the OECD Programme for International Student Assessment (PISA) Survey, and several national household surveys in Latin America Background and Research Rationale In 2000, the United Nations established eight Millennium Development Goals tied to eradicating poverty by 2015. Improving child and maternal health are two of the eight goals. The delivery of “equitable” health care in developing countries is key to achieving these goals, and an important indicator of a health system’s equity is a population’s access to and use of services (Noor et al. 2006, citing Daniels et al. 2000, Macinko and Starfield 2002). “Equity in service provision is increasingly being used as a measure of health system performance,” Noor et al. (2003) assert, and equity “manifests itself in the distribution, access to and utilization of health services between population groups.” The statement complements research showing that in sub-Saharan Africa, a person’s distance from a health facility has significant bearing on his or her “access” to health care (Noor et al. 2006). Distance, the authors argue, contributes to the time required to obtain health care, to delays in pursuing treatment, and to increases in both treatment expenditure and opportunity costs. In 1997, the Kenyan government’s health policy strategic framework stated that all citizens should have access to health services within a five-kilometer range of their home. This came as part of the government’s overall plans to restructure the health sector to “make all health 4
- 6. services more effective, accessible, and affordable” (Noor et al. 2003, citing Ministry of Health 1997). This metric was based on the assumption that improved physical access to health care could reduce delays in citizens’ decisions to seek health care and time traveled to obtain it (Noor et al. 2003, Moïsi et al. 2010, citing Kenya Ministry of Health 1997). The five-kilometer benchmark has been broadly utilized in subsequent literature analyzing Kenyans’ access to health care and health outcomes, and across the nation, indications are that a majority of the population does now have a health facility within 5 kilometers of their home (Moïsi et al. 2010). The following analysis focuses specifically on maternal and child health care “access” (a term whose complexity is discussed below) and health outcomes. There is extensive literature citing how both children and mothers living in developing countries experience extreme consequences due to inadequate medical care. In Kenya, most maternal deaths occur during labor, delivery, and the immediate postpartum period (Wanjira et al. 2011). The majority of maternal deaths in Kenya are due to obstetric complications, many of which could have been prevented with adequate medical care during and after delivery (Wanjira et al. 2011). Lack of adequate medical care can be attributed in part to the fact that only about 83 percent of expectant mothers access facilities during delivery, and in part to the fact that the care available at some facilities is sub-standard (Wanjira et al. 2011). Both of these issues are addressed below. Turning to children, it has been estimated that 41 percent of the 9.7 million global deaths of persons under five occur in Sub-Saharan Africa (Rutherford et al. 2010, citing Black et al. 2003). The United Nations (2012) estimates 55 infant (aged under one year) mortalities per one thousand live births. Although this number is both lower than in many other African countries and steadily decreasing, it still speaks to a failure on the part of the health system to adequately provide for Kenyan children; it has been estimated that between 41 and 72 percent of newborn 5
- 7. deaths in Sub-Saharan Africa could be avoided through adequate access to preventive health care and treatment and/or treatment (Rutherford et al. 2010, citing Haines et al. 2007). This report begins to disaggregate national-scale statistics and look at maternal health care access spatially, while also addressing some of the shortcomings and traps of using spatial data to identify so-called health care “access” disparities. Overview of the Kenyan Healthcare System Background and History Kenya’s health care system is comprised of public facilities with multiple tiers of care provision and specialization, as well as private and faith-based general hospitals and clinics. There are complexities with terminology insofar as some “public” health facilities are actually operated by non-government entities but referred to by this name because their services are available to all at low or no cost. In addition to stationary facilities, mobile clinics are relatively common in Kenya. Mobile clinics are oftentimes run by nongovernmental organizations and provide care to populations ranging from residents of Nairobi slums to rural pastoral populations in the country’s northern regions. Kenya’s centralized government health care system was blamed for yielding regional and provincial disparities in health services distribution and quality, inequities in resource allocation and access, and inconsistent indicators of health across regions (Ndavi et al. 2009). In response, Kenya’s Ministry of Health (MOH) has sought to strengthen management of district-level health care (Ndavi et al. 2009). This entails local District Health Management Boards (DHMBs) and District Health Management Teams (DHMTs) gradually assuming responsibility for the operation of facilities under their jurisdiction (Ndavi et al. 2009). In addition, the Kenya Medical 6
- 8. Research Institute (KEMRI), a national government body established through the Science and Technology (Amendment) Act of 1979, is responsible for carrying out health research in the country. Although it does not manage health facilities, its existence and activities have implications for the quality and sophistication of care provided within Kenya’s health system. KEMRI offices are located in the urban centers of Nairobi, Mombasa, and western Kenya alongside Lake Victoria. Government health facilities Approximately 41 percent of Kenya’s health care facilities are run by the government (Wamai 2009). The government health care system is organized according to “steps” (Muga et al. 2005). An overview of government health establishments, beginning with the least sophisticated, is below. Given what the various health providers are expected to provide, for purposes of providing cost-effective maternal and newborn government health services, it makes sense to focus on dispensaries and health centers. The government operates most of the country’s health centers and dispensaries (as well as hospitals) (Wamai 2009). Dispensaries are the most basic (i.e., least sophisticated) health facilities within Kenya’s public health system. They are designed to be the first contact for patients, offering preventive health care, basic outpatient curative care, and referrals to a higher-level health provider if necessary (Muga et al. 2005). Dispensaries are staffed by “enrolled” nurses (entry-level nurses who practice under the supervision of a registered nurse), public health technicians, and medical assistants (Muga et al. 2005, Riley et al. 2007). Enrolled nurses are trained to provide antenatal care and treatment for simple pregnancy-related health problems (e.g., anemia). Dispensary staff will occasionally conduct normal deliveries. 7
- 9. Health centers are one step above dispensaries and staffed by midwives, nurses, clinical officers, and occasionally doctors. They offer preventive and curative services “mostly adapted to local needs” (Muga et al. 2005). The scope of health centers is wider than that of dispensaries; in addition to providing services offered by the former, they offer reproductive health services and perform minor surgical services (e.g., drainage). Severe and complicated conditions are referred to a higher level of care provider. Sub-district hospitals and nursing homes, district hospitals, provincial hospitals, and national referral hospitals, respectively, offer increasingly specialized and high-level care. Sub- district and district hospitals are the lowest level of care with specialized Maternal Child Health (MCH) Clinics (Wanjira et al. 2011). The cost of care at government-run health facilities is likely to be less than that at private facilities (with the exception of nonprofit- and/or mission-driven providers that offer care for free). In 2004, the government removed high and variable user fees for its health facilities. It established a flat fee of Ksh10 (US$0.15) at dispensaries and Ksh20 (US$0.30) at health centers (CREHS 2009).1 The government more recently determined that pregnant women should not pay delivery fees at any government run health facilities (Wanjira et al. 2011). Private health providers Privately owned and operated hospitals and clinics, both for-profit and non-profit and including those run by faith-based organizations, provide between 30 and 40 percent of the hospital beds and over 40 percent of health services in Kenya (Muga et al. 2005). In one study, 1 These conversions were given in the CREHS (2009) policy brief. As of June 2012, Ksh10 is equivalent to approximately US$0.12, and Ksh20 to approximately US$0.24. 8
- 10. Noor et al. (2004) identified 6,674 services providers in Kenya, of which 3,355 (over 50 percent) were private sector, employer-provided, or specialist facilities. These numbers make private sector facilities a major supplement and complement to government providers. There are corresponding private providers at most of the levels offered by government providers. Of critical importance, however, private sector providers offer mainly curative health services and very few preventive ones (Muga et al. 2005). This has implications for achieving public health objectives, particularly among Kenya’s most disadvantaged maternal and child populations. Clinics and nursing homes, in contrast, are private sector institutions (Wamai 2009). One private sector service pertinent to maternal health is maternity homes. Although private, they nonetheless collaborate with Kenya’s Reproductive Health and Child Health Divisions of the Ministry of Health. This makes them more likely to offer reproductive and family planning services to clients. Private maternity homes fall under the governance of the Kenya Registered Midwives Association (Muga et al. 2005). Private-Public collaboration Collaboration between Kenya’s private and public health systems is varied. As mentioned above, Noor et al. (2004) calculated that 3,355 of Kenya’s 6,674 identified services providers were private sector, employer-provided, or specialist facilities. Only 39 percent of these private service providers were registered in the Kenyan Ministry of Health database (versus 84 percent of public health facilities supported by the Ministry of Health, missions, not-for-profit organizations and local authorities). 9
- 11. Health providers relevant to maternal and child health in Kenya In addition to the two sectors (public and private) of health care and tiers of facilities, there are also two overarching categories of medical caretakers relevant to maternal care: skilled birth attendants and unskilled birth attendants. Skilled birth attendants are defined by the World Health Organization (WHO) as persons “trained to proficiency in the skills needed to manage normal (uncomplicated) pregnancies, childbirth and the immediate postnatal period, and in the identification, management and referral of complications in women and newborns” (Harvey et al. 2007). In Kenya, skilled birth attendants’ definition is restricted to doctors, nurses and midwives (Wanjira et al. 2011). Skilled providers exist in larger numbers in urban areas than in rural, a trend likely related to the higher concentration of health facilities in urban areas than rural (Wanjira et al. 2011). Maternal mortality is identified as a “sensitive” marker of disadvantage because maternal mortality cannot be directly measured for population subgroups in most data-poor settings (Wirth et al. 2008). Consequently, the percentage of births attended by a skilled birth attendant (SBA) is an intermediate indicator of maternal mortality, reflecting “the distribution of human resources appropriately skilled in delivery care and accessible at a health facility or in the community” (Wirth et al. 2008). The Kenya Demographic Health Survey has found that the percentage of medically assisted deliveries has fallen consistently from 50 percent of births in 1993 to 44 percent of births in 2008 (Wirth et al. 2008; Wanjira et al. 2011). Traditional birth attendants are worth noting because they are used so widely in Kenya. At present, they are excluded from the title of “skilled birth attendant” because 80 percent of Kenyan traditional birth attendants lack formal training in pregnancy and delivery (Wanjira et al. 10
- 12. 2011). This exclusion followed a policy shift in the late 1990s.2 Both DHS and regional studies indicate that while many women receive antenatal care from a skilled provider at a health facility, a large proportion deliver at home, often with assistance from a traditional birth attendant. The 2008-09 DHS study found that while 92 percent of Kenyan women receive some antenatal care from a skilled provider (most often a nurse/midwife, and often late in their pregnancy), less than half this number (43 percent) give birth in a health facility, and 28 percent of all Kenyan births are assisted by a traditional birth attendant (Kenya National Bureau of Statistics and ICF Macro 2010). Smaller-scale studies, particularly in rural areas, show much higher rates of assistance from a traditional birth attendant, even among mothers who receive antenatal care from skilled providers (see Mwaniki et al. 2002, Cotter et al. 2006, Van Eijk et al. 2006). Sector quality It is worth noting that the aforementioned services offered by government health facilities and presence of skilled birth attendants reflect ideal circumstances. The actual qualifications and capabilities of skilled birth attendants have been called into question (Harvey et al. 2007). Wanjira et al. (2011) argue that only 15 percent of all Kenyan health workers providing maternal health services have received any type of in-service training in treating delivery-related complications. The studies’ authors tie these meager qualifications to the fact that Kenya’s government-run health facilities are underfinanced and lacking basic resources. 2 Although traditional birth attendants are currently excluded from categorization as “skilled birth attendants,” this has not always been the case. In the 1970s, the World Health Organization and other funding bodies supported training traditional birth attendants (Kruske et al. 2004). By 1997, Kruske et al. (2004) report, these entities shifted their focus on “skilled” attendants, which excluded traditional birth attendants and ended funding for traditional birth attendants’ training. 11
- 13. Other studies corroborate arguments about substandard care, particularly within the public sector. Ndavi et al. (2009) analyzed data from the District Health Management module of the 2004 Kenya Service Provision Assessment (KSPA) survey to identify the efficacy of DHMBs and DHMTs that are the result of health care decentralization. The authors found that DHMTs most often cited lack of funds and transports as the reason for their failure to meet supervision targets. Wamae et al. (2009) cite insufficiently equipped facilities, again in the public sector. Combining 2004 KSPA data with interviews, they concluded that the full range of essential equipment was lacking in almost all facilities. They also reported that of all facilities, hospitals were the most likely to be stocked with essential equipment, followed by dispensaries, maternity facilities (“maternities”), and clinics, respectively. This means that the most accessible facilities for pregnant mothers are the least equipped medically. Research also points to the fact that medical professionals are not doing all they can to educate patients in ways that would lead to the best health outcomes. Cotter et al. (2006) identified missed opportunities to counsel women on the value of delivering with a skilled attendant. They performed a case study of the use of a Kikoneni Health Centre (KCH), located in Kwale district in Coast province. Using retrospective data, Cotter et al. (2006) found that of 994 women who attended the antenatal care clinic, just 74 (7.4 percent) presented for delivery services. This study will be discussed further below. Wamae et al. (2009) also speak to medical providers’ missed “critical opportunities” to both conduct full assessments of sick children seeking care and to counsel caretakers on children’s illnesses. Their survey found that one in every five caretakers was counseled in public clinics, and one in every ten caretakers was counseled in public health centers. Medical 12
- 14. professionals in private facilities were twice as likely to counsel caretakers as professionals in their public counterparts. Literature review This literature review focuses on three key themes: first, the use of spatial data to address health care access and health outcomes; second, the use of spatial data to analyze maternal child health care and health outcomes in Kenya and East Africa specifically; and third, limitations of spatial data and non-geographic factors influencing access to and use of health services. Use of GIS to analyze health care access and health outcomes The evolution of GIS to evaluate health access “A fundamental premise of health geography is that illness and health are unequally distributed across space and time,” writes Graves (2008). The author continues, “Spatial patterns of illness have been associated with many factors, including climate, microbes, exposures, culture, race/ethnicity, geography, and distribution of healthcare services.” GIS can aid in identifying and analyzing all of these variables, as well as highlighting areas with the highest geographic barriers to access (Kruk and Freedman 2008). This makes it a promising mechanism for analyzing health and illness, particularly in combination with other, more conventional qualitative methods. Although much spatial analysis to data has focused on rural and disenfranchised populations in developed countries, the last decade has seen an expanding focused on developing nations (see, e.g., McCray 2000, Tanser and le Soeur 2002, Graves 2008, Gjesfjeld and Jung 2011, Chakrabarti 2009, Langford and Higgs 2006; Charreire and Combier 2009; McLafferty and Grady 2004). Early work in less developed countries focused largely on epidemiology and 13
- 15. the spread of disease, particularly diseases with an environmental component, rather than access to care (Tanser and le Soeur 2002). To a certain extent, this trend remains. Nonetheless, there is enough research on developing countries, including East Africa and specifically Kenya, to begin to make inroads in analyzing gaps in health care access and outcomes. Frank Tanser, an infectious disease epidemiologist and Associate Professor of Health and Population Studies at South Africa’s University of KwaZulu-Natal, and Abdisalan M. Noor, a graduate of the University of Oxford who is currently affiliated with KEMRI, are the most prolific writers to date on the use of spatial data in analyzing health access and health issues in sub-Saharan Africa (see Noor et al. 2003, Noor et al. 2004, Noor 2005, Noor et al. 2006, Noor et al. 2009, Tanser et al. 2001, Tanser 2006a, Tanser 2006b, Tanser and le Soeur 2002). Distance measures and “access” One critical caveat—and potential limitation—to the value of spatial analyses is that certain distance measures do not accurately reflect the time required for travel. Shahid et al. (2009) assessed the efficacy of various GIS methodologies to estimate distance between residence and the nearest hospital: Euclidian, Manhattan, and Minkowski distance.3 The study was motivated by the fact that actual road distances and travel time cannot be directly implemented in spatial analytical modeling. Their findings have bearing on how scholars should account for this distance-time measure, even though many do not do so. Shahid et al. (2009) found that the Minkowski coefficient best approximates road distance between a person’s home and hospital, whereas Euclidian distances underestimates road distance and travel time and Manhattan distance overestimates these measures. The Minkowski coefficient, the authors 3 The Euclidian distance metric uses a straight line to measure the distance between two points (“as the crow flies”) and yields the shortest distance. The Manhattan metric measures distance between points along a rectangular path with right angle turns, resembling grid-like city road systems. Minkowski distance assumes a curvilinear trajectory (Shahid et al. 2009). 14
- 16. conclude, increases the reliability of spatial analytical models and outweighs the cost of the computational procedure required for the Minkowski coefficient. Nonetheless, Shahid et al. (2009) warn, the appropriate coefficient for a given study must be calculated based on the regional geography and road network. Noor et al.’s (2006) research supports Shahid et al.’s (2009) study findings in the context of Kenya. Using high resolution spatial and epidemiological data, Noor et al. (2006) evaluate “access” to medical care in four Kenyan districts—Greater Kisii, Bondo, Kwale, and Makueni— for parents seeking care for malaria and/or fever for their children. Within the context of the four districts, Noor et al. (2006) found that the Euclidean distance model overestimates by 19 percent the population within one hour of a health facility. Extrapolating to the entire country, this would mean that 19 million people are within one hour of government health services, rather than the 25 million estimated by the commonly used Euclidian distance model. The authors had two additional important findings. First, as distance from health services increased, the difference in travel time assigned to the patients by the adjusted and Euclidian model increased, indicating that the disparities between persons in close proximity to a health facility and those further away from a facility are greater than expected. Second, Noor et al. (2006) found that patients did not always seek the closest facility and instead sought higher-order facilities over lower ones, a trend that might speak to the quality differences inherent in the “step” system; this finding has significant implications for time-sensitive obstetrical care. Shahid et al. (2009) and Noor et al.’s (2006) analyses highlight an important caveat to spatial analyses of health care “access.” National and international comparisons of health care access and equity commonly use the Euclidian distance model to evaluate the proportion of people who live within one hour of health care (Noor et al. 2006, citing Ministry of Health 1999, 15
- 17. World Bank 2001). “These measures,” Noor et al. (2006) explain, “assume that people always use the nearest health service, with little regard for patients’ actual use characteristics and almost exclusively use Euclidean or straight-line definitions of distance” (Noor et al. 2006, citing Gething et al. 2004, Guargliardo et al. 2004). As more detailed studies have discovered, these measures can significantly misinterpret actual access, thus demonstrating the need for spatial analyses to take into account factors such as movement barriers, topography, cost of travel, access to transportation, road or path patterns and composition, and socioeconomic and behavioral determinants of health service access and use (see, e.g., McLafferty 2003, Noor et al. 2006, Shahid et al. 2009). Use of Spatial Data to analyze maternal/child health care and health outcomes in Kenya/East Africa Child health services A number of studies have looked at the relationship between distance and health care obtainment, illness, and/or mortality among Kenyan children. Feikin et al. (2009) researched medical care for children in rural western Kenya. Noor et al. (2003) and Molyneux (1999) focused on treatment for childhood fever and/or malaria, the latter being the principal cause of childhood mortality in coastal Kenya and a major cause of death among children in many areas of the country (Molyneux 1999). Moïsi et al. (2010) investigate the effects of distance to health care facilities on child mortality. These studies are briefly discussed below. Feikin et al. (2009) analyzed the impact of distance on utilization of peripheral health facilities for sick children aged five and under in the rural village of Asembo, where walking is the most common means of transportation. The authors relied on demographic surveillance system (DSS) data collected from households and outpatient clinics, as well the GPS position of 16
- 18. each household, the latter being linkable to a child’s unique DSS identification number. 4 Controlling for the nearest DSS clinic, maternal education, clustering at the household level, and household socioeconomic status, the authors performed Poisson regression to model the number of clinic visits made as related to the distance a child lived from the nearest DSS clinic. The authors found that the rate of clinic visits decreased linearly at 0.5-kilometer intervals up to 4 kilometers, after which the rate of visits stabilized. For every one-kilometer increase in residence from a DSS clinic, Feikin et al. (2009) found, the rate of clinic visits decreased by 34 percent from the previous kilometer. The authors attribute this trend to the distance-decay effect (i.e., the interaction between two physical spaces declines as the distance between them increases). They also note, however, that infants and children with more severe illnesses traveled further for clinic visits, indicating that the distance-decay effect was less pronounced among infants and children in more dire condition. Noor et al. (2003) analyzed potential and actual use of government health facilities among pediatric patients seeking care for malaria and/or fever in four Kenyan districts with varied ecological, population, and health services conditions: Kwale, Makueni, Greater Kisii, and Bondo. (This research is also discussed in depth in the aforementioned Noor et al. [2006] article about the limitations of the Euclidian distance measure.) They used GIS and proximity-spider diagrams to analyze data obtained from provincial district-specific database lists as well as reports and maps from a large number of public, private, and religious-affiliated sources. (The highest spatial resolution data readily accessible in the public domain are provided at the sub- location level.) The authors found that more than 60 percent of patients utilized health facilities within 5 kilometers of their home. However, there was significant diversity among districts in 4 Not all children and adults have DSS identification numbers. The authors acknowledge that their exclusive reliance on DSS numbers biases the study. 17
- 19. terms of overall average travel distances; patients in Kwale and Makueni districts, where access to government health facilities was relatively poor, traveled greater mean distances than those in Greater Kisii and Bondo. The analysis also showed specific areas of poor access and large differences between rural and urban settings, with residents of the latter traveling longer distances to health facilities. The difference in access between urban and rural communities was larger in relatively large, low-population density districts than in relatively small, high-density ones. Notably, Noor et al. (2003) found that distance was not the exclusive factor shaping choice of health facility. The authors found that between 65 and 74 percent of respondents used a more distant health center or hospital for care. Noor et al. (2006) report that not only do patients often choose a health facility other than the one nearest to their home for treating children with fever/malaria, but also that Euclidian distance between home and health facility often underestimates time required to travel between home and health facility.5 Molyneux (1999) studies urban and rural residents in coastal Kenya to explore the choices that mothers make to treat their child’s “uncomplicated” fever. The urban subpopulation is located within a close three kilometers of the Mombasa District Hospital and five private clinics, and even the rural study area subsection is transected by a large paved road. Consequently, although the central point of the rural subsection is approximately 10 kilometers from the district hospital, over 66 percent of rural residents are within two kilometers of a bus 5 The percentage of people who use a facility other than the one nearest their home per Noor et al. (2003) and Noor et al. (2006) is markedly lower than what Tanser et al. (2001) found to be the case among residents of Hlabisa district, South Africa, seeking primary care. Hlabisa district has a central community hospital, 11 satellite fixed clinics, and several mobile clinics that provide primary care. Tanser et al. (2001) found that 87 percent of homesteads use the nearest clinic and travel an average Euclidian distance of 4.72 kilometers to attend a clinic. There are multiple possible explanations for this difference, beginning with the fact that the studies occurred in different countries with different health care systems. 18
- 20. stop. Despite relative easy geographic, if not economic, access to medical facilities for both populations, they were not mothers’ first choice for care. Government or private clinics were contacted in 49 percent of cases. Sixty-nine percent of rural and urban respondents turned first or exclusively to over-the-counter antimalarial/antipyretic medicines without contacting a physician. Government or private clinics were contacted in 49 percent of cases. The only significant difference between rural and urban mothers was the use of private/government clinics: rural mothers were more likely to seek government services, and urban mothers to consult private practitioners. Moïsi et al. (2010) investigated the effects of distance to health care facilities on child mortality in Kilifi District, Kenya. The authors used data collected on over 220,000 people through the District’s Epidemiological and Demographic Surveillance System (Epi-DSS). The authors also used GIS to estimate walking and vehicular travel times to hospitals, vaccine clinics, and 100 other public, private, or NGO-operated health facilities, and they developed models to evaluate the effects of travel time on the likelihood of mortality for children under five years of age (accounting for such variables as sex, maternal education, and rainfall). Euclidian distance measures showed no clear trends of increasing or decreasing mortality with increased pedestrian or vehicular travel time to a hospital or clinic so long as the child lived within two hours’ driving time of the facility. The authors additionally noted that while significant spatial variations in mortality were observed across the area, they were not correlated with distance to health facilities. As such, the authors concluded, “our data did not lend support to the widely held notion that mortality increases with distance to hospitals and vaccine clinics,” and “given the present density of health facilities in Kenya, geographic access to curative services does not influence population-level mortality.” 19
- 21. The authors suggests that the Kilifi DSS study is representative of Kenya as a whole vis- à-vis health care access insofar as approximately two-thirds of the country’s population lives within a one-hour walk of a primary health facility. Notably, although this finding is consistent with another DSS study from the Gambia, it contrasts with multiple analyses conducted in other countries that show a strong relationship between mortality and distance to health facilities. Obstetric and maternal health services Noor et al. (2004) and Noor et al. (2009) use GIS mapping software to analyze Kenyans’ proximity to health providers. These studies provide the most comprehensive look at overall geographic access to health facilities, and are closely tied to Noor’s (2005) doctoral dissertation on the development of spatial models of Kenyan health service access and use to define health equity. The analyses by Noor et al. (2004) and Noor et al. (2009) give no attention to facilities specializing in care for mothers and/or children. However, assuming that all public health facilities are equipped to provide routine antenatal, obstetric, and pediatric care, these overall analyses should reflect the access that mothers and children have to basic health care. Noor et al. (2004) built a health services providers database from multiple government and nongovernmental sources and positioned these facilities spatially. Of 6,674 service providers identified, 3,319 were public (supported by Kenya’s Ministry of Health, missions, nonprofit organizations, and local authorities). The remaining 3,355 were private-sector, employer- provided, or specialist facilities serving higher-income persons. The authors were able to spatially place 92 percent of the 3,319 public service facilities. Eighty-two percent of the Kenyan population is within 5 kilometers of a public health facility, 12 percent are between 5 and 10 20
- 22. kilometers, and 6 percent are more than 10 kilometers away.6 Noor et al. (2004) also note that although 82 percent of people live within 5 kilometers of a facility, they occupy only 20 percent of the country—a statistic that speaks to the relative concentration of much of Kenya’s population and the dispersal and relative isolation of the country’s rural residents. Noor et al. (2009) updated the analysis from five years prior, compiling a list of 5,334 public health facilities, an increase of 1,862 facilities over 2003.7 Sixty-seven percent of health facilities were operated by the Ministry of Health, followed by 28 percent mission and NGOs, 2 percent local authorities, and 3 percent employers and other ministries. The authors spatially referenced 93 percent of these facilities. Using 2008 health facility and population data, Noor et al. (2009) found that 89 percent of the population was within 5 kilometers Euclidian distance of a public health facility, and that 80 percent of the population outside 5 kilometers of public health service providers was in the sparsely settled pastoralist areas. Using this data, Noor et al. (2009) concluded that new health facilities are unlikely to yield significant improvements in geographic access to health facilities in Central, Nairobi, Nyanza, and Western provinces. Additional facilities in Coast, Eastern, and Rift Valley provinces could increase access in remote locations. Finally, Noor et al. (2009) cite that North Eastern province is significantly behind others in terms of resident proximity to a health facility. While Noor et al. (2004) and Noor et al. (2009) looked at proximity to health facilities nationwide, Cotter et al. (2006) targeted Kikoneni Health Centre (KHC) in Coast province. Their 6 Noor et al. (2009) report that in 2003, 72 percent of Kenya’s population lived within 5 kilometers Euclidian distance of a public health facility, indicating that the analysis published in Noor et al. (2004) used a different distance measurement. 7 For the updated list, Noor et al. (2009) appear to supplement the 2004 study with additional health facilities obtained through antimalarial and antiretroviral services. This indicates that the five-year increase is not due to an actual increase in facility numbers, but rather more extensive identification methods. 21
- 23. study sought to estimate maternal use of skilled attendants for delivery at KHC, as well as availability of skilled attendants for the general Kikoneni population. Data was retrospectively reviewed, and spatial analysis was not performed. The findings nonetheless have bearing on analyses of access to maternal healthcare. Of 994 women who attended KHC’s antenatal care clinic, a paltry 74 (7.4 percent) presented for delivery services. A comparison of deliveries at health facilities with expected births in the population found that 5.4 percent of expected births in the population occurred at health facilities (Cotter et al. 2006). Not only are both percentages well below the proportion of mothers who give birth in a health facility across the province (per Kenya DHS data), but they also indicate that receipt of skilled prenatal care does not translate into use of a skilled practitioner when giving birth. The relatively limited reliance on skilled care for delivering is corroborated by studies elsewhere in Kenya. Mwaniki et al. (2002) studied mothers in Mbeere District, Eastern Province, and found that 97.5 percent of mothers received antenatal care at a health facility, but only 52 percent gave birth at one. Van Eijk et al. (2006) studied mothers in rural western Kenya. They found that 90 percent of the 635 women interviewed visited an antenatal clinic at least once during their last pregnancy (albeit often only in the third trimester), but a much lower 17 percent delivered at a health facility. Reasons for this drop-off vary, and relate in varying degrees to distance factors. However, consistent across studies is the fact that proximity to a clinic is not the sole predictor of its use for giving birth. Cotter et al. (2006) reported four reasons why the use of an SBA was so low, one of which was the combination of logistic and geographic barriers: the distance is too significant, and transportation is often unavailable or unaffordable. The other three relate to knowledge and perceptions and are discussed below. Mwaniki et al. (2002) found that utilization 22
- 24. of health facilities for maternity care was heavily correlated with distance; mothers living under 5 kilometers from the facility better utilized its services. However, the authors also found a strong correlation between number of children and facility use (mothers with more children used its less); mothers additionally cited dissatisfaction with facilities’ services, cleanliness, and staff as reasons for not using them. Meanwhile, Van Eijk et al. (2006) reported that although lack of transport, especially at night, was the most common reason why mothers did not deliver at a health facility (49 percent of respondents), fast progression of labor (47 percent) and expense (28 percent) also factored in heavily. In combination these studies indicate that distance from a health facility can be a major factor in whether or not its skilled caretakers are used for delivery, but there are several other variables that influence mothers’ actions. It is worth noting that the trend of greater use of skilled care and facilities for antenatal care than actual birth is by no means limited to Kenya. Looking at studies from other African countries may help put Kenya in context and illuminate factors affecting maternal care and health outcomes. Van den Broek et al. (2003) conducted a study of reproductive health in rural Malawi. With nearly 60,000 persons surveyed, it was considered the largest community-based reproductive study in Africa at that time. The population survey was also deemed to be typical of many other sub-Saharan countries in terms of population composition, dependency ratio, occupation, and educational attainment. Almost all pregnant women (94.9 percent) received clinical prenatal care despite living an average of 5 kilometers form the health center. The mean number of visits was 5.2. Distance only came into play with whether a mother made six or more antenatal clinic visits. 23
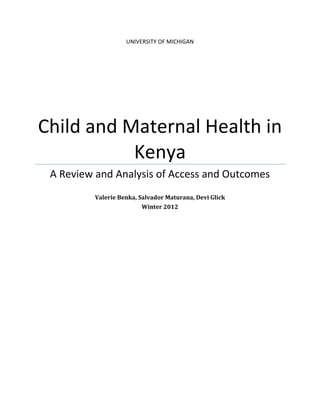
- 25. Distance from a clinic played a more significant role when it came to delivery. Van den Broek et al. (2003) found that the use of a trained health care worker decreased as distance from a health center increased, and that proximity of any household to a health center (regardless of other household/maternal variables such as education and income) has an effect on use of a clinic for delivery. It also impacted delivery outcomes. For households situated within one kilometer of the health center, 79.1 percent of pregnancies resulted in a currently living child; for households situated seven kilometers or more from the health center, 73.3 percent of households resulted in a currently living child. The authors also found a statistically significant correlation between maternal education and use of a skilled birth attendant, with more educated mothers more likely to receive professional care.8 Walker and Vajjhala (2009) address the links between spatial exclusion, transport access, and Millennium Development Goals for women living in Lesotho, Ethiopia, and Ghana. The study seeks to illustrate the implications of these links for understanding the underlying dynamics of spatial exclusion. In addition to quantifying nationwide distances to health care using DHS clusters, they also survey women on the major factors that hinder access to health services.9 In contrast to Van den Broek et al.’s (2003) study of Malawi, which points to distance as the key factor in use of a medical facility for giving birth, Walker and Vajjhala’s (2009) work indicates that reducing distance is not the “magic bullet” to increasing medical access and health outcomes. The findings suggest that while distance and transport impediments are substantial, addressing these in isolation will not necessarily yield hoped-for increases in health care 8 The authors do not speculate on why education correlates with use of a professional clinic, and what interplay there might be between variables—e.g., whether more educated mothers are more knowledgeable about the benefits of giving birth in a medical facility, more able to afford the cost of skilled obstetrical care, or simply living closer to medical facilities. 9 Notably, this study focused on all women’s health services, not just antenatal or obstetrical care. It is possible that reasons for not accessing health services differ when it comes to delivering. 24
- 26. important community-level contributions to improving rural access, particularly for women. 5.2 Barriers to Access Evaluating the types of spatial relationships and constraints addressed in the previous sections is even outcomes. As when 1 shows, distance and transport were significant factors in obtainment andmore important Table considering investments to reduce barriers to transport and health servicenot a woman received professionalquestionscare. three DHS questionaires for whether or delivery. Based on a full set of DHS health on all However, getting money (Ghana, Ethiopia, and Lesotho), Table 3 and the maps in this section illustrate the extent to which transport barriers, on average across the clusters,reason that womenmajority of women as treatment, not geographic factors, was all major are identified by a did not access health aservices. big problem relative to other barriers to health service access. Because each of these barriers was evaluated separately by survey participants and not ranked in order of difficulty or priority, the data1: Percentages of women by cluster of barriers to one another. Instead, “big problem” Table do not allow for a direct comparison who identified each barrier as a we highlight each barrier separately in the maps of Lesotho that follow to show the spatial variation. for accessing health services (Source: Walker and Vajjhala 2009). Table 3. Summary Table of Country Averages: Percentage of Women b y Cluster Who Identified Each Barrier as a “Big Problem” for Accessing Health Serv ices Barrier to health service Ghana Lesotho Ethiopia 2000 Ethiopia 2005 Knowing where to go 11% 3% NA NA Getting permission to go 9% 2% NA 30% Getting money for treatment 57% 40% NA 73% Distance to health facility 37% 29% NA 63% Having to take transport 37% 31% NA 65% Not wanting to go alone 21% 12% NA 55% No female service provider 16% 7% NA 66% Limitations of spatial data/non-geographic factors influencing health care access 19 and use One overarching issue with both spatial and non-spatial analyses of health care access and outcomes is how we define “access.” Rutherford et al. (2010) assert that the “concept of access is not well understood” and cite several definitions from existing work that speak to a variety of interpretations of the term. The authors build on the claim by Andersen (1995) that access could be assessed by both health service use and outcomes, which speaks to the necessity of incorporating use into the access concept. In considering maternal and child health access and outcomes in Kenya and the broader region, this definition seems apt, particularly given differences in quality among facilities, research findings that a large percentage of Kenyans do 25
- 27. not use the facility closest to their home, and, looking more broadly, the non-spatial barriers to health care acquisition cited by Walker and Vajjhala’s (2009) study subjects. Although distance factors into the access to and use of health services in Kenya, even authors who focus on physical access acknowledge that overall “access” is influenced by other factors as well (see, e.g., Noor et al. 2003). Behavior, culture, education, income, and service cost all become considerations in evaluating overall use of health facilities and resultant health outcomes. Demographic components of SBA use in Kenya Studies have found that use of skilled birth attendants is highly stratified by poverty and other social determinants of health. Wealth, education, and ethnicity have been found to have the greatest impact on use of a skilled birth attendant, in that order (Wirth et al. 2008). Region has a much lower correlation. Wirth et al. (2008) found that the use of an SBA correlates most significantly with wealth, education, and ethnicity. The stepwise gradient for use of an SBA is greater by wealth quintile than by region. Education and ethnicity were also found to have significant correlations with SBA use. Seventy-two percent of mothers with a secondary education use an SBA, compared with 36 percent of mothers with a primary school education, and 27 percent of mothers with no education. Kikuyu, Kenya’s majority ethnic group, were found to use SBAs most frequently, with 71 percent of mothers delivering with their help, as compared to 27 percent of Mijikenda/Swahili (Wirth et al. 2008). Knowledge of and attitudes toward various birth attendant “groups” also had strong influences on the persons mothers chose to assist with childbirth. Based on findings from a hospital-based cross-sectional survey among women who had recently given birth, albeit not necessarily in a medical facility, Wanjira et al. (2011) suggest that some mothers view birth 26
- 28. attendants at home (unskilled) as similar to birth attendants in health facilities (skilled) in the way they attend to deliveries. Women and communities that view traditional birth attendants as equally skilled as professionals with medical training choose traditional attendants over skilled (Wanjira et al. 2011). Wanjira et al. (2011) interpret this statistic and suggest that the perceptions of mothers on birth attendants could be greatly influenced by the interpersonal relations with the attendants during labor and delivery. Cotter et al.’s (2006) case study of women in Coast province corroborates this finding. Respondents noted that many mothers believe that because the previous generation delivered at home, the current generation will do so as well. Healthcare providers may not be actively working to sensitize women to the importance of delivering with skilled assistance; small minorities of pregnant patients reported being counseled on planning for the location of delivery or being told of the benefits of delivering in a health facility (Cotter et al. 2006). The tendency for Kenyan health providers to neglect key opportunities to counsel patients is also addressed by Wamae et al. (2009) in the context of care for infants and children. Conclusions Existing studies provide insight into the factors that do and do not influence “access” to medical care for mothers and children. Distance most certainly plays a role in use of health facilities and obtainment of skilled medical care, though how big a role varies according to the particular study, the distances in question, the facilities available, and the urgency of the medical situation. Studies suggest that adding health care facilities will yield a greater benefit in some areas over others. As discussed above, Noor et al. (2009) conclude that adding new facilities in remote locations in Coast, Eastern, Rift Valley, and North Eastern would increase access more so than adding new facilities in Central, Nairobi, Nyanza, and Western provinces. On the whole, it is 27
- 29. likely that rural residents of any province will have to travel further for medical care than their more urban counterparts. However, given the extreme isolation of much of Kenya and dispersal of the population in these isolated areas, the cost-benefit ratio of adding new facilities in rural communities is an issue. In all cases, when evaluating persons’ distance from health facilities, it is important to pay attention to the distance measure being used; the commonly used Euclidian distance measure has major shortcomings. It is also critical to pay attention to other variables shown to factor into “access.” Studies show that people often do not use the closet medical facility, likely because of perceived or actual quality issues, and instead go to higher-level care providers. Studies also show a significant drop between women’s use of skilled providers for antenatal care and for delivery. This can be attributed in part to distance and the time-sensitivity inherent to giving birth, but also to women’s education and perceptions about giving birth in a health facility rather than with the assistance of a traditional birth attendant. Studies point to the need to educate women about the benefits of giving birth with the help of a skilled provider and make the experience a more positive one. It is worth noting that use of mobile clinics were omitted from the literature review, yet they are present in the country and an important source of health care to both urban and rural populations. They are worth considering as a way to address distance factors for rural populations, although they are not a viable option when it comes to providing time-sensitive health care. Their value is mainly in providing regularly spaced preventive and curative care. Overview of data collected and available for analysis 28
- 30. Beyond a literature review, we performed statistical analysis of existing data and mapped them using ArcGIS. This section describes four key health-related Kenyan data sets (the Census, Demographic and Health Survey, National Health Facility Inventory, and Service Provision Assessment Sample) and explains why we selected some data sets and omitted others from analysis. The section then turns to a discussion of the administrative districts available for analysis. Data sets Census The Kenyan Census is conducted by the Kenya National Bureau of Statistics. The most recent national census was conducted in 2009. Each census contains a complete count of the country’s population and provides information on its size, distribution, composition, and other social and economic characteristics. This data can be aggregated to various geographic levels and used to connect demographic factors with health indicators and facility access. The Kenya National Bureau of Statistics appears to have the 2009 census data available upon special request; however, we were not able to gain access to it. We therefore used a subset of the 1999 census available from the World Resources Institute (WRI), which had already been geo-located, and population density information from Afripop.org. This data-set contains population density information, poverty rates, and other indicators. More recent census data is available with the data broken down by various administrative districts; however geo-located data in the form of geographic coordinates was not available for the majority of the datasets. The Demographic and Health Survey (DHS) The Kenya DHS began in 1984. Its design was based on World Fertility Surveys and Contraceptive Prevalence Surveys, with the addition of an expanded set of indicators in the areas of population, health, and nutrition. Demographic and Health Surveys are designed to collect 29
- 31. data on marriage, fertility, family planning, reproductive health, child health, and HIV/AIDS. Due to the subject matter, women of reproductive age (15–49) are the focus of the survey. Women eligible for an individual interview are identified through the households selected in the sample. Consequently, all DHS surveys utilize a minimum of two questionnaires—a Household Questionnaire and a Women’s Questionnaire (KNBS and ICF Macro). Measure DHS is funded by United States Agency for International Development (USAID) and executed by ICF International. Rural areas were oversampled in this survey to compensate for likely oversampling in urban areas. Responses were collected based on clusters of households (neighborhoods) and aggregated into a single point for each cluster. The clusters are representative at the provincial and national level; therefore the data is representative at the provincial and national level. The cluster data is available as a point shape file, and we were able to access and use the 2008 version of this dataset. As indicated above, the sampling technique used to collect the DHS data is representative at the national and provincial level, but not at any scale below that. We had intended to do local- level analysis, but to reiterate, the sampling technique used to select the clusters of households that were sampled was only intended to be representative at the provincial and national level. This means that any analysis that is done below the provincial level will not be statistically accurate because the data was not collected to be representative at that level. This gap in data at the local level presents a significant limitation on the level of analysis that anyone is able to perform. All previous analysis of the DHS data that we found had been limited to the provincial and national level as well. 30
- 32. National Health Facility Inventory The National Health Facility Inventory is an inventory of all health facilities in Kenya. The inventory was collected and published most recently in February, 2010 by the Ministry of Medical Services and the Ministry of Public Health and Sanitation. Facilities are characterized by level, type, and ownership (public, faith-based, private, and NGO) to give an overall picture of the health infrastructure available throughout the country. Unlike the Service Provision Sample discussed below, this dataset is intended to be an inventory of all health facilities in the country, not a sample. The dataset has 8044 data points and is available at http://www.ehealth.or.ke/facilities/. The data should be representative at any level of spatial analysis. The data manual clearly outlines that geo-location data is available; however, the publicly available version of the dataset does not contain geographic information. Attempts to contact the Ministry of Health and procure access to the full dataset with the geo-located information were unsuccessful. In place of this dataset, we found a different National Health Facility Inventory from Kenya Open Data (https://opendata.go.ke/Health-Sector/Health-Facilities/89zb-g69r), which did have geolocation information. There are 6070 data points in this data file, although only 4865 data points have geographic information. It is not clear how carefully this data-set was prepared to avoid duplicate entries or omit facilities. The source of the data was listed as the Kenya National Bureau of Statistics. This dataset is broken down slightly differently than the official National Health Facility Inventory. The facilities are broken down into nine categories: 1. Hospitals MOH and Mission; Districts, sub-districts (smaller – less specialized) 2. Referral Hospitals and Provincial Hospitals (larger – less specialized) 3. Health Centres (NGO – basic) 4. Dispensaries (only basic maternal services) 31
- 33. 5. Private Hospitals 6. Private Clinics and Medical Centres (specialist) 7. Nursing Homes and Maternity Hospitals 8. Special Treatment Hospitals 9. Institutions Health Facilities - schools, Universities, Employer, Police, Prisons, Other Ministries, Airport & Port Authorities, Armed forces Service Provision Assessment (SPA) Sample The Service Provision Assessment Sample is a sample of health facilities in the country. The survey was designed to gather information on the provision of reproductive and child health services in Kenya. The assessment was undertaken to provide a comprehensive picture of the functioning and quality of health services in four areas: maternal health, child health, family planning, and sexually transmitted infections and HIV/AIDS. The KSPA’s aim was to assess the strengths and weaknesses of the delivery of these health services and to provide recommendations on how to improve the provision of services in the future (NCAPD, 2011). The SPA contains more detailed information on the provisions at each facility than the National Health Facility Inventory does. Just like with the DHS, this data is representative at the regional and national level. The SPA was conducted by the Ministry of Health and the National Council for Population and Development and we were able to access and use the most recent version of the dataset from 2010. There are 695 data points in the SPA dataset. Administrative districts Kenya is broken down into five sub-national administrative levels: province, division, district, location, and sub-location. There is near-universal agreement of how to define and geographically delineate the provinces (there are eight: Central, Coast, Eastern, Nairobi, North- Eastern, Nyanza, Rift Valley, and Western), but below that there is significant variability in how 32
- 34. divisions, districts, locations, and sub-locations are defined and how they are geographically delineated. This made it challenging to conduct analysis or merge data sets (where there were not geographic coordinates) based any of the sub-province levels. The administrative layers that we choose to use were obtained from MapLibrary.org, an open data site with geolocated spatial layers. Survey Design General Approach The DHS and SPA surveys provide a large quantity of data that we hoped to use for small scale spatial and statistical analysis of maternal health indicators in Kenya. Our goal was to map the relationship between health indicators and facilities, population, and various other factors at the most refined scale possible. The DHS data was collected in clusters, stratified units selected to sample individuals across the entire country. The clusters themselves were composed of households from a neighborhood or small village. The SPA data was collected on the individual facility level. Our preliminary plan was to extrapolate up from the cluster level and facility level to one of the refined geographic units, but we still did not know at what levels the data was representative. Evaluating the statistical feasibility of such data analysis strategy required careful review of Kenya DHS and Kenya SPA sample designs. We knew that our ability to extrapolate zone- bounded survey information would be methodologically determined by survey’s data representativeness and thus sample design. 33
- 35. Kenya DHS Survey Sample Design The 2008-09 KDHS survey was designed to cover the entire country, including the arid and semi-arid districts. The survey collected information on demographic and health issues from a sample of women at the reproductive age of 15-49 and from a sample of men age 15-54 years in a one-in-two subsample of households (Kenya National Bureau of Statistics and ICF Macro, 2010). To be representative, the sample was drawn from 10,000 households. Most importantly, it was constructed to allow for separate estimates for key indicators for each of the eight provinces in Kenya, as well as for urban and rural areas separately. The Kenya DHS used master sampling frames developed on the platform of a two-stage sample design. The first stage involved selecting data collection points (‘clusters’) from the national master sample frame. A total of 400 clusters, 133 urban and 267 rural, were selected. The second stage involved the systematic sampling of households from an updated list of households in the selected cluster. Then, all women age 15-49 years who were either usual residents or visitors present in sampled households on the night before the survey were eligible to be interviewed in the survey. In addition, in every second household selected for the survey, all men age 15-54 years were also eligible to be interviewed (Kenya National Bureau of Statistics and ICF Macro, 2010). Finally, a total of 9,936 households were selected in the sample, of which 9,268 were occupied during fieldwork and thus eligible for interviews, among which 9,057 were successfully interviewed, yielding a response rate of 98 percent. From interviewed households, 8,767 women were eligible and 8,444 were interviewed, yielding a 96 percent response rate. Interviews with men covered 3,465 of the eligible 3,910 men, yielding 89 percent response rate (Kenya National Bureau of Statistics and ICF Macro, 2010). 34
- 36. Kenya SPA Survey Sample Design The 2010 Kenya SPA is a facility-based survey designed to provide information on the preparedness of health facilities. It provides national and provincial-level representative information for hospitals, health centers, maternity and nursing homes, clinics, and stand-alone voluntary counseling and testing (VCT) facilities (National Coordinating Agency for Population and Development (NCAPD) [Kenya], Ministry of, 2011). The sample of facilities included was randomly selected from a Master Facility List (MFL) of 6,192 functioning health facilities in Kenya at the time of the survey. A sample of 703 facilities was designed to allow for key indicators to be presented at national and provincial levels, by type of facility, and by the different managing authorities. Interviewers were not able to survey eight of the sampled facilities for various reasons, including inaccessibility due to poor roads. Consequently, data were successfully collected from 695 facilities. (National Coordinating Agency for Population and Development (NCAPD) [Kenya], Ministry of, 2011). Data assessment As described previously, both for KDHS and KSPA, households and respondents were selected in order to produce representative population estimates at the national and regional level only. The survey design for DHS is not conducive for smaller area estimation, as was the primary data mapping strategy. Indeed, any sub-regional estimates are highly unreliable and likely to result in large standard errors and so it is not methodologically feasible to do spatial analysis at the individual cluster level. Moreover, the GPS data for the cluster can be used to extract additional information based on location but are not representative of the population living at that exact place (Measure DHS, 2011). 35
- 37. Giving the statistical constraint, we decided not to use cluster to map the data at any level below provinces. We instead mapped the data at the level for which it was representative: the Provincial level. Statistical Analysis Although we were not able to perform the extensive statistical analysis at the fine scale that we had hopped, we did run a few regressions on the Provincial level with the DHS data. Although the results were not all that surprising, they are worth mentioning. The main things we saw were that: 1) The denser the area the more facilities there are (.51) 2) Denser (population) areas tend to have more private facilities than public (.02 / -.01), though both relationships are pretty weak. 3) Denser (facilities) areas tend to have more private facilities than public (.16 / -.08), though both relationships are weak. 4.) From the coefficient between both dummies (.21) we observe coexistence which means that the facilities are serving as compliments, not substitutes. See Appendix A for the stata output and the original analysis. Spatial analysis of data Based on the data constraints discussed in the previous section, we were only able to perform spatial analysis of the SPA and DHS at the Provincial and National level. The attached maps contain population and facility level analysis at the location level, as well as DHS and SPA analysis at the Provincial level. 36
- 38. See Appendix B for maps. Summary and conclusion This research and analysis yielded two overarching conclusions. The first is the need to reevaluate data collection if it is to be accurate below provincial and national levels. Our recommendation is to focus future data collection efforts on being representative at the district level. While this would require a significant increase in the quantity of sampling needed but it is possible to focus on only one or a few provinces as a starting point. The second is the need to consider variables beyond distance when evaluating access to and use of medical care. Although distance from a health facility is shown to factor into use of that facility to some degree, it is unlikely that merely adding health facilities to the Kenyan landscape will drastically increase maternal and child use of facilities and enhance health outcomes. Variables such as facility quality, cost of services, and knowledge about and attitudes toward skilled health care can play strikingly significant roles in whether a facility gets used. 37
- 39. Works Cited Andersen, R. (1995). Revisiting the behavioral model and access to medical care: does it matter? Journal of Health and Social Behavior, 36, 1–10. Black, R.E., Morris, S.S., & Bryce, J. (2003). Where and why are 10 million children dying every year? Lancet, 361, 2226–34. Chakrabarti, R. (2009). Constrained Spaces of Prenatal Care: South Asian Immigrant Women in New York City. Doctoral dissertation, University of Illinois at Urbana-Champaign. http://www.ideals.illinois.edu/handle/2142/14713. Charreire, H., & Combier, E. (2009). Poor prenatal care in an urban area: A geographic analysis. Health & Place, 15, 412–19. Cotter, K., Hawken, M., & Temmerman, M. (2006). Low Use of Skilled Attendants’ Delivery Services in Rural Kenya. Journal of Health, Population, and Nutrition, 24(4), 467–71. Consortium for Research on Equitable Health Systems (CREHS). (2009). Financing Kenyan Health Centres and Dispensaries: Exploring the implementation and effects of Direct Facility Funding, May, 1–2. London, U.K. http://www.crehs.lshtm.ac.uk/downloads/publications/DFF_policy_brief.pdf. Daniels N., Bryant, J., Castano, R., et al. (2000). Benchmarks of fairness for health care reform: a policy tool for developing countries. Bulletin of the World Health Organization, 78, 740–50. Feikin, D.R., Nguyen, L.M., Adazu, K., et al. (2009). The impact of distance of residence from a peripheral health facility on pediatric health utilisation in rural western Kenya. Tropical Medicine and International Health, 14(1), 54–61. 38
- 40. Gething, P.W., Noor, A.M., Zurovac, D., et al. (2004). Empirical modeling of Government health service use by children with fevers in Kenya. Acta Tropica, 91, 227–37. Gjesfjeld, C.D., & Jung, J. (2011). How Far?: Using Geographical Information Systems (GIS) to Examine Maternity Care Access for Expectant Mothers in a Rural State. Social Work in Health Care, 50: 682–93. Graves, B.A. (2008). Integrative Literature Review: A Review of Literature Related to Geographical Information Systems, Healthcare Access, and Health Outcomes. Perspectives in Health Information Management, 5, 11. Guargliardo, M.F., Ronzio, C.R., Cheung, I., et al. (2004). Physician accessibility: an urban case study of pediatric providers. Health and Place, 10, 273–83. Haines, A., Sanders, D., Lehmann, U., et al. (2007). Achieving child survival goals: potential contribution of community health workers. Lancet, 369, 2121–31. Harvey, S.A., Blandón, Y.C.W., McCaw-Binns, A., et al. (2007). Are skilled birth attendants really skilled? A measurement method, some disturbing results and a potential way forward. Bulletin of the World Health Organization, 85(10), 783–90. Kenya Ministry of Health 1997 (cited in Moisi et al. 2010) Kenya National Bureau of Statistics (KNBS) and ICF Macro. (2010). 2008–09 Kenya Demographic and Health Survey: Key Findings. Calverton, Maryland: KNBS and ICF Macro. http://www.scribd.com/doc/48314515/Key-Findings-Kenya-2008-09-DHS. Kenya National Bureau of Statistics and ICF Macro. (2010). Kenya Demographic and Health Survey 2008-09. Calverton, Maryland: KNBS and ICF Macro. Kenya National Bureau of Statistics. http://www.knbs.or.ke/ Kenya Population and Housing Consensus. Accessed from: the Kenya National Bureau of Statistics. http://www.knbs.or.ke/surveys.php 39
- 41. Kruk, M.A., & Freedman, L.P. (2008). Assessing health system performance in developing countries: A review of the literature. Health Policy, 85, 263–76. Kruske, S., & Barclay, L. (2004). Effect of Shifting Policies on Traditional Birth Attendant Training. Journal of Midwifery & Women’s Health, 49(4), 306–11. Langford, M., & Higgs, G. (2006). Measuring Potential Access to Primary Healthcare Services: The Influence of Alternative Spatial Representations of Population. The Professional Geographer, 58, 294–306. Macinko, J., & Starfield, B. (2002). Annotated bibliography on equity in health. International Journal of Equity in Health, 1(1), 1–20. McCray, T. (2000). Delivering Healthy Babies: Transportation and Healthcare Access. Planning Practice & Research, 15, 17–29. McLafferty, S.L. (2003). GIS and Health Care. Annual Review of Public Health, 24, 25–42. McLafferty, S.L, & Grady, S. (2004). Prenatal Care Need and Access: A GIS Analysis. Journal of Medical Systems, 28(3), 321–33. Measure DHS. (2011, May 15). Frequently Asked Questions (GPS Data). Retrieved May 15, 2012, from Measure DHS: http://www.measuredhs.com/faq.cfmMinistry of Health. (1997). Health Policy Framework. Nairobi, Kenya: Ministry of Health, Government of Kenya. Ministry of Health. (1999). National Health Sector Strategy Plan. Nairobi, Kenya: Ministry of Health, Government of Kenya. Moïsi, J., Gatakaa, H., Noor. A., et al. (2010). Geographic access to care is not a determinant of child mortality in a rural Kenyan setting with high health facility density. BMC Public Health, 10, 142. 40
- 42. Molyneux, C.S., Mung’ala-Odera, V., Harpham, T., et al. (1999). Maternal responses to childhood fevers: a comparison of rural and urban residents in coastal Kenya. Tropical Medicine and International Health, 4(12), 836–45. Muga, R., Kizito, P., Mbayah, M., et al. (2005). Overview of the Health System in Kenya. Demographic and Health Surveys. www.measuredhs.com/pubs/pdf/SPA8/02Chapter2.pdf. Mukuria, A., Aboulafia, C., & Themme, A. (2005). The Context of Women’s Health: Results from the Demographic and Health Surveys, 1994-2001. Calverton, Maryland: ORC Macro. Mwaniki, P.K., Kabiru, E.W., & Mbugua, G.G. (2002). Utilisation of antenatal and maternity services by mothers seeking child welfare services in Mbeere District, Eastern Province, Kenya. East African Medical Journal, 79(4), 184–7. National Coordinating Agency for Population and Development (NCAPD) [Kenya], Ministry of Medical Services (MOMS) [Kenya], Ministry of Public Health and Sanitation (MOPHS) [Kenya], Kenya National Bureau of Statistics (KNBS) [Kenya], ICF Macro. 2011. Kenya Service Provision Assessment Survey 2010. Nairobi, Kenya: National Coordinating Agency for Population and Development, Ministry of Medical Services, Ministry of Public Health and Sanitation, Kenya National Bureau of Statistics, and ICF Macro. National Health Facility Inventory - http://www.ehealth.or.ke/facilities/ National Health Facility Inventory from Kenya Open Data (https://opendata.go.ke/Health- Sector/Health-Facilities/89zb-g69r) Ndavi, P.M., Ogola, S., Kizito, P.M., et al. (2009). Decentralizing Kenya’s Health Management System: An Evaluation. Kenya Working Papers. 37 pages. 41
- 43. www.measuredhs.com/pubs/pdf/WPK1/WPK1.pdf. Noor, A.M., Zurovac, D., Hay, S.I., et al. (2003). Defining equity in physical access to clinical services using geographical information systems as part of malaria planning and monitoring in Kenya. Tropical Medicine & International Health, 8(10), 917–26. Noor, A.M., Gikandi, P.W., Hay, S.I., et al. (2004). Creating spatially defined databases for equitable health service planning in low-income countries: the example of Kenya. Acta Tropica, 91, 239–51. Noor, A.M. (2005). Developing spatial models of health service access and utilisation to define health equity in Kenya. Doctoral thesis. Oxford, England: Oxford University. Noor, A.M., Amin, A.A., Gething, P.W., et al. (2006). Modelling distances travelled to government health services in Kenya. Tropical Medicine & International Health, 11(2), 188–96. Noor, A.M., Alegana, V.A., Gething, P.W., et al. (2009). A spatial national health facility database for public health sector planning in Kenya in 2008. International Journal of Health Geographics, 8(13), 7 pages. O’Donnell, O., van Doorslaer, E., Wagstaff, A, et al. (2008). Analyzing Health Equity Using Household Survey Data: A Guide to Techniques and Their Implementation. Washington, DC: The World Bank. http://www.stata.com/bookstore/analyzing-health-equity- household-survey/. Riley, P.L., Vindigni, S.M., Arud, J., et al. (2007). Developing a Nursing Database System in Kenya. Health Services Research Journal, 42(3), 1389–1405. Rutherford, M.E., Mulholland, K., & Hill, P.C. (2010). How access to health care relates to under-five mortality in sub-Saharan Africa: systematic review. Tropical Medicine & 42
- 44. International Health, 15(5), 508–19. Shahid, R., Bertazzon, S., Knudtson, M.L., et al. (2009). Comparison of distance measures in spatial analytical modeling for health service planning. BMC Health Services Research, 9(200). Tanser, F., Hosegood, V., Benzler, J., et al. (2001). New approaches to spatially analyse primary health care usage patterns in rural South Africa. Tropical Medicine and International Health, 6(10), 826–38. Tanser, F. (2006a). Geographical Information Systems (GIS) Innovations for Primary Health Care in Developing Countries. Innovations, Spring, 106–22. Tanser, F. (2006b). Methodology for optimising location of new primary health care facilities in rural communities: a case study in KwaZulu-Natal, South Africa. Journal of Epidemiology & Community Health, 60, 846–50. Tanser, F.C., & le Soeur, D. (2002). The application of geographical information systems to important public health problems in Africa. International Journal of Health Geographics, 1(4). United Nations. (2012). Infant mortality rate (0-1 year) per 1,000 live births. Millennium Development Goals Indicators. http://unstats.un.org/unsd/mdg/SeriesDetail.aspx?srid=562. Van den Broek, N.R., White, S.A., Ntonya, C., et al. (2003). Reproductive health in rural Malawi: a population-based survey. BJOG: an International Journal of Obstetrics and Gynaecology, 110, 902–08. 43
- 45. Van Eijk, A.M., Bles, H.M., Odhiambo, F., et al. (2006). Use of antenatal services and delivery care among women in rural western Kenya: a community based survey. Reproductive Health, 3.2. Walker, W.W., & Vajjhala, S. (2009). Gender and GIS: Mapping the Links between Spatial Exclusion, Transport Access, and the Millennium Development Goals in Lesotho, Ethiopia, and Ghana. The Journal of Community Informatics, 5(3-4). Wamae, A., Kichamu, G., Kundu, F., et al. (2009). Child Health Services in Kenya. Kenya Working Papers No. 2. Calverton, Maryland: Macro International Inc. Wamai, R.G. (2009). The Kenya Health System—Analysis of the situation and enduring challenges. The Japan Medical Association Journal, 52(2), 134–40. Wanjira, C., Mwangi, M., Mathenge, E., et al. (2011). Delivery Practices and Associated Factors among Mothers Seeking Child Welfare Services in Selected Health Facilities in Nyandarua South District, Kenya. BMC Public Health, 11:360. Wirth, M., Sacks, E., Delamonica, E., et al. (2008). “Delivering” on the MDGS? Equity and Maternal health in Ghana, Ethiopia, and Kenya. East African Journal of Public Health, 5.3, 133–41. World Bank. (2001). African Development Indicators. Washington DC: World Bank. World Resources Institute (WRI) . Download Kenya GIS Data. http://www.wri.org/publication/content/9291 44
- 46. Appendix A . cd "M:KENYA" . insheet using "density_population_facility_este si.csv" . corr private_count public_count population_density facility_density privat~t public~t popula~y facili~y private_co~t 1.0000 public_count 0.2885 1.0000 population~y -0.0055 -0.0005 1.0000 facility_d~y 0.2308 0.1826 0.5144 1.0000 Where private_co~t = counts of private facility in the district public_count = counts of public facility in the district population~y = population density in the district facility_d~y = facility density in the district Here the same correlation matrix but using dummies for private/public (private_dum, public_dum). This is more useful to look for the relationships: . gen private_dum=0 . replace private_dum=1 if private_count=~0 . gen public_dum=0 . replace public_dum=1 if public_count~=0 . corr private_dum public_dum privat~m public~m popula~y facili~y private_dum 1.0000 public_dum 0.2181 1.0000 population~y 0.0267 -0.0193 1.0000 facility_d~y 0.1639 0.0849 0.5144 1.0000 Indeed, 1. The denser the area the more facilities there are (.51) 2. Denser (population) areas tend to have more private facilities than public (.02 / -.01), though both relationships are pretty weak. 3. Denser (facilities) areas tend to have more private facilities than public (.16 / -.08), though both relationships are weak. 4. From the coefficient between both dummies (.21) we observe complementarity/coexistence
- 47. Liz comments on the correlations: The strong positive correlation between population density and facilities density is not too surprising good to demonstrate. On the types of facilities, I think the counts actually provide more interesting information - they give a sense of the number of each type in a district, rather than simply their presence. The rather strong positive correlation suggests that higher number of private are co-located with higher numbers of public. Therefore, they are not serving as substitutes but rather as complements.
- 48. Appendix B: Maps Sources - Administrative Districts Shapefile: Map Library http://www.maplibrary.org/stacks/Africa/Kenya/index.php - Population Density Raster File: Afri Pop http://www.clas.ufl.edu/users/atatem/index_files/Kenya.htm - Health Facilities Data: Kenya Open Data https://opendata.go.ke/Health-Sector/Health-Facilities/89zb-g69r - Maternal Health and Child Health Data: Measure DHS. Kenya Demographic and Health Survey (DHS) 2008-09. http://measuredhs.com/pubs/pdf/FR229/FR229.pdf - Maternal Health Facilities and Child Health Facilities Data: Measure DHS. Kenya Service Provision Assessment (SPA) 2010. http://measuredhs.com/pubs/pdf/SPA17/SPA17.pdf 1
- 49. List of Maps Population Density - Map 5.2: Postnatal Care - Map 1: Population Density in Kenya - Map 5.3: Basic Antenatal Care Supplies - Map 5.4: Sexually Transmitted Infection Treatment Health Facilities by Sub-location - Map 5.5: Pregnancy Complications - Map 2.1: Health Facilities in Kenya - Map 5.6: Normal Delivery - Map 2.2: Health Facilities in Kenya: Density - Map 5.7: Caesarean Section - Map 5.8: Home Delivery Services Health Facilities - Map 5.9: Essential Delivery Services - Map 3.1: All Health Facilities - Map 5.10: Serious Delivery Complications - Map 3.2: Government Dispensaries in Kenya - Map 3.3: Government Facilities in Kenya Child Health - Map 3.4: Government Health Centers in Kenya - Map 6.1: Vaccination - Map 3.5: Public and Private Facilities in Kenya - Map 6.2: No Vaccinations - Map 6.3: Fever Treatment Maternal Health - Map 6.4: Diarrhea - Map 4.1: Antenatal Care - Map 6.5: Diarrhea Treatment - Map 4.2: Tetanus Protection - Map 6.6: Diarrhea Treatment 2 - Map 4.3: Delivery in a Health Facility - Map 4.4: Delivery in Health Facility 2 Child Health Facilities - Map 4.5: Delivery by a Skilled Provider - Map 7.1: Outpatient Care - Map 4.6: Postnatal Check-up - Map 7.2: Childhood Immunizations - Map 7.3: First-line Services Maternal Health Facilities - Map 5.1: Antenatal Care 2
- 50. Map 1 This map shows the average population density (people per square km) for each sub-location. 3
- 51. Map 2.1 This map shows how many health facilities fall within the geographic bounds of each sub- location. 4
- 52. Map 2.2 This map displays the density of health facilities per 5 square km in each sub-location. Border facilities, that is facilities near the border of another sub- location, and which could therefore be within 5 km of someone within that sub- location are not accounted for. 5
- 53. Map 3.1 All health facilities include both government and private facilities which can be broken down into dispensaries, hospitals, health centers, clinics, nursing homes and maternity hospitals, and other specialty or institutional facilities. 6
- 54. Map 3.2 Only dispensaries run by the government are included here 7
- 55. Map 3.3 Central Government Facilities are run by the Ministry of Health (majority), Other Ministries, and the Armed Forces. Local Authority facilities are run by local governments 8
- 56. Map 3.4 Only Health Centers run by the government are included here 9
- 57. Map 3.5 Government facilities are comprised of all facilities run by the central and local governments. Private facilities are comprised of facilities run by private entities, missions and NGO’s 10
- 58. Map 3.6 Government facilities are comprised of all facilities run by the central and local governments. Private facilities are comprised of facilities run by private entities, missions and NGO’s 11
- 59. DHS and SPA maps The next series of maps display data from the DHS and SPA survey’s. The data is visually displayed so that the most concerning or worst trends are highlighted with the darkest colors and the least concerning or most favorable trends are the highlighted with the lightest colors. This is important to note because for some pieces of data a high percentage indicates a positive trend, and for other pieces of data a high percentage indicates a negative trend. 12