2. 180 Z.X. Li et al. / Precambrian Research 160 (2008) 179–210
1. Introduction complication of true polar wander (TPW), apply to late Pre-
cambrian (e.g., Stern, 2005), and that the geomagnetic field was
Valentine and Moores (1970) were probably the first to recog- dominantly a geocentric axial dipole field at that time (Evans,
nise that a supercontinent, comprising just about all continents 2006). We emphasise the importance of considering multiple
on Earth, existed towards the end of the Precambrian. They sug- lines of evidence in testing any reconstruction, because only
gested that the break-up of the supercontinent, which they called through such an approach can the potentially large number of
Pangaea I, by the Cambrian led to a divergence of environments solutions be reduced to the most likely scenarios (Fig. 1a). We
and characteristics amongst the daughter continents, and a sud- strive to be as objective as possible when discussing alternative
den prominence of shallow, nutrient-rich shelves and coastal interpretations, at the same time trying to make a self-consistent
areas, all factors conducive to the diversification of life forms on synthesis. We emphasise that not every opinion expressed in
Earth. This late-Precambrian supercontinent was later renamed this paper is agreed on by all co-authors.
Rodinia (McMenamin and McMenamin, 1990) from the Russian
word ‘rodit’ meaning ‘to beget’ or ‘to give birth’. McMenamin 2. Major inter-continental connections proposed for
and McMenamin (1990) considered Rodinia to have been the Rodinia using multidisciplinary evidence
supercontinent that spawned all subsequent continents, while
“the edges (continental shelves) of Rodinia were the cradle of the Because Laurentia is flanked by Neoproterozoic passive mar-
earliest animals” (McMenamin and McMenamin, 1990, p. 95). gins, it is commonly regarded as being at the centre of Rodinia
The concept of the supercontinent Rodinia attracted much assembly and break-up (e.g., Hoffman, 1991). We will evalu-
attention in 1991, when three researchers (Moores, 1991; ate the various continental connections around the margin of
Dalziel, 1991; Hoffman, 1991) published geological evidence Laurentia proposed for Rodinia time.
for the assembly and break-up of Rodinia, with some of its
daughter continents forming Gondwanaland. Common to their 2.1. Continents facing the present western and northern
propositions is the connection between western Laurentia, Aus- margins of Laurentia: Australia–East Antarctica, South
tralia and East Antarctica (commonly known as the southwest China, or Siberia?
U.S.–East Antarctic, or SWEAT, connection; Moores, 1991),
which follows an earlier suggestion by Bell and Jefferson (1987) 2.1.1. The SWEAT hypothesis
based on stratigraphic correlations and palaeomagnetic con- The question of which continent(s) used to lie adjacent to
straints across the Pacific, and by Eisbacher (1985) based on the present western margin of Laurentia during the existence
stratigraphic correlation alone. of Rodinia has been central to the Rodinia debate, and the topic
An explosion of new data and ideas occurred in the follow- remains controversial today. Among the competing models,
ing years, and, in order to better coordinate the global efforts in the earliest and perhaps the best-known model is the SWEAT
testing the Rodinia hypothesis, a UNESCO-IGCP project (No. hypothesis (Fig. 2a). The model builds on the similar Neopro-
440, 1999–2004) was established to investigate the formation, terozoic stratigraphy of the western margin of Laurentia and
configuration, and break-up of Rodinia, and to construct an inter- eastern Australia as recognised earlier by Eisbacher (1985) and
pretative Geodynamic Map of the Rodinia supercontinent (the Bell and Jefferson (1987), and elaborated later by Young (1992)
Rodinia Map hereafter; Appendix I, see hard copy in the print and Rainbird et al. (1996) among others. Three landmark papers
version of this volume; also available online). Although few still in 1991 (Moores, 1991; Dalziel, 1991; Hoffman, 1991) also
doubt the existence of a late Precambrian supercontinent, there used basement outcrops as piercing points that may correlate
is still no consensus regarding the number of participating cra- from one continent to the other, such as the correlation of
tons, their relative configuration within the supercontinent and Grenville-age (ca. 1300–1000 Ma) orogenic belts, to argue that
the chronology and mode of assembly and break-up of the super- the SWEAT connection probably existed as early as 1900 Ma
continent. In this paper we provide an overview of evidence for ago and lasted until mid to late Neoproterozoic times. Moores
and against major Rodinian reconstructions, including those in (1991) implied that the united northern and western Australian
the Rodinia Map (Appendix I). We discuss some current ideas craton might not have become part of the SWEAT connection
regarding the formation of Rodinia and processes that led to its until its collision with the Gawler craton along the late Meso-
break-up, and present an animation for the evolution of Rodinia proterozoic Albany-Fraser-Musgrave belt. Powell et al. (1993)
from 1100 Ma till the formation of Gondwanaland at 530 Ma confirmed that a SWEAT connection was palaeomagnetically
(Appendix II, available online). permissible for the time interval of ca. 1050–720 Ma based on
The challenges to reconstructing the history of Rodinia the contemporary palaeomagnetic database, but would have to
include inadequate high-quality geological, geochronological have broken apart by 580 Ma (or >650 Ma as pointed out earlier
and palaeomagnetic data, multiple possible interpretations for by Van der Voo et al., 1984, on palaeomagnetic grounds).
each data set, and uncertainties in fundamental assumptions Closer scrutiny of the crustal provinces and basin provenance
such as the application of modern-style plate tectonics to analysis, however, have shown that geological discontinuities
late-Precambrian time and that the geomagnetic field was a exist across the SWEAT connection. In particular, isotopic and
geocentric axial dipole field (an assumption that underlines geochemical mapping along the Transantarctic Mountains has
interpretations of palaeomagnetic data). In this paper we revealed that Mesoproterozoic basement provinces as young as
assume that modern-style plate tectonics, with the possible ca. 1000 Ma along the continental margin truncate the Lau-
3. Z.X. Li et al. / Precambrian Research 160 (2008) 179–210 181
Fig. 1. (a) A schematic diagram illustrating the importance of taking a multidisciplinary and global approach in reconstructing palaeogeography in relation to the
evolution of a Precambrian supercontinent (when biogeography is of limited value). The line from each research aspect symbolises an infinite number of possible
solutions, with concentration of their intersections giving the most likely solution. (b) Present locations and major crustal elements of the Precambrian continental
blocks.
rentian crustal provinces (Borg and DePaolo, 1994). To make of the SWEAT connection (ca. 750 Ma, see later discussions)
the SWEAT connection viable, these authors suggested that and the development of the Beardmore Group passive-margin
those basement blocks were probably exotic in origin and were deposits no later than 668 ± 1 Ma (Goodge et al., 2002).
accreted to the East Antarctic margin after the opening of the There are other lines of evidence that do not support the
proto-Pacific Ocean. Although this may be so for some of the SWEAT connection. (1) There is a lack of continuation of the ca.
terranes along the Cambrian Ross–Delamerian Orogen (Stump, 1400 Ma (1500–1350 Ma) transcontinental magmatic province
1995), there is no geological evidence for the docking of ter- of southern Laurentia (e.g., Nyman et al., 1994; Van Schmus et
ranes like the Beardmore terrane, which would have to have al., 1996) into the Transantarctic Mountains, although one could
occurred in a very narrow time window between the break-up argue that they could be beneath the ice farther inland (Goodge
4. 182 Z.X. Li et al. / Precambrian Research 160 (2008) 179–210
et al., 2002). (2) There are mismatches in the Neoproterozoic (the Deer Trail Group) require a western clastic source with
mantle plume record across the SWEAT connection (Park et rocks of 1786–1642 Ma, 1600–1590 Ma and 1244–1070 Ma,
al., 1995; Wingate et al., 1998; Li et al., 1999; see more dis- much of which cannot easily be identified in East Antarc-
cussion in Section 2.1.2). (3) The Belt Basin of western North tica in the SWEAT configuration (Ross et al., 1992; Ross and
America and the possibly overlying Buffalo Hump Formation Villeneuve, 2003). (4) The originally proposed continuation of
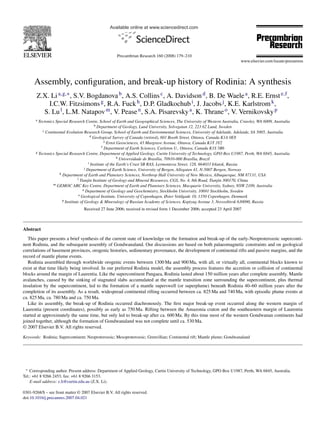
Fig. 2. Palaeomagnetic examinations of alternative configurations of continents west and north of Laurentia. Palaeopoles used are listed in Table 1, and Euler rotation
parameters given in Appendix III (available online). (a) In the SWEAT fit (after Moores, 1991; Dalziel, 1991; Hoffman, 1991) palaeopoles from Laurentia (grey
diamonds) and Australia (purple diamonds) do not merge until ca. 1050 Ma. (b) In the “Missing-Link” configuration (after Li et al., 1995) ca. 820–800 Ma poles
from India, Australia and South China fall close to each other but the ca. 750 Ma poles are scattered. No dated ca. 820–800 Ma pole is available from Laurentia
for a comparison. (c) In the AUSWUS configuration (Karlstrom et al., 1999; Burrett and Berry, 2000) ca. 1200 Ma poles from Laurentia and Australia fall >30◦
apart, whereas some of their 1100–1050 Ma poles follow the same apparent polar wander path (APWP). (d) In the AUSMEX configuration (Wingate et al., 2002)
five of the seven ca. 1200–1050 Ma poles from Australia fall away from coeval Laurentian poles. (e) Siberia placed against Laurentia following Sears and Price
(1978, 2000), in which the Siberian poles fall away from the Laurentia poles. (f) Siberia–Laurentia configuration following Pisarevsky et al. (2008), in which ca.
1050–970 Ma Siberian poles follow the same APWP as the Laurentian poles. In this figure and Figs. 5–7, all continents were rotated to Laurentia which is at its
900 Ma palaeolatitude. Latitude and longitude lines are shown in 30◦ intervals. Geotectonic polygon data are shown following the legend for the Rodinia Map (as in
Figs. 1b and 8 and Appendix I).
5. Z.X. Li et al. / Precambrian Research 160 (2008) 179–210 183
Fig. 2. (Continued ).
the Grenville belt into the Coats Land and Dronning Maud A number of studies reporting Grenvillian orogenic events
Land of East Antarctica (Moores, 1991; Dalziel, 1991) was along the western margin of Laurentia have yet to attract much
later proved untenable both palaeomagnetically (e.g., Gose et attention. Perhaps most significant are the 1090–1030 Ma meta-
al., 1997) and geologically (e.g., Jacobs et al., 2003a,b). Coats morphic ages (titanite U–Pb) from 1468 ± 2 Ma mafic sills
Land was more likely part of Laurentia at 1110 Ma (e.g., Gose et in the Belt-Purcell Supergroup (#3 in Fig. 2a; Anderson and
al., 1997), but became connected with Kalahari when Kalahari Davis, 1995). In the Mackenzie Mountains (#4 in Fig. 2a),
collided with Laurentia at 1090–1060 Ma, and remained con- there is evidence for an east-west compressional event (the Corn
nected until the break-up of Gondwanaland (e.g., Jacobs et al., Creek Orogeny) that occurred after 1033 Ma but before 750 Ma
2003a,b, 2008). (Thorkelson, 2000; Thorkelson et al., 2005). There is also a less-
There is also a growing body of evidence suggesting the well defined 1175–1100 Ma recrystallisation age from a granite
possible presence of Grenvillian orogenic belts along both the clast brought up from the basement in a diatreme (Jefferson and
western margin of Laurentia and eastern Australia. On the Parrish, 1989).
Australia–East Antarctica side, apart from the possible pres- If there were indeed Grenvillian orogenic belts between Lau-
ence of late Mesoproterozoic basement provinces along the rentia and Australia–East Antarctica, it would suggest that even
Transantarctic Mountains (Borg and DePaolo, 1994), Berry et if a SWEAT connection existed, it would have to have been
al. (2005) recently reported a 1287 ± 18 Ma metamorphic age Grenvillian or later.
(monazite U–Th–Pb) from King Island northwest of Tasmania Palaeomagnetic data permit a SWEAT connection after ca.
(#1 in Fig. 2a), and Fioretti et al. (2005) published a 1119 ± 9 Ma 1050 Ma (Powell et al., 1993), but such a connection is not
age for quartz syenite at the South Tasman Rise. Like the base- possible at ca. 1200 Ma (Fig. 2a; Pisarevsky et al., 2003a)
ment for the Transantarctic Mountains, an allochthonous origin although the reliability of the ca. 1200 Ma pole for Australia
for northwestern Tasmania and King Island is possible, but the needs further verification. This scenario is consistent with pre-
following observations argue against such a possibility: (a) the Grenvillian geological mismatches discussed above. However,
palaeomagnetic record shows that northwestern Tasmania was we do not preclude the possible existence of a SWEAT-like link
already part of cratonic Australia by the Late Cambrian (Li et al., between Australia and Laurentia during late-Paleoproterozoic
1997), and there is no prior compressional event recognised in (ca. 1800–1600 Ma), as suggested by Idnurm and Giddings
the region that reflects terrane amalgamation between the time (1995) and Betts and Giles (2006).
of Rodinia break-up (ca. 750 Ma, see Section 3.2) and the Late
Cambrian; (b) the Neoproterozoic tectonostratigraphy of north- 2.1.2. The “Missing-Link” model
western Tasmania and King Island can be well correlated with The “Missing-Link” model proposed by Li et al. (1995) has
that of the Adelaide Fold Belt (Calver and Walter, 2000; Holm et the South China Block sitting between Australia–East Antarc-
al., 2003; Li, 2001; Z.X. Li et al., 2003b). A possible Grenvillian tica and Laurentia in Rodinia, serving as the “missing-link”
province has also been identified in northern Queensland (#2 in between the two continents (Fig. 2b). The model was initially
Fig. 2a; Blewett et al., 1998; Hutton et al., 1996), largely based developed in view of: (a) mismatches in the crustal provinces
on detrital zircon ages. of Australia–East Antarctica and Laurentia (see discussions in
6. 184 Z.X. Li et al. / Precambrian Research 160 (2008) 179–210
Table 1
Selected palaeomagnetic poles used for reconstructing the late-Mesoproterozoic to Neoproterozoic global palaeogeography
Rock unit Age (Ma) Pole A95 (◦ ) Reference
(◦ N) (◦ E)
Laurentia
Long Range dykesa 620–610 19 355 18 Murthy et al. (1992); Kamo and Gower (1994)
Franklin dykes 723 + 4/−2 5 163 5 Heaman et al. (1992); Park (1994)
Natkusiak Formation 723 + 4/−2 6 159 6 Palmer et al. (1983); Heaman et al. (1992)
Kwagunt Formation 742 ± 6 18 166 7 Weil et al. (2004)
Tsezotene sills and dykes 779 ± 2 2 138 5 Park et al. (1989); LeCheminant and Heaman
(1994)
Wyoming dykes 782 ± 8; 785 ± 8 13 131 4 Harlan et al. (1997)
Galeros Formation 780–820 −2 163 6 Weil et al. (2004)
Haliburton intrusions A 980 ± 10; 1000–1030 −36 143 10 Buchan and Dunlop (1976); Warnock et al.
(2000)
Chequamegon sandstone ∼1020b −12 178 5 McCabe and Van der Voo (1983)
Jacobsville sandstone J (A+B) ∼1020b −9 183 4 Roy and Robertson (1978)
Freda sandstone 1050 ± 30 2 179 4 Henry et al. (1977); Wingate et al. (2002)
Nonesuch shale 1050 ± 30 8 178 4 Henry et al. (1977); Wingate et al. (2002)
Lake Shore Traps 1087 ± 2 22 181 5 Diehl and Haig (1994); Davis and Paces (1990)
Portage Lake volcanics 1095 ± 2 27 181 2 Halls and Pesonen (1982); Davis and Paces
(1990)
Upper North Shore volcanics 1097 ± 2 32 184 5 Halls and Pesonen (1982); Davis and Green
(1997)
Logan sills R 1109 + 4/−2 49 220 4 Halls and Pesonen (1982); Davis and Sutcliffe
(1985)
Abitibi dykes 1141 ± 2 43 209 14 Ernst and Buchan (1993)
Wind River, Gr. B 1300–1500 22 209 9 Harlan et al. (2003a,b)
Mackenzie dolerite dykes 1267 ± 2 4.0 190.0 5.0 Buchan and Halls (1990)
Nain anorthosite 1320–1290 12.0 210.0 3.0 From Buchan et al. (2000)
Mistastin complex ∼1420 −1.0 201.0 8.0 From Buchan et al. (2000)
Laramie complex and Sherman granite ∼1434 −7.0 215.0 4.0 From Buchan et al. (2000)
Harp Lake complex ∼1450 2.0 206.0 4.0 From Buchan et al. (2000)
Michikamau anorthosite pluton ∼1460 −2.0 218.0 5.0 From Buchan et al. (2000)
Molson dykes, component A ∼1820–1720 15.4 263.5 4.0 From Buchan et al. (2000)
Baltica
Hunnedalen dykes >848 −41 222 10 Walderhaug et al. (1999)
Egersund-Ogna anorthosite ∼900 −42 200 9 Brown and McEnroe (2004)
Egersund anorthosite 929–932 −44 214 4 Stearn and Piper (1984); Torsvik and Eide
(1998)
Hakefjorden 916 ± 11 5 249 4 Stearn and Piper (1984); Scherst´ n et al. (2000)
e
G¨ teborg-Slussen
o 935 ± 3 −7 242 12 Pisarevsky and Bylund (2006)
Dalarna dykes 946 ± 1 5 239 15 Bylund and Elming (1992), S¨ derlund et al.
o
(2005)
Karlshamn-F¨ j¨ dykes
ao 946–954 2 242 30 Patchett and Bylund (1977), S¨ derlund et al.
o
(2004)
Nilstorp dyke 966 ± 2 9 239 8 Patchett and Bylund (1977), S¨ derlund et al.
o
(2004)
Py¨ tteryd amphibolite
a 933–945 −43 214 11 Pisarevsky and Bylund (1998); Wang et al.
(1996); Wang and Lindh (1996)
K¨ nna gneiss
a 948–974 −50 225 17 Pisarevsky and Bylund (1998); Wang et al.
(1996); Wang and Lindh (1996)
G¨ llared amphibolite
a 956? −46 214 19 Pisarevsky and Bylund (1998); M¨ ller and
o
S¨ derlund (1997)
o
G¨ llared granite-gneiss
a 980–990 −44 224 6 Pisarevsky and Bylund (1998); M¨ ller and
o
S¨ derlund (1997)
o
Bamble intrusions 1100–1040 3 217 15 Torsvik and Eide (1998); Brown and McEnroe
(2004)
Laanila dolerite 1045 ± 50 −2 212 15 Mertanen et al. (1996)
Mean Jotnian dolerite intrusions ∼1265 4.0 158.0 4.0 From Buchan et al. (2000)
˚
Aland quartz porphyry dykes 1571 ± 20; 1571 ± 9 12.0 182.0 7.0 From Buchan et al. (2000)
˚
Aland dolerite dykes 1577 ± 12 28.0 188.0 9.0 From Buchan et al. (2000)
Subjotnian quartz porphyry dykes ∼1630 29.0 177.0 6.0 From Buchan et al. (2000)
Shoksha Formation, Vepsian Group ∼1780 39.7 221.1 4.0 From Buchan et al. (2000)
7. Z.X. Li et al. / Precambrian Research 160 (2008) 179–210 185
Table 1 (Continued )
Rock unit Age (Ma) Pole A95 (◦ ) Reference
(◦ N) (◦ E)
India
Mahe dykes, Seychellesc 748–755 80 79 11 Torsvik et al. (2001b)
Malani Igneous Suite 751–771 68 88 8 Torsvik et al. (2001a)
Harohalli dykes 814 ± 34 27 79 18 Radhakrishna and Mathew (1996)
Wajrakarur kimberlites 1079? 45 59 11 Miller and Hargraves (1994)
Australia
Elatina Formation 600–620 51 157 2 Embleton and Williams (1986)
Elatina Formation 600–620 54 147 1 Schmidt et al. (1991)
Elatina Formation 600–620 52 167 11 Schmidt and Williams (1995)
Elatina Formation 600–620 39 186 9 Sohl et al. (1999)
Yaltipena Formation 620–630 44 173 8 Sohl et al. (1999)
Mundine Well dykes 755 ± 3 45 135 4 Wingate and Giddings (2000)
Walsh Tillite 750–770 22 102 14 Li (2000)
Hussar Formation 800–760 62 86 10 Pisarevsky et al. (2007)
Browne Formation 830–800 45 142 7 Pisarevsky et al. (2007)
Wooltana Formation ∼820 62 322 17 McWilliams and McElhinny (1980)
Kulgera dykes 1054 ± 13 −8 75 6 Schmidt et al. (2005)
Bangemall Basin sills 1070 ± 6 34 95 8 Wingate et al. (2002)
Stuart dykes 1076 ± 33 10 262 10 Idnurm and Giddings (1988)
Lakeview dolerite 1116 ± 12 10 311 17 Tanaka and Idnurm (1994)
Bremer Bay & Whalebone Pt ∼1200 74 304 13 Pisarevsky et al. (2003a)
Mt. Barren Group 1205 ± 40 47 347 13 Pisarevsky et al. (2003a), Dawson et al. (2003)
Fraser dyke 1212 ± 10 56 3260 5 Pisarevsky et al. (2003a)
Congo
Mbozi Complex, Tanzania 755 ± 25 46 325 9 Meert et al. (1995); Evans (2000)
Gagwe lavas, Tanzania 795 ± 7 25 93 10 Meert et al. (1995); Deblond et al. (2001)
S˜ o Francisco
a
Ilheus dykes 1011 ± 24 30 100 4 D’Agrella-Filho et al. (1990); Renne et al.
(1990)
Olivenca dykes, normal
¸ ∼1035b 16 107 8 D’Agrella-Filho et al. (1990); Renne et al.
(1990)
Itaju de Colonia ∼1055b 8 111 10 D’Agrella-Filho et al. (1990); Renne et al.
(1990)
Olivenca dykes (rever.) 1078 ± 18 −10 100 9 D’Agrella-Filho et al. (1990); Renne et al.
(1990)
Kalaharid
Ritscherflya Supergroup (rotated to 1130 ± 12 61 29 4 Powell et al. (2001)
Kalahari)
Umkondo Igneous Province 1105 ± 5 66 37 3 Powell et al. (2001); Wingate (2001)
Kalkpunt Formation, ∼1065? 57 3 7 Briden et al. (1979); Powell et al. (2001)
Central Namaqua ∼1030–1000 8 330 10 Onstott et al. (1986); Robb et al. (1999)
Siberia
Ust-Kirba sediments and sills ∼980 −8 183 10 Pavlov et al. (2002)
Kandyk Formation ∼1000 −3 177 4 Pavlov et al. (2002); Rainbird et al. (1998)
Ignikan Formation ∼1010 −16 201 4 Pavlov et al. (2000)
Nelkan Formation ∼1020 −14 219 6 Pavlov et al. (2000)
Milkon Formation ∼1025 −6 196 4 Pavlov et al. (2000)
Kumahinsk Formation ∼1030 −14 201 7 Pavlov et al. (2000)
Malgina Formation 1043 ± 14 −22 226 7 Osipova in Smethurst et al. (1998);
Ovchinnikova et al. (2001)
Malgina Formation 1043 ± 14 −25 231 3 Gallet et al. (2000); Ovchinnikova et al. (2001)
Chieress dyke 1384 ± 2 4 258 6.6 Ernst et al. (2000)
Kuonamka dykes 1503 ± 5 6 234 22 Ernst et al. (2000)
North China
Dongjia Formation, Lushan ∼650 −60.8 97.4 6.7 From Zhang et al. (2006)
Mean poles ∼700 −42.9 107.0 5.7 From Zhang et al. (2006)
Nanfen Formation 800–780 −16.5 121.1 11.1 From Zhang et al. (2006)
Cuizhuang/Sanjiaotang Formations 950 −41.0 44.8 11.3 From Zhang et al. (2006)
Tieling Formation 1100 2.2 163.6 25.3 From Zhang et al. (2006)
Baicaoping Formation 1200 −43.0 143.8 11.1 Zhang et al. (2006)
8. 186 Z.X. Li et al. / Precambrian Research 160 (2008) 179–210
Table 1 (Continued )
Rock unit Age (Ma) Pole A95 (◦ ) Reference
(◦ N) (◦ E)
Yunmengshan Formation 1260 −60.6 87.0 3.7 Zhang et al. (2006)
Yangzhuang/Wumishan Formations 1300 −17.2 45.0 5.5 From Zhang et al. (2006)
Yangzhuang Formation ∼1350 −17.3 3.5 5.7 Wu et al. (2005)
Taihang dyke swarm 1769.1 ± 2.5 −36.0 67.0 2.8 Halls et al. (2000)
Tarim
Aksu dykes 807 ± 12 19 128 6 Chen et al. (2004)
Baiyixi Formation ∼740 17 194 4 Huang et al. (2005)
South China
Doushantuo carbonates 584 ± 26 6 197 6 Macouin et al. (2004)
Liantuo Formation 748 ± 12 4 161 13 Evans et al. (2000)
Xiaofeng dykes 802 ± 10 14 91 11 Li et al. (2004)
Amazonia
Nova Floresta ∼1200 25 165 6 Tohver et al. (2002)
Oaxaquia
Oaxaca anorthosite ∼950 47 267 23 Ballard et al. (1989)
Abbreviations: SA, South Australia; NT, Northern Territory; WA, Western Australia.
a Recalculated by Hodych et al. (2004).
b Age based on APWP interpolation.
c Rotated to India 28◦ counterclockwise around the pole of 25.8◦ N, 330◦ E (Torsvik et al., 2001b).
d For ages see Powell et al. (2001) and references therein.
the previous section); (b) similarities in the Neoproterozoic southern Laurentia (e.g., Nyman et al., 1994). The sedimentary
stratigraphy of South China, southeastern Australia and western provenance of quartzite in the overlying post-1200 Ma succes-
Laurentia as recognised earlier by Eisbacher (1985); (c) sim- sion (Li et al., unpublished data), assumed to have sourced from
ilarities between crustal provinces in the Cathaysia Block of older Cathaysian rocks, contains populations comparable to the
southeastern South China and southern Laurentia; (d) the need 1610–1490 Ma, westerly sourced non-Laurentian detrital grains
for a western source region to provide the late Mesoproterozoic reported in the Belt Basin (Ross and Villeneuve, 2003). It is thus
detrital grains in the Belt Basin. The modified reconstruction plausible to have Cathaysia as a part of Laurentia for at least
(Fig. 2b) and the schematic history for the formation and break- the latter part of the 1830–1000 Ma interval (Figs. 2b and 3).
up of such a configuration were adapted for constructing the According to the “Missing-Link” model, the collision
Geodynamic Map of Rodinia (Appendix I) and the related between Laurentia–Cathaysia and Yangtze did not start until ca.
palaeogeographic time slices and animation. Although not a 1140 Ma or younger at one end of the Sibao Orogen (Greentree
unique solution, it negates the need for matching basement geol- et al., 2006), and lasted until ca. 900 Ma at the other end in
ogy between Australia–East Antarctica and western Laurentia South China (Z.X. Li et al., 2003a; Ling et al., 2003). This late
prior to 1000–900 Ma (see discussions in Section 2.1.1), and formation of the Laurentia–South China–Australia–East Antarc-
is plausible in view of the currently known Neoproterozoic rift tica connection provides an explanation for the occurrence of
record, early Neoproterozoic mantle plume record, and palaeo- Grenvillian orogenic events along western Laurentia, north-
magnetic constraints. Key evidence for the model is discussed ern Queensland, King Island-Transantarctic Mountains, and the
below. Albany-Fraser-Musgrave belt.
2.1.2.1. Cathaysia as an extension of Laurentia from 2.1.2.2. Neoproterozoic plume record. Large features related
ca. 1800 Ma until Rodinia time, and no connection to mantle plume events, such as radiating dyke swarms or large
between Australia–East Antarctica, Yangtze craton and igneous provinces, can be used for reconstructing past continen-
Laurentia–Cathaysia until 1100–900 Ma. The Cathaysia tal connections (e.g., Ernst et al., 1995, 2008). Park et al. (1995)
Block, although poorly exposed, has a crustal composition were the first to apply this technique to test the SWEAT con-
similar to what may be expected for the western source region of nection, but precise dating of the relevant dyke swarms revealed
the Belt Basin in southwestern Laurentia (Ross et al., 1992). It that their ages are too different to represent the same event:
has a ca. 1830–1430 Ma basement that recorded 1300–1000 Ma ca. 825 Ma for the Gairdner-Amata dyke swarm in central and
metamorphism (Z.X. Li et al., 2002). Hainan Island in this southeastern Australia (Sun and Sheraton, 1996; Wingate et al.,
block is particularly similar to the Mojave Province in that it 1998), and ca. 780 Ma for the radiating Gunbarrel dyke swarms
has ca. 1430 Ma granitic intrusions, as well as synchronous in western Laurentia (e.g., Harlan et al., 2003a,b). No counter-
intracratonic sedimentary and volcanic successions (Z.X. part of the Australian 825 Ma event has been reported in western
Li et al., 2002, and unpublished data), comparable to the Laurentia as one would expect in the SWEAT configuration. The
1500–1350 Ma transcontinental granite–rhyolite province of radiating 780 Ma Gunbarrel dyke swarm in western Laurentia
9. Z.X. Li et al. / Precambrian Research 160 (2008) 179–210 187
Fig. 3. Tectonostratigraphic correlations between Australia, Yangtze craton, Cathaysia and Laurentia. Major glaciations: M = Marinoan; S = Sturtian; N = Nantuo;
C = Changan; I = Ice Brook; R = Rapitan.
points to a plume-centre to its west (present coordinates), but in Li et al., 1995, 1999; X.H. Li et al., 2002; Z.X. Li et al., 2003b;
eastern Australia there is no evidence for a plume centre apart Preiss, 2000; Wang and Li, 2003) (Fig. 3). A rift–drift transition
from limited volcanism in the Adelaide Rift Complex (Preiss, has been identified in the Adelaidean stratigraphy to be between
2000) and minor mafic igneous rocks in northwestern Tasmania the ca. 720 Ma Sturtian glacial deposits and the overlying Tapley
(Holm et al., 2003). Hill Formation (Powell et al., 1994).
Li et al. (1999) and Z.X. Li et al. (2003b) presented evi- There is no record of rifting along western Laurentia until
dence for South China being above a plume centre at both ca. after the 780 Ma Gunbarrel dyke swarm (e.g., Harlan et al.,
825 Ma and 780 Ma, which is consistent with its position in 2003a,b). Rift magmatism mainly occurred between 750 Ma and
the “Missing-Link” configuration (Fig. 4). Key evidence for 720 Ma (e.g., Heaman et al., 1992; Ross and Villeneuve, 1997;
a ca. 825 Ma plume-head beneath South China includes the Karlstrom et al., 2000), although evidence exists for events of
widespread occurrence of magmatism with rock types ranging younger ages (Lund et al., 2003; Fanning and Link, 2004) as
from granite to mafic–ultramafic dykes and sills (implying mafic in South China (e.g., Zhou et al., 2004; Zhang et al., 2005).
underplating and a large heat source), large-scale syn-magmatic Along with the glacial record, the post-780 Ma tectonostratigra-
doming, and the development of ca. 820 Ma continental rift sys- phy of western Laurentia, eastern Australia (e.g., Young, 1992;
tems (Li et al., 1999; X.H. Li et al., 2003a,b; Ling et al., 2003; Rainbird et al., 1996) and South China (e.g., Wang and Li,
Wang and Li, 2003). A similar large-scale magmatic breakout 2003) are widely regarded as correlative (Fig. 3), although such
occurred at ca. 780 Ma, with some mafic dykes showing geo- a correlation is not unique across the globe.
chemical characteristics of continental flood basalts (Z.X. Li et
al., 2003b; Lin et al., 2007). It should be noted that alternative 2.1.2.4. Palaeomagnetism. Another advantage of the
geochemical interpretations exist for the 825–740 Ma magma- “Missing-Link” model is that it does not require a com-
tism in South China (e.g., arc magmatism, Zhou et al., 2002; mon apparent polar wander path (APWP) between the relevant
magmatism caused by post-orogenic slab break-off, Wang et al., continents until amalgamation sometime between 1000 Ma and
2006). 900 Ma. On the other hand, the currently available palaeomag-
netic data for ca. 820–800 Ma permit such an Australia–South
2.1.2.3. Neoproterozoic rift records and glacial events. Rift- China–Laurentia configuration at that time, although it must
ing records in South China show remarkable similarities to that have broken up by ca. 750 Ma (Li et al., 2004; note the
of eastern Australia, featuring four major episodes of magma- overlap between the 820 Ma and 800 Ma palaeopoles for India,
tism and rifting in the ca. 830–700 Ma interval: ca. 820 Ma, ca. Australia and South China, and the scatter in the ca. 750 Ma
800 Ma, ca. 780 Ma, and ca. 750–720 Ma (Powell et al., 1994; poles in Fig. 2b).
10. 188 Z.X. Li et al. / Precambrian Research 160 (2008) 179–210
2.1.3. The AUSWUS and AUSMEX connections
AUSWUS (Australia–Southwest US)-like fit (Fig. 2c) was
first suggested by Brookfield (1993) based on matching lin-
ear fractures supposedly formed during the break-up of Rodinia
along the margins of eastern Australian craton and western Lau-
rentia. However, the lineaments along the eastern margin of
the Australian craton were later shown to be no older than ca.
600 Ma (Direen and Crawford, 2003). The AUSWUS connec-
tion was later revived by Karlstrom et al. (1999) and Burrett and
Berry (2000), mostly through matching basement provinces and
sedimentary provenances between Australia and southwestern
Laurentia (also see Blewett et al., 1998; Berry et al., 2001; Ross
and Villeneuve, 2003; Wade et al., 2006). Despite its merits as
stated by its proponents, there are noticeable difficulties in this
model (Fig. 2c), namely:
(1) The truncation of the Albany-Fraser-Musgrave belt against
cratonic western Laurentia, and difficulties in explaining the
scattered evidence of Grenvillian metamorphism in west-
ern Laurentia, northern Queensland, Tasmania and the Ross
Orogen (see Section 2.1.1).
(2) The lack of a prominent ca. 1400 Ma granite–rhyolite
province in Australia as is present in southern Laurentia.
(3) The lack of a ca. 825 Ma plume record in Laurentia as a
counterpart to the Gairdner-Amata dyke swarm in Australia
(Wingate et al., 1998), and a lack of ca. 780 Ma plume record
in northern Australia, where one would expect to find a
plume-head for the 780 Ma Gunbarrel radiating dyke swarm
in western Laurentia in such a configuration.
(4) The significantly younger starting age of continental rift-
ing in western Laurentia (<750 Ma) compared with eastern
Australia (ca. 825 Ma).
(5) The ca. 1200 Ma palaeomagnetic misfit (Pisarevsky et al.,
2003a), although the ca. 1100–1050 Ma palaeopoles mostly
agree rather well (Fig. 2c).
Fig. 4. Evidence for plume activities in the Missing-Link model: GD, Gairdner-
Amata dyke swarm (Sun and Sheraton, 1996; Wingate et al., 1998); BH, Bow Hill
Based on a new 1070 Ma palaeomagnetic pole from the Bange-
lamprophyre dykes (Pidgeon et al., 1989); GB, Guibei mafic–ultramafic intru-
sions (Li et al., 1999); GUN, Gunbarrel dyke swarms (Harlan et al., 2003a,b); mall Basin sills in the Edmund Fold Belt of Western Australia,
KD, Kangding dykes and mafic intrusions (Z.X. Li et al., 2003b; Lin et al., Wingate et al. (2002) argued that previous poles of the same age
2007); T, Mafic and granitic intrusions in Tasmania (Holm et al., 2003). from central Australia (poles marked as 1076 Ma and 1054 Ma
in Fig. 2b and c) are unreliable. Using only their own pole,
they argued that if Australia was connected to Laurentia at
However, the configuration in Fig. 2b is not unique either ca. 1070 Ma, the connection could only have been between
geologically or palaeomagnetically. An alternative position for northern Queensland of Australia and Mexico of southern Lau-
South China northeast of Australia satisfies the ca. 750 Ma poles rentia (the AUSMEX fit; Fig. 2d). However, subsequent work
(Evans et al., 2000), but contradicts the ca. 800 Ma poles (Li on the 1070 Ma rocks in central Australia reaffirmed the reli-
et al., 2004). Positions to the northwest or west of Australia, ability of the central Australian poles (Schmidt et al., 2005).
and adjacent to the northern margin of Greater India, have also Therefore it appears probable that either the 1070 Ma Bange-
been proposed (Evans et al., 2000; Jiang et al., 2003; Li et al., mall Basin sills, or the central Australian data, have suffered
2004; Yang et al., 2004), but the geological matches in these vertical-axis rotations, during either the ≥900 Ma (40 Ar–39 Ar
configurations are not as strong as in the “Missing-Link” con- cooling ages) Edmundian Orogeny in the southern Capricorn
figuration discussed above. Also, by removing South China from Orogen (Occhipinti and Reddy, 2005) in the case of the Bange-
the “Missing-Link” configuration, one would have to find other mall sills, or the late Neoproterozoic Petermann or Phanerozoic
explanations for the geological and palaeomagnetic mismatches Alice Springs orogenies in central Australia. The geological
between Australia–East Antarctica and Laurentia as discussed merit of the AUSMEX fit is yet to be demonstrated. Nonetheless,
in Section 2.1.1. a new palaeomagnetic pole from the 800 Ma to 760 Ma oriented
11. Z.X. Li et al. / Precambrian Research 160 (2008) 179–210 189
cores from the Lancer-1 drill hole in the Officer Basin of south
Central Australia is more compatible with the ∼780 Ma Lau-
rentian poles in the AUSMEX configuration than in any of the
abovementioned configurations (Pisarevsky et al., 2007).
As mentioned earlier, ca. 1200 Ma poles do not permit either
an AUSWUS or an AUSMEX fit at that time (Pisarevsky et al.,
2003a; Fig. 2c and d).
2.1.4. Siberia–Laurentia connection
Although there is a consensus that Siberia was likely con-
nected to Laurentia for much of the Proterozoic, opinions differ
regarding how they were connected. The dominant view is
that Siberia was adjacent to northern Laurentia, but different
models show its position in a range of orientations (Hoffman,
1991; Condie and Rosen, 1994; Pelechaty, 1996; Frost et al.,
1998; Rainbird et al., 1998; Ernst et al., 2000; Vernikovsky
and Vernikovskaya, 2001; Metelkin et al., 2005a; see review
by Pisarevsky et al., 2003b). A vastly different position for
Siberia was proposed by Sears and Price (1978, 2000) with
Siberia placed west of the present western margin of Lauren-
tia. However, this latter fit is not supported by palaeomagnetic
data (Fig. 2e) which show that Siberian poles fall far away from
coeval palaeopoles for Laurentia in such a configuration. The
configuration we adopted for the Rodinia Map follows that of
Pisarevsky et al. (2008). It is largely based on existing palaeo-
magnetic constraints for the ∼1050–970 Ma interval between Fig. 5. Positions of Baltica, Amazonia and West Africa in Rodinia, with palaeo-
Siberia and Laurentia (Fig. 2f, which shows that Siberian poles magnetic South poles showing data from Baltica (green poles) merge with that of
generally follow the APWP of Laurentia for the 1043–980 Ma Laurentia (black poles) by ca. 1000 Ma. Orange dots represent ca. 1500–1350 Ma
interval). Detailed discussions for the various models are given intracratonic magmatism.
in Pisarevsky et al. (2008).
Palaeomagnetic data place Siberia at some distance from 1993; Karlstrom et al., 2001; see also Zhao et al., 2002 for
the northern Laurentian margin, allowing space for other Pre- a review) or even before (e.g., Heaman, 1997; Bleeker and
cambrian blocks (e.g., Arctida of Zonenshain et al., 1990; Ernst, 2006), palaeomagnetic data suggest a rather complex
Vernikovsky, 1997; Vernikovsky et al., 2003). The relative dis- history between the two cratons during the Mesoproterozoic
tance between Siberia and Laurentia explains the lack of any (e.g., Elming et al., 1993, 2001; Buchan et al., 2000, 2001;
counterpart for the Mackenzie large igneous event in Siberia. Pesonen et al., 2003). The configuration we adapted in the
Sklyarov et al. (2003), Metelkin et al. (2005c) and Gladkochub Rodinia Map (Appendix I; Fig. 5) follows that of Hoffman
et al. (2006) reported mafic intrusions in southern Siberia with (1991; see also Bogdanova et al., 2008; Pease et al., 2008),
40 Ar–39 Ar ages around ∼740 Ma that may be correlated with the which is a geologically based reconstruction but is also sup-
Franklin igneous event in northern Laurentia associated with the ported by a common APWP between the two cratons for the
Neoproterozoic opening of the Palaeo-Asian Ocean. This event ∼1000–900 Ma interval (Elming et al., 1993; Hyodo et al., 1993;
broadly coincides with the accumulation of the Karagas Group Weil et al., 1998; Pisarevsky et al., 2003b; Fig. 5). It is noted
in south Siberia, which has been interpreted as a passive margin that, although pre-1000 Ma palaeomagnetic data do not permit
succession (Pisarevsky and Natapov, 2003; Vernikovsky et al., exactly the same configuration, they still allow the two adja-
2003; Gladkochub et al., 2006). This earlier break-up model con- cent cratons to develop correlative Proterozoic belts including
trasts with the Early Cambrian break-up suggested by Pelechaty the Sveconorwegian and Grenville orogens (Winchester, 1988;
(1996) based on tectonostratigraphic analyses, with the latter Gower et al., 1990; Gorbatschev and Bogdanova, 1993), and
model being challenged by both Rainbird and de Freitas (1997) ˚ a
similar ca. 1500–1350 Ma intracratonic magmatism (Ah¨ ll and
and Khudoley (1997). Connely, 1998; Karlstrom et al., 2001; Bogdanova et al., 2001,
ˇ c ˇ c
2008; Ceˇ ys et al., 2002; S¨ derlund et al., 2002, 2005; Ceˇ ys
o
2.2. Continents along the present eastern margin of and Benn, 2007).
Laurentia: Baltica, Amazonia and West Africa cratons The position of the Amazonia craton roughly follows that
of Hoffman (1991, a geologically based reconstruction) and
The relative position of Baltica to Laurentia in Rodinia is Weil et al. (1998), (a palaeomagnetic reconstruction). Amazo-
probably one of the least controversial. Although geological cor- nia was one of the cratons that was separated from Laurentia by
relations suggest that the two blocks could have been together a Mesoproterozoic ocean, the closure of which made it part of
as long ago as ca. 1800 Ma (e.g., Gorbatschev and Bogdanova, Rodinia during the Grenvillian Orogeny (e.g., Davidson, 1995,
12. 190 Z.X. Li et al. / Precambrian Research 160 (2008) 179–210
2008; Rivers, 1997; Loewy et al., 2003). According to this There are few constraints on the position of the West Africa
interpretation, the Rondonia-Sunsas belt in southwestern Ama- craton in Rodinia. No orogen of Grenvillian age has been found
zonia resulted from continental collision with Laurentia between in or around the craton; therefore, if it was part of Rodinia, it
1080 Ma and 970 Ma (e.g., Sadowski and Bettencourt, 1996; would likely have been part of a larger craton (e.g., together
Tassinari et al., 2000 and references therein). A recent ∼1200 Ma with Amazonia, similar to their connection in Gondwanaland).
Amazonia palaeomagnetic pole reported by Tohver et al. (2002) No palaeomagnetic data are available to verify this position.
led these authors to suggest a possible juxtaposition of west- Trompette (1994, 1997) proposed the existence of a single West
ern Amazonia with the Llano segment of Laurentia’s Grenville Africa–Amazonia–Rio de La Plata mega-craton in the Meso-
orogen. This is broadly in accord with the proposed history of and Neoproterozoic, although their relative positions cannot be
the Llano orogen (Mosher, 1998). Tohver et al. (2004, 2005) defined precisely. Onstott and Hargraves (1981), on the basis
more recently suggested that the initial docking of Amazonia of a comparison of Paleo- to Mesoproterozoic palaeomagnetic
with southern Laurentia was followed by strike–slip transport of data from these two blocks, also suggested that the two cratons
Amazonia to the northeast (present coordinates). However, such were together during the Proterozoic but that large shear move-
palaeomagnetic reconstructions, utilizing a single pole from ments occurred between them. We have used an Amazonia–West
each continent rather than matching relatively long segments Africa fit similar to their Gondwana fit.
of APWPs, have inherent longitudinal uncertainties.
Continental rifting along the eastern and southern margin of 2.3. Congo-S˜ o Francisco, Rio de la Plata and Kalahari
a
Laurentia may have started as early as ca. 750 Ma (Su et al., 1994; cratons
Aleinikoff et al., 1995; Fetter and Goldberg, 1995), although a
later pulse of magmatism at ∼615–570 Ma is commonly inter- The positions of Congo-S˜ o Francisco and Kalahari cratons
a
preted as representing the break-up and opening of the Iapetus relative to Laurentia in Rodinia (Fig. 6) broadly follow that pro-
Ocean, first between Laurentia and Baltica, and then between posed by Hoffman (1991) on geological grounds, but with some
Laurentia and Amazonia (Cawood et al., 2001; Cawood and additional justifications according to more recent palaeomag-
Pisarevsky, 2006 and references therein). netic results. The Rio de la Plata terrane is placed between the
Fig. 6. Positions of Congo, Rio de la Plata, Kalahari, India and Tarim in Rodinia. Palaeomagnetic data show that Congo-Sao Francisco did not join Laurentia until
after ca. 1010 Ma. The ca. 795 Ma pole from Congo-Sao Francisco overlaps with the ca. 814 Ma pole from India in this configuration, but their ca. 755 Ma poles are
widely separated (as the other ca. 755 Ma poles in Fig. 2b), suggesting this configuration was already disintegrating by that time.
13. Z.X. Li et al. / Precambrian Research 160 (2008) 179–210 191
Congo-S˜ o Francisco craton and Laurentia in Rodinia (e.g., Weil
a cratons (see Section 3.2). However, no pre-750 Ma Neoprotero-
et al., 1998; D’Agrella-Filho et al., 2004). zoic magmatism has yet been identified in southern Laurentia.
The preservation of late Mesoproterozoic reworked and juve-
nile crust and orogenic events along the Irumide belt of the 2.4. India, Madagascar, Seychelles, and the
Congo-S˜ o Francisco craton (e.g., De Waele et al., 2003) and
a Arabian–Nubian Shield
along the margin of the Rio de la Plata terrane (Fuck et al., 2008)
permits them to be the continents that joined Laurentia during Geological data demonstrate that northeastern Madagascar
the Grenvillian Orogeny, although there are opinions that the (the Antongil block) was part of the Indian craton before and
Congo-S˜ o Francisco craton may not have been part of Rodinia
a during Rodinia time (e.g., Collins and Windley, 2002; Collins
at all (e.g., Kr¨ ner and Cordani, 2003; Pisarevsky et al., 2003b).
o et al., 2003; Collins, 2006)—here we collectively call them the
Palaeomagnetic data indicate the presence of a large latitudinal Indian craton. The Seychelles appears to have formed along the
gap (an ocean?) between the Congo-S˜ o Francisco craton and
a west margin of India during the Neoproterozoic (Torsvik et al.,
Laurentia at ca. 1100–1050 Ma (D’Agrella-Filho et al., 2004); 2001a,b).
the ≥1000 Ma orogenic events in the Irumide belt may indi- The position of the Indian craton in Rodinia is controversial.
cate closure of this ocean by ca. 1000 Ma (e.g., De Waele et Earlier workers attached it to Australia and East Antarctica as
al., 2003, 2006a,b, 2008; De Waele, 2005; Johnson et al., 2006, in the Gondwanan configuration (e.g., Dalziel, 1991; Hoffman,
2007a). 1991; Moores, 1991; Li et al., 1996; Torsvik et al., 1996; Weil et
The Kalahari craton, together with the Grunehogna terrane al., 1998). However, subsequent geological (Fitzsimons, 2000)
(e.g., Groenewald et al., 1995; Jones et al., 2003) and perhaps and palaeomagnetic (see below) investigations have challenged
part of the Maud Province of East Antarctica (e.g., Fitzsimons, such a configuration. Based on their palaeomagnetic results from
2000), are placed against the Grenville belt in southern Laurentia the 771 Ma to 751 Ma Malani igneous suite of northwestern
following Hoffman (1991) and Hanson et al. (1998). Palaeomag- India, Torsvik et al. (2001a,b) suggested that India was either
netic data from Kalahari and Laurentia at ca. 1110 Ma suggest not part of Rodinia, or was adjacent to the northwestern mar-
that there was a latitudinal difference of ca. 30 ± 14◦ between gin of Australia at Rodinia time and underwent a left-lateral
their facing margins at that time (Powell et al., 2001; Hanson movement relative to Australia–East Antarctica before 535 Ma
et al., 2004), but by ca. 1000 Ma the APWPs of the two con- to reach its Gondwanan position. Powell and Pisarevsky (2002)
tinents merged together in this configuration (Fig. 6). This is supported the idea that India was probably never part of Rodinia
consistent with metamorphic ages of as young as ca. 1000 Ma because a ca. 810 Ma pole (Radhakrishna and Mathew, 1996)
along both the Namaqua-Natal belt in southern Kalahari (e.g., places India at a polar position when Rodinia was supposed to
Eglington and Armstrong, 2003) and the Grenville belt in Lau- occupy a largely low palaeolatitude position.
rentia (e.g., Davidson, 1995; Rivers, 1997; Keppie et al., 2003; In the Rodinia Map (Appendix I), the position of India
Weber and Hecht, 2003). However, other possible positions of between 900 Ma and 800 Ma is made following both geolog-
Kalahari in Rodinia have also been proposed on geological and ical evidence (e.g., plume record as described by Z.X. Li et
palaeomagnetic grounds (e.g., Dalziel, 1997; Pisarevsky et al., al., 2003b) and palaeomagnetic interpretations as described by
2003b). Li et al. (2004). Both India and Seychelles have Neoproterozoic
Like the Amazonia craton, the Congo-S˜ o Francisco, Rio de
a bimodal magmatism similar to that in Australia and South China
la Plata and the Kalahari cratons are believed to have broken in age distributions. Many interpreted this to represent continen-
away from Laurentia between 750 Ma (see evidence below) and tal arc magmatism, partly because of the perceived “continental
the final assembling of Gondwanaland by ca. 550–520 Ma (e.g., margin” positions of these continental blocks (e.g., Torsvik et
Meert, 2003; Collins and Pisarevsky, 2005). Rift magmatism at al., 2001a,b; Tucker et al., 2001; Ashwal et al., 2002). However,
ca. 750 Ma is present along the Grenvillian margin of Laurentia their bimodal nature, the intraplate characteristics of the Malani
(e.g., Su et al., 1994; Fetter and Goldberg, 1995; Aleinikoff et igneous suite (e.g., Roy, 2001; Singh and Vallinayagam, 2004)
al., 1995), the western margin of Kalahari (e.g., Frimmel et al., and other Neoproterozoic intrusions elsewhere in India (e.g.,
1996, 2001; Hoffman et al., 1996), and the Damaran margin of Santosh et al., 1989), and their similar age distributions to plume-
the Congo-S˜ o Francisco craton (e.g., Hoffmann et al., 2004;
a related rocks in Australia and South China, make them more
Halverson et al., 2005). The stratigraphy of the Kalahari and likely the products of melting above Neoproterozoic plume-
Congo-S˜ o Francisco continental margins indicates rift–drift
a heads during Rodinia time (e.g., Frimmel et al., 2001; Li et al.,
transitions immediately after ca. 750 Ma (Frimmel et al., 1996; 2001; Z.X. Li et al., 2003b).
Hoffman et al., 1996; Hoffmann et al., 2004; Halverson et al., Palaeomagnetically, a poorly dated ca. 1079 Ma pole from
2005; Johnson et al., 2007b). As shown in Fig. 6, ca. 750 Ma India (Miller and Hargraves, 1994) does not agree with coeval
palaeomagnetic poles from the Congo-S˜ o Francisco craton fall
a poles from Australia in the preferred Rodinia configuration,
>30◦ away from coeval poles of Laurentia. whereas the ca. 810 Ma pole from India (Radhakrishna and
The position of the Congo-S˜ o Francisco and Kalahari cra-
a Mathew, 1996) agrees with similar-aged poles from South China
tons in Rodinia as shown in Fig. 6 is also consistent with (Li et al., 2004), South Australia (McWilliams and McElhinny,
the common occurrence of ca. 830–745 Ma plume-induced 1980; however, the reliability of this pole has not been demon-
intraplate magmatism in these two cratons as well as coeval strated with confidence) (Fig. 2b), and the Congo-S˜ o Francisco
a
magmatism in adjacent India, Australia, South China and Tarim craton (Meert et al., 1995; Deblond et al., 2001) (Fig. 6).
14. 192 Z.X. Li et al. / Precambrian Research 160 (2008) 179–210
We thus envisage that India became part of Rodinia by ca. of Li et al. (1996) that was based on tectonostratigraphic corre-
900 Ma through continental collision along the ca. 990–900 Ma lations, with some palaeomagnetic justifications. Minor terranes
high-grade metamorphic Eastern Ghats belt of India and the cor- (such as the Cimmerian terranes, Metcalfe, 1996) may have
responding Rayner Province in East Antarctica (e.g., Mezger and existed between Tarim and Australia (Li and Powell, 2001).
Cosca, 1999; Boger et al., 2000, 2001; Fitzsimons, 2000; Kelly The geological arguments for such a configuration are: (1) the
et al., 2002; Fig. 6). presence of late Mesoproterozoic-earliest Neoproterozoic active
The ca. 770–750 Ma palaeopoles from the India craton are far margins along both the present northwestern and southern mar-
removed from the ca. 755 Ma pole of the Mundine Well dykes gin of this Archaean–Paleoproterozoic craton (Zhang et al.,
in Australia (Wingate and Giddings, 2000) in this configuration 2003; Lu et al., 2008a) suggests that it did not join Australia until
(Fig. 2b), indicating that if the configuration is correct, India the beginning of the Neoproterozoic; (2) 820–750 Ma bimodal
would have rifted away from Australia–East Antarctica by ca. (plume-induced?) intrusions in Tarim (Chen et al., 2004; Guo et
755 Ma. al., 2005; C.L. Zhang et al., 2006; Lu et al., 2008b) can be corre-
There are few constraints on the positions of the numerous ter- lated with the ca. 820–800 Ma lamprophyre dykes and kimberlite
ranes constituting the East African Orogen (Stern, 1994), which pipes in the Kimberley craton of western Australia (Pidgeon et
includes the Arabian–Nubian Shield and the ∼3000 km long al., 1989), and the 755 Ma Mundine Well dyke swarm in the
Azania continent that stretches from Arabia to central Madagas- northwestern Pilbara craton (Wingate and Giddings, 2000) and
car (Collins and Windley, 2002; Collins and Pisarevsky, 2005; A-type granitic magmatism in the Leeuwin Block of southwest-
Collins, 2006). Cox et al. (2004) and Fitzsimons and Hulscher ern Australia (Collins, 2003). A noticeable difference is the
(2005) suggest that central Madagascar was part of the Congo- lack of ≤750 Ma rift magmatism in western Australia, which
S˜ o Francisco craton at ca. 1800 Ma but became an independent
a is present in Tarim (Xu et al., 2005; Z.X. Li et al., unpub-
terrane during Rodinia time and joined India by ca. 700 Ma. lished data). This could be due to the rift margin being farther
Most of the terranes in the Arabian–Nubian Shield are believed off shore in Australia, or to it being totally reworked by the
to represent juvenile Neoproterozoic arcs and micro-continental Pinjarra Orogeny (Fitzsimons, 2003); (3) both the Kimberley
fragments that accreted to western Gondwana during the Neo- region of northwestern Australia and Tarim had up to three
proterozoic (e.g., Stern, 1994; Whitehouse et al., 2001; Meert, Neoproterozoic glacial intervals, although precise ages of the
2003; Collins and Pisarevsky, 2005). However, the nature of glacial events and their lateral correlations are still debated
widespread 850–750 Ma igneous rocks in these terranes remains (Li et al., 1996; Grey and Corkeron, 1998; Xiao et al., 2004);
controversial. Some believe they represent arc volcanism (e.g., (4) Cambrian mafic volcanic units in northeastern Tarim may
Stern, 1994; Handke et al., 1999; Tucker et al., 2001). Others correlate with the Antrim Plateau Volcanics in the Kimberley
suggest that those bimodal rocks were likely formed (1) dur- (Li et al., 1996), which have been interpreted as part of the
ing continental extension (e.g., Kr¨ ner et al., 2000; Loizenbauer
o 513 Ma Kalkarindji Large Igneous Province in central and north-
et al., 2001) with possible underplating of plume magmatism, ern Australia (Hanley and Wingate, 2000; Glass and Phillips,
(2) with contributions of oceanic plateaux (Stein and Goldstein, 2006).
1996), or (3) as arcs with a plume input (Teklay et al., 2002). The Two Neoproterozoic palaeomagnetic poles have recently
Neoproterozoic Arabian–Nubian Shield is thought to represent been reported from the Tarim craton: one from ca. 800 Ma mafic
one of the most rapid episodes of predominantly juvenile crustal dykes (Chen et al., 2004), and the other from a ca. 750–730 Ma
generation in Earth’s history (Stein and Goldstein, 1996; Stein, volcanic unit (Huang et al., 2005). The ca. 800 Ma pole puts
2003). As the age spectrum of these rocks is almost identical to Tarim at a palaeolatitude comparable to the position as in the
those in South China, Australia and India, there could indeed Rodinia Map, although the relative orientation is somewhat dif-
have been a significant plume input as part of the Neoprotero- ferent. The younger pole places Tarim at a significantly lower
zoic Rodinia superplume activity (Li et al., 2003; Hargrove et palaeolatitude than that adopted in the Rodinia Map. As no fold
al., 2004; see further discussions in Section 3.2). test has been reported for either of the two poles, and both study
In previous Rodinia reconstructions the Arabian– regions are inside younger fold-and-thrust belts, we cannot rule
Nubian Shield was either placed adjacent to northeast out vertical-axis rotation which can only be identified through
Madagascar and India (e.g., Li and Powell, 2001), or adjacent, comparative study of similar-age rocks in other parts of Tarim.
and outboard of the Congo-S˜ o Francisco and Saharan cratons
a
(Collins and Pisarevsky, 2005). In the Rodinia Map (Appendix 2.6. North China
I and Figs. 6 and 8), these terranes are placed between India
and Sahara, satisfying both the common plume records in Based mainly on tectonostratigraphic correlations, Li et al.
Australia, India, the Arabian Shield, and the African cratons, (1996) suggested that the North China craton was adjacent to
and the records of arc accretion during the late Neoproterozoic Siberia in Rodinia. The connection may have started as early
assembly of Gondwanaland. as ca. 1800 Ma, and did not break-up until after ca. 600 Ma.
Reliable palaeomagnetic data at both ca. 1770 Ma (Halls et al.,
2.5. Tarim 2000) and ca. 1350 Ma (Wu et al., 2005) from North China lend
support to such a configuration (Fig. 7b). However, data from
We have positioned the Tarim craton of northwest China adja- younger Proterozoic rocks suggest a slightly different configura-
cent to northwestern Australia (Fig. 6) following the suggestion tion, involving a ca. 90◦ vertical-axis rotation of the North China
15. Z.X. Li et al. / Precambrian Research 160 (2008) 179–210 193
Fig. 7. Position of the North China craton (a) in Rodinia (after Zhang et al., 2006), and (b) during Paleo- to Mesoproterozoic (after Wu et al., 2005). Note that
palaeomagnetic data in (b) suggest that Laurentia, Siberia, Baltica and North China could have been together for the ca. 1800–1300 Ma interval (Wu et al., 2005).
craton in relation to Laurentia between ca. 1350 Ma and 1200 Ma of its collision with Baltica at ca.1000 Ma. Our model is also
(S. Zhang et al., 2006) (Fig. 7a). According to S. Zhang et al. constrained by palaeomagnetic data from Oaxaquia (Ballard et
(2006), North China and Laurentia could have shared a common al., 1989).
path between ca. 1200 Ma and ca. 700 Ma, but split up by ca. The space between Siberia and Laurentia in Rodinia is filled
615 Ma. It is unclear whether it was Siberia or other continental with several continental blocks that rifted away from northern
blocks that filled the gap between the two cratons for either the Laurentia during the Cretaceous opening of the Canadian
1800–1350 Ma or the 1200–700 Ma intervals. We have adopted basin. These include terranes in northern Alaska, northern
the rotation parameters for the North China craton provided by Chukchi Peninsula, Wrangel Island, the New Siberian Islands,
S. Zhang et al. (2006) for the Rodinia Map (Figs. 7a and 8). Severnaya Zemlya, northern Taimyr and the Chukchi Plateau
The lack of Neoproterozoic plume record in North China (e.g., (e.g., Zonenshain et al., 1990; Vernikovsky, 1997; Bogdanov
Lu et al., 2008b) is consistent with it being at distances from et al., 1998; Embry, 1998; Nokleberg et al., 2000; Vernikovsky
continents like Australia and South China in Rodinia. and Vernikovskaya, 2001; Natal’in, 2004; Drachev, 2004). Our
poor knowledge of these terranes makes geological correlation
2.7. Minor terranes between northern Laurentia and Siberia more difficult. The
position of the Kara Plate (exposed on Severnaya Zemlya in
The fragmented nature of many minor continental terranes, northern Taimyr) is debatable (Metelkin et al., 2005b). Although
as well as their usual lack of any palaeomagnetic constraint, detrital zircon grains from the base of the Kara stratigraphy
made it more difficult to place these terranes in Rodinia with indicate a Baltican affinity (Pease et al., 2005, 2006), there
much confidence. However, it is important to consider these are some geological arguments for a north Laurentian affinity
terranes because they could account for spaces and geological (Zonenshain et al., 1990; Natal’in et al., 1999). Exact positions
links between larger cratons in Rodinia. of these minor blocks in Rodinia are unclear due to the lack of
Keppie and Ramos (1999) proposed that two Central Amer- palaeomagnetic data.
ican terranes – Oaxaquia (Mexico) and Chortis (Honduras Previous reconstructions placed the Barentsia plate (exposed
and Guatemala) – were situated along the northern boundary in Eastern Svalbard) against the southern part of east Greenland
of South America in their reconstruction for the Ediacaran using their similarities in Neoproterozoic sedimentary succes-
(Vendian)–Cambrian boundary. Keppie and Ortega-Gutierrez sions (e.g., Winchester, 1988; Fairchild and Hambrey, 1995;
(1999) suggested that these blocks originated as arcs in a Harland, 1997; Andresen, 2004). However, we choose to place
Grenvillian ocean between Laurentia, Baltica, and Amazonia, it close to the northern part of East Greenland after Gee and
and were caught in-between the colliding cratons. These blocks Teben’kov (2004) who correlated the geochronological, struc-
experienced high grade, collisional-style metamorphism dur- tural, and stratigraphical data of Svalbard to northern Greenland.
ing their terminal collisions among Amazonia, Laurentia, and We have also reduced the size of the Barentsia plate in accor-
Baltica by ca. 1000 Ma. We place the Oaxaquia and Chortis dance with the recent discovery of a Caledonian arm in the
blocks along the northern margin of Amazonia, within the zone Barents Sea (Breivik et al.,2002).
16. 194 Z.X. Li et al. / Precambrian Research 160 (2008) 179–210
Fig. 8. A simplified (and reduced) Rodinia Map with legends.
3. Synthesis and animation: assembly and break-up of namic linkages and provide a testable hypothesis predicting
Rodinia, and formation of Gondwanaland continental positions and plate interactions, and enable palaeo-
climatic modellers to simulate continent-ocean-atmosphere
Through a series of cartoons, we illustrate a feasible sce- interactions.
nario for the formation of Rodinia as shown in Fig. 8 and
Appendix I, its break-up, and the eventual formation of Gond- 3.1. The formation of Rodinia (ca. 1100–900 Ma)
wanaland by the Early Cambrian. The rotation parameters for
the major continental blocks are given in Appendix III, available At 1100 Ma (Fig. 9a), Laurentia, Siberia, North China,
online. A digital animation of the palaeogeographic evolu- Cathaysia (part of present day South China) and perhaps Rio de
tion between 1100 Ma and 530 Ma, with geological features la Plata were already together, and the Yangtze craton had begun
shown for selected time windows, is also given (Appendix its oblique collision with Laurentia (at southern Cathaysia;
II). We recognise that this is just one of a number of fea- Greentree et al., 2006). However, all other continental blocks
sible scenarios for the evolution of Rodinia, and there are were still separated from Laurentia by oceans. The Australian
time intervals in the animation (e.g., the ca. 1000–820 Ma craton, including the East Antarctica part of the Mawson craton,
interval) for which we have very little palaeomagnetic had amalgamated by then. King Island, where a 1287 ± 18 Ma
constraints. Such reconstructions emphasise potential geody- metamorphic age was recently reported (Berry et al., 2005), Tas-
17. Z.X. Li et al. / Precambrian Research 160 (2008) 179–210 195
mania, and the South Tasman Rise (1119 ± 9 Ma quartz syenite, By ca. 1050 Ma (Fig. 9b), Kalahari had probably
Fioretti et al., 2005), could have been close to where Yangtze collided with southern Laurentia (see Section 2.3). Con-
and Laurentia were colliding, thus receiving Laurentia-sourced tinued collision of the Yangtze craton with western
sediments (Berry et al., 2001). Laurentia may have caused the 1090–1030 Ma metamor-
Fig. 9. Cartoons showing the assembly and break-up of Rodinia, and the formation of Gondwanaland. (a) 1100 Ma; (b) 1050 Ma; (c) 1000 Ma; (d) 900 Ma; (e)
825 Ma; (f) 780 Ma; (g) 750 Ma; (h) 720 Ma; (i) 630 Ma; (j) 600 Ma; (k) 550 Ma; (l) 530 Ma.
18. 196 Z.X. Li et al. / Precambrian Research 160 (2008) 179–210
Fig. 9. (Continued )
phism of the mafic sills in the Belt-Purcell Supergroup At ca. 1000 Ma (Fig. 9c), all but India, Australia–East Antarc-
(Anderson and Davis, 1995). Convergent margins were tica and Tarim had assembled to be joined with Laurentia,
developed between most continents, as the oceanic litho- whereas the Yangtze craton was still suturing to Cathaysia (part
sphere between them was consumed during the assembly of of Laurentia). The transpressional movement between Greater
Rodinia. India and Western Australia may explain the 1100–1000 Ma
19. Z.X. Li et al. / Precambrian Research 160 (2008) 179–210 197
Fig. 9. (Continued )
metamorphic ages reported from the Pinjarra Orogen (Bruguier the ca. 920–880 Ma arc volcanics and ophiolite obduction in
et al., 1999; Fitzsimons, 2003). the eastern Sibao Orogen of South China (Li et al., 2005),
By ca. 900 Ma all major known continental blocks had aggre- 950–900 Ma arc volcanics along the northern margin of the
gated to form the Rodinia supercontinent (Figs. 8 and 9d, and Yangtze craton (Ling et al., 2003), and the 990–900 Ma high-
Appendix I). Evidence for ca. 900 Ma orogenic events include grade metamorphic events in both the Eastern Ghats Belt of India
20. 198 Z.X. Li et al. / Precambrian Research 160 (2008) 179–210
Fig. 9. (Continued ).
and the corresponding Rayner Province in East Antarctica (e.g., sions and have 40 Ar–39 Ar cooling ages of 872–862 Ma (Zhang
Mezger and Cosca, 1999; Boger et al., 2000; Fitzsimons, 2000; L.F., unpublished data, as quoted in Chen et al., 2004).
Kelly et al., 2002). This may also be the time when the Tarim Stresses induced by the ca. 900 Ma event probably caused
craton joined Australia, as indicated by the development of the reactivation of older orogens within Rodinia. In the Mackenzie
Aksu blueschist which predates ca. 800 Ma mafic dyke intru- Mountains region of northwestern Laurentia, there is evidence