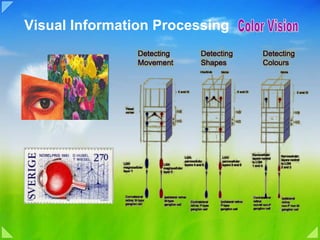
In the early 1960s, David Hubel and Torsten Wiesel (who won the Nobel Prize for Medicine in 1981) were the first to use microelectrodes to explore the receptive fields of the neurons in the lateral geniculate nucleus and the visual cortex. First, Hubel and Wiesel showed that the neurons of the lateral geniculate nucleus behave practically the same way as the ganglion cells in the retina. Then the scientists discovered the existence of three relatively independent pathways in the processing of visual information, each of which takes care of a different aspect of vision. The first is the M (magnocellular) channel , which begins in the magnocellular ganglion cells of the retina, passes through the lateral geniculate nucleus , and projects into layer IV Ca of the striate cortex. In this layer, the receptive fields of the neurons in this pathway are no longer circular (as they are in the retina and LGN), but instead are somewhat oblong . The cells in layer IV Ca project to the neurons of layer IV B. These latter neurons also have simple receptive fields, but often respond to stimuli from both eyes, contrary to the cells in layer IV C, whose receptive fields are monocular. Thus the neurons in layer IV B begin the process of integration that is necessary for human binocular vision . The cells in layer IV B are also selective for direction, but only if the straight-line stimulus is moving in a particular direction. For this reason, the M channel is thought to specialize in the analyzing the movement of objects. The second pathway for transmitting visual information is the P-IB (parvocellular-interblob) channel , which starts with the parvocellular ganglion cells in the retina, passes through the LGN, and ends in the cells of layer IV Cb, which respond like the parvocellular LGN cells from which they arise: they have small, monocular, circular receptive fields, most of them displaying red-green colour opposition. The axons from the cells in layer IV Cb then project to the interblob areas in layer III. The complex cells in that layer are even more specific than simple cells with regard to the orientation of stimuli, which suggests that the P-IB channel specializes in analyzing the shapes of objects. The third pathway for transmitting visual signals is the blob channel , which passes through the parvocellular and koniocellular layers of the LGN and then converges on the blobs in layer III. Besides certain neurons in layer IV C, the blobs contain the only colour-sensitive neurons in the striate cortex. The blobs are thus probably used to analyze the colours of objects.
Over the course of 1435 and 1436, an important treatise was written by the scholar, architect and writer Leon Battista Alberti (1404-1472). Although Alberti was less interested in color, he writes about the value of colors in combination, i.e., the concept that certain colors can enhance each other when juxtaposed. He also discusses the psychological effect of color to arouse emotions in the viewer. These ideas formed part of the science of vision and would be explored by much later writers and artists, and will be discussed in the following pages .
In 1672 the still relatively young and unknown Lucasian Professor of Mathematics at Cambridge University, Isaac Newton, published his first piece of experimental philosophy: “A Serie’s of Quere’s Propounded by Mr. Isaac Newton, to be Determin’d by Experiments, Positively and Directly Concluding His New Theory of Light and Colours; and Here Recommended to the Industry of the Lovers of Experimental Philosophy, as they Were Generously Imparted to the Publisher in a Letter of the Said Mr. Newtons of July 8.1672” in the Philosophical Transactions of the Royal Society . The work became a touchstone in the establishment of the short report of experimental results in a serialized publication as a major means of scientific communication. The Philosophical Transactions had existed for seven years prior to Newton’s contribution, but had been dedicated primarily to reporting the Royal Society’s regular piecemeal correspondence rather than the systematic presentation of experiments and observations, which was at that time accomplished mainly in the book format. A sketch by Newton of one of his prism experiments. As to the content of Newton’s first publication, it reported a series of simple but elegant experiments with a beam of sunlight and a couple of glass prisms, in which Newton demonstrated that light is not homogeneous and white, but heterogeneous, and made up of different colours each of which has a slightly different index of refraction thereby resulting in the spectrum when refracted by a prism or the rainbow when refracted by raindrops. Previous to Newton, it had been believed that colour was an attribute or property of the objects that were coloured and that the perception of colour was somehow transmitted from the objects to the eye during the process of vision, an idea that went back to Aristotle. It was also believed that the spectrum was produced by white light being somehow dirtied or darkened on passing through the refracting medium. Newton’s paper changed all of this radically. But not without difficulty. The two leading experts for things optical, at this time, were Robert Hooke in London and Christian Huygens in Paris, both of whom reacted very negatively to Newton’s paper. When asked for his opinion by Oldenburg, the secretary of the Royal Society, Huygens was at first lukewarm and did not appear to see anything new in Newton’s work, implying that he had not really read the paper, but, when pressed, rejected Newton’s theories out of hand. Newton was enraged and in his reply addressed Huygens, a leading figure in European natural philosophy, as if he were addressing a particularly ignorant schoolboy. Huygens said that if the discussion was to be conducted at that level, he would not contribute. One of Newton’s major problems was that he had used his discoveries to support his own view that light was corpuscular in nature; he argued that the refracting medium imparted spin to a light particle (in the same way as a tennis player imparts spin to the ball), and the different indexes of refraction are a result of the different degrees of spin imparted to the particles of each colour. Both Huygens and Hooke had developed wave theories of light, and it was Hooke who took up the attack. He interpreted Newton as saying that his theory of colour was dependent on a corpuscular theory of light. Yet, as he, Hooke, had already philosophically demonstrated that light was propagated in waves, then Newton’s theory must be wrong. This was just the main one of many criticisms that Hooke brought that led to a very tempestuous exchange of letters through Oldenburg over a period of several years. At first Newton was content to answer, and he even showed that his theory worked equally well for a wave theory of light at the same time producing the best mathematical model for such a theory in the 17th century. During this period Newton worked on a long exhaustive essay on optics covering all of his research work up until this time, which he intended to publish in the Philosophical Transactions as a glorious rebuttal of all of his critics. However, Hooke did not let up, and Newton was further beset by criticisms from Ignace Gaston Pardies, a highly respected Jesuit scientist living in Paris who was also something of an expert for optics, and a second Jesuit, the Englishman Francis Hall, known as Linus, who lived in Liège. The dispute with Pardies passed off relative quietly, but the one with Linus dragged on for six years, and was continued by his student John Gasgoines after Linus’ death. Although Linus was not a well-known philosopher, his objections are interesting and significant from a methodological point of view: he complained that he had been unable to repeat Newton’s experiments! This was not an isolated incident as the same thing occurred to Italian Newtonians at the beginning of the 18th century. In the case of the Italians, it turned out that the problem lay in the quality of the glass prisms that they were using and when they replaced them with better quality glass they were able to achieve the same results as Newton. One can assume that something similar happened in the case of Linus, but we will never know. The results of this mass of criticism were fairly monumental. Newton’s patience, never very good at the best of times, gave out. He withdrew the extended optics essay that he had been writing and refused to have any more direct dealing with the Royal Society until 1704. He never established a relationship with Huygens. The feud with Hooke was patched up, only to break out again in the 1680s when Hooke accused Newton of having stolen the inverse square law of gravitation from him (but that, as they say, is another story). In 1703 Hooke died and Newton extracted his revenge. He became active in the Royal Society and was immediately elected its president in 1704, from which position he prevented the publication of Hooke’s posthumous papers (and even is rumoured to have had his portrait burned). In the same year he finally published that long essay, to which Hooke’s criticism had driven him, as the first section of his book Opticks (which became a great classic of the scientific literature). In the Bible the rainbow is a symbol of peace following a deluge; for Newton, unweaving the rainbow proved to be the prelude to a storm.
The foundations of pre-20th-century color theory were built around “pure” or ideal colors, characterized by sensory experiences rather than attributes of the physical world. This has led to a number of inaccuracies in traditional color theory principles that are not always remedied in modern formulations.[ citation needed ] The most important problem has been a confusion between the behavior of light mixtures, called additive color , and the behavior of paint or ink (or dye or pigment) mixtures, called subtractive color . This problem arises because the absorption of light by material substances follows different rules from the perception of light by the eye
Young–Helmholtz theory From Wikipedia, the free encyclopedia The Young–Helmholtz theory (proposed in the 19th century by Thomas Young and Hermann von Helmholtz is a theory of trichromatic color vision – the manner in which the photoreceptors in the eyes of humans and other primates work to enable color vision. In 1802, Young postulated the existence of three types of photoreceptors (now known as cone cells) in the eye, each of which was sensitive to a particular range of visible light. Hermann von Helmholtz developed the theory further in 1850: that the three types of cone photoreceptors could be classified as short-preferring (blue), middle-preferring (green), and long-preferring (red), according to their response to the wavelengths of light striking the retina. The relative strengths of the signals detected by the three types of cones are interpreted by the brain as a visible color. For instance, yellow light uses different proportions of red and green, but little blue, so any hue depends on a mix of all three cones, for example, a strong blue, medium green, and low red. Moreover, the intensity of colors can be changed without changing their hues, since intensity depends on the frequency of discharge to the brain, as a blue-green can be brightened but retain the same hue. The system is not perfect, as it does not distinguish yellow from a red-green mixture, but can powerfully detect subtle environmental changes. The theory was proved over a century later in a 1983 experiment by Dartnall, Bowmaker, and Mollon, when microspectrophotopic readings of single eye cone cells were obtained. One experiment in dim light, when the retina is exposed, shows that the blue is missing in the reflection since it has been absorbed by rhodopsin. In the light-adapted eye, red and green are not reflected due to the pigments erythrolabe and chlorolabe, respectively. Moreover, a removed retina can be observed in the microscope and analyzed for red, blue and green cones
Goethe was both a writer and a scientist. His 1,400-page treatise on color was published in 1810. According to Goethe: “ That I am the only person in this century who has the right insight into the difficult science of colors, that is what I am rather proud of, and that is what gives me the feeling that I have outstripped many.” Because Goethe misinterprets some experiments, he incorrectly thinks that these experiments show Newton to be wrong. Goethe’s diagrams in the first plate of Zür Farbenlehre (Theory of Colors) include a colorwheel and diagrams of distorted color perception. The bottom landscape is how a scene would look to someone who was blue-yellow color blind. Goethe reformulates the topic of color in an entirely new way. Newton had viewed color as a physical problem, involving light striking objects and entering our eyes. Goethe realizes that the sensations of color reaching our brain are also shaped by our perception — by the mechanics of human vision and by the way our brains process information. Therefore, according to Goethe, what we see of an object depends upon the object, the lighting and our perception. Goethe seeks to derive laws of color harmony, ways of characterizing physiological colors (how colors affect us) and subjective visual phenomena in general. Goethe studies after-images, colored shadows and complementary colors. And he anticipates Hering’s “opponent-color” theory, which is one basis of our understanding of color vision today. Above all, Goethe appreciates that the sensation of complementary colors does not originate physically from the actions of light on our eyes but perceptually from the actions of our visual system.
Ewald Hering (1834-1918) devised the first accurate theory of color vision. He theorized the “opponent” nature of green/red and blue/yellow. Hering expanded on the ideas of Goethe and Schoepenauer. His charts show how all colors arise from a combination of green-or-red, blue-or-yellow and brightness. (In his diagram, the green-neutral-red is vertical, and blue-neutral-yellow is horizontal.) The left circle shows relative mixtures of color attributes. The right circle shows what we perceive when these attributes are mixed. when we look at a scene, our visual nerves register color in terms of the attributes of color: the amount of green-or-red; the amount of blue-or-yellow; and the brightness. To see how colors are registered in terms of the attributes of color, point at the painting by Renoir below. Note that these attributes are opposites , like hot and cold. Color nerves sense green or red — but never both; and blue or yellow — but never both. Thus, we never see bluish-yellows or reddish-greens. The opposition of these colors forms the basis of color vision.
Figure 29-1 Color vision enriches visual perception but alone it is a poor detector of spatial detail. (Images courtesy of K. R. Gegenfurtner.) A A normal full-color image contains information about variations in brightness and color. B An achromatic image captures brightness variations in the scene and is formed by weighting the energy of the reflected light by the overall spectral sensitivity of the eye. Spatial detail is easily discerned in this kind of image. C A purely chromatic image contains no information about variations in brightness in the scene; rather it contains only information about hue and saturation. Spatial detail is hard to discern. A second problem has been the failure to describe the very important effects of strong luminance (lightness) contrasts in the appearance of surface colors (such as paints or inks) as opposed to light colors; "colors" such as grays, browns or ochres cannot appear in light mixtures. Thus, a strong lightness contrast between a mid valued yellow paint and a surrounding bright white makes the yellow appear to be green or brown, while a strong brightness contrast between a rainbow and the surrounding sky makes the yellow in a rainbow appear to be a fainter yellow or white. A third problem has been the tendency to describe color effects holistically or categorically, for example as a contrast between "yellow" and "blue" conceived as generic colors, when most color effects are due to contrasts on three relative attributes that define lightness (light vs. dark, or white vs. black), saturation (intense vs. dull), and hue (e.g., red, yellow, green, blue or purple). Thus, the visual impact of "yellow" vs. "blue" hues in visual design depends on the relative lightness and intensity of the hues. These confusions are partly historical, and arose in scientific uncertainty about color perception that was not resolved until the late 19th century, when the artistic notions were already entrenched. However they also arise from the attempt to describe the highly contextual and flexible behavior of color perception in terms of abstract color sensations that can be generated equivalently by any visual media. Many historical “color theorists” have assumed that three “pure” primary colors can mix all possible colors , and that any failure of specific paints or inks to match this ideal performance is due to the impurity or imperfection of the colorants. In reality, only imaginary “primary colors” used in colorimetry can "mix" or quantify all visible (perceptually possible) colors; but to do this the colors are defined as lying outside the range of visible colors: they cannot be seen. Any three real “primary” colors of light, paint or ink can mix only a limited range of colors, called a gamut , which is always smaller (contains fewer colors) than the full range of colors humans can perceive
PIGMENTS Most colored objects reflect light that is generally richer in some parts of the visible spectrum than in others. The distribution of wavelengths is much broader than that for monochromatic light, however. This graph shows the spectral content of light that would be reflected from a red object, using a broad-band (white) light source. When light hits an object, one of three things can happen: the light can be absorbed and the energy converted to heat, as when the sun warms something; it can pass through the object, as when the sun's rays hit water or glass; or it can be reflected, as in the case of a mirror or any light-colored object, such as a piece of chalk. Often two or all three of these happen; for example, some light may be absorbed and some reflected. For many objects, the relative amount of light absorbed and reflected depends on the light's wavelength. The green leaf of a plant absorbs long- and short-wavelength light and reflects light of middle wavelengths, so that when the sun hits a leaf, the light reflected back will have a pronounced broad peak at middle wave-lengths (in the green). A red object will have its peak, likewise broad, in the long wavelengths, as shown in the graph on the next page. An object that absorbs some of the light reaching it and reflects the rest is called a pigment . If some wavelengths in the range of visible light are absorbed more than others, the pigment appears to us to be colored. What color we see, I should quickly add, is not simply a matter of wavelengths; it depends on wavelength content and on the properties of our visual system. It involves both physics and biology.
Figure 29-4 An object's surface reflectance function describes the fraction of incident light that its surface reflects at each wavelength. A reflectance of 1 means that all the incident light is reflected. The pigments in natural surfaces generally have reflectance functions that vary slowly and smoothly across the visible spectrum, while synthetic pigments often have a more complex structure. A Surface reflectance functions of flowers. ( 1 ) Pale yellow gladiolus reflects little light at short wavelengths but quite uniformly reflects light at wavelengths greater than about 520 nm. ( 2 ) Bright orange gladiolus reflects light mostly at wavelengths greater than 580 nm. ( 3 ) Pale violet rose of Sharon reflects light at long wavelengths and short wavelengths, but not at middle wavelengths (the yellowish-green part of the spectrum). ( 4 ) Wine-colored gladiolus reflects light at long wavelengths and a little at short wavelengths. (From Evans 1948.) B Surface reflectance functions of human skin: white skin; black skin. (From Evans 1948, after Edwards and Duntley 1939.) C Surface reflectance function of light green enamel paint. The surface reflectance functions of synthetic pigments often vary less smoothly with wavelength than do those of natural surfaces. (From Wyszecki and Stiles 1982.)
Figure 29-5 The light reflected from a surface depends both upon the object's surface reflectance function and the spectral composition of the illuminant. The plot shows the spectral composition of light reflected from the surface of a blue vase illuminated by direct sunlight ( 1 ) and by a uniformly overcast sky ( 2 ). The different phases of daylight bring about a substantial change in the distribution of light reflected from the surface of an object. (From Evans 1948.)
The color opponent process is a color theory that states that the human visual system interprets information about color by processing signals from cones and rods in an antagonistic manner. The three types of cones have some overlap in the wavelengths of light to which they respond, so it is more efficient for the visual system to record differences between the responses of cones, rather than each type of cone's individual response. The opponent color theory suggests that there are three opponent channels: red versus green , blue versus yellow , and black versus white (the latter type is achromatic and detects light-dark variation, or luminance ). [1] Responses to one color of an opponent channel are antagonistic to those to the other color. While the trichromatic theory defines the way the retina of the eye allows the visual system to detect color with three types of cones, the opponent process theory accounts for mechanisms that receive and process information from cones. Though the trichromatic and opponent processes theories were initially thought to be at odds, it later came to be understood that the mechanisms responsible for the opponent process receive signals from the three types of cones and process them at a more complex level [2] . Besides the cones, which detect light entering the eye, the biological basis of the opponent theory involves two other types of cells: bipolar cells , and ganglion cells . Information from the cones is passed to the bipolar cells in the retina, which may be the cells in the opponent process that transform the information from cones. The information is then passed to ganglion cells , of which there are two major classes: magnocellular , or large- cell layers, and parvocellular , or small-cell layers. Parvocellular cells, or P cells, handle the majority of information about color, and fall into two groups: one that processes information about differences between firing of L and M cones, and one that processes differences between S cones and a combined signal from both L and M cones. The first subtype of cells are responsible for processing red-green differences,and the second process blue-yellow differences. P cells also transmit information about intensity of light (how much of it there is) due to their receptive fields . History Johann Wolfgang von Goethe first studied the physiological effect of opposed colors in his Theory of Colours in 1810. [3] Goethe arranged his color wheel symmetrically, "for the colours diametrically opposed to each other in this diagram are those which reciprocally evoke each other in the eye. Thus, yellow demands violet; orange, blue; red, green; and vice versa: thus... all intermediate gradations reciprocally evoke each other." [4] Ewald Hering proposed opponent color theory in 1872. [5] He thought that the colors red, yellow, green, and blue are special in that any other color can be described as a mix of them, and that they exist in opposite pairs. That is, either red or green is perceived and never greenish-red; although yellow is a mixture of red and green in the RGB color theory, the eye does not perceive it as such. In 1957, Hurvich and Jameson provided quantitative data for Hering's color opponency theory. [6] Griggs expanded the concept to reflect a wide range of opponent processes for biological systems in this book Biological Relativity (c) 1967.[ citation needed ] In 1970, Solomon expanded Hurvich's general neurological opponent process model to explain emotion, drug addiction, and work motivation.[ citation needed ] The opponent color theory can be applied to computer vision and implemented as the "Gaussian color model." [7] [ edit ] Subjective color and new colors [ edit ] Reddish green and yellowish blue Under normal circumstances, there is no hue one could describe as a mixture of opponent hues; that is, as a hue looking "redgreen" or "yellowblue". However, in 1983 Crane and Piantanida [8] carried out an experiment proving that, under special viewing conditions involving the use of an eye tracker , it is apparently possible to override the opponency mechanisms and, for a moment, get some people to perceive novel colors: "[ s ] ome observers indicated that although they were aware that what they were viewing was a color (that is, the field was not achromatic), they were unable to name or describe the color. One of these observers was an artist with a large color vocabulary. Other observers of the novel hues described the first stimulus as a reddish-green. " [9] [ edit ] Other uses Opponent processes have been used to explain color vision , pain, touch, emotions, smell, hearing, taste, and balance. It is basically an idea that for every stimulus there is an opposite neurological organization or structure to neutralize the response generated by the stimulus.[ citation needed ] [ edit ] See also
Figure 29-8 The reflectance function of a natural surface has component functions. A Three component functions, when added together in suitable proportions, provide the best three variable description of the surface reflectance functions of a large sample of natural objects. One curve can be loosely considered to represent the brightness dimension of the image; two other curves can be loosely thought of as representing dimensions of red-green variation and yellow-blue variation. These three component functions account for over 99% of the variance in the reflectance functions of the natural surfaces that have been studied. The fit can be made almost perfect by using three additional component functions (making six altogether). (From Cohen 1964 and Maloney 1986.) B The surface reflectance of an apple was measured at the point marked by the cross. C The apple's actual surface reflectance function is closely approximated by the best-fitting curve (dashed line) that could be synthesized by adding together, in appropriate proportions, the three fixed curves from A. The reflectance functions of most natural surfaces vary relatively smoothly and slowly with wavelength (see Figure 29-4A, B). The curve that describes surface reflectance can actually be assembled from a small number of even simpler underlying curves that can be thought of as elementary constituents common to all reflectance functions. Figure 29-8 shows a set of three such curves. By adding these three fundamental curves together in appropriate proportions, we can synthesize a real surface reflectance function rather well; by adding yet more fundamental curves we could do better still, though each additional curve would contribute progressively less information about the structure of the full reflectance function. Thus a visual system with a few sensing mechanisms (perhaps two or three) and spectral sensitivities that allowed the system to represent the underlying curves faithfully could do a good job of representing the range of spectral reflectance functions found among natural surfaces. Lawrence Maloney has shown that three mechanisms with the spectral sensitivities of human cones can in fact do the job well. The spectral sensing capabilities of the human eye therefore seem to be reasonably well-matched to the demands of distinguishing natural surfaces.
Figure 29-10 Spectral sensitivities of three “second-stage” mechanisms that can transform signals from the three classes of cones. A. The spectral sensitivity of the achromatic mechanism ( left ) is formed by adding signals from L and M cones ( right ), and possibly a very small contribution from S cones. The spectral sensitivity curves for the components ( right ) are the same as those shown in Figure 29-7 but are drawn on a linear rather than logarithmic sensitivity axis. B The spectral sensitivity of the red-green mechanism results from the subtraction of M cone signals from L cone signals. Some psychophysical observations suggest that S cones contribute to this mechanism, with the same sign as L cones, although this has not been found in studies of neurons in the lateral geniculate nucleus. C The spectral sensitivity of the yellow-blue mechanism results from the subtraction of L cone and M cone signals from S cone signals. Although the human visual system will not generally confuse light distributions reflected from different natural surfaces, a three-valued representation leaves the system open to confusion by artificial means. We exploit this in color reproduction systems to render a range of colors with only a small number of primary sources. For example, in color television a wide range of colors and lightnesses is synthesized at each point in the image by varying the intensities that excite three phosphors on the surface of the tube: one phosphor that emits long-wavelength light, one that emits middle-wavelength light, and one that emits shortwavelength light (Figure 29-9). Signals From Cones Are Transformed Early in the Visual Pathway Although the three kinds of cones can capture and represent the reflectances of natural surfaces, information would not be conveyed efficiently in a system in which each type of cone was connected to its own distinct neural pathway. This is easy to see if we consider the signals that arise in the L and M cones exposed to the kinds of spectral distributions that characterize the samples of flowers and skin in Figure 29-4. Because the reflectance functions vary slowly across the spectrum, and the spectral sensitivities of the L and M cones are similar over a broad spectral region, these classes of cones will generate highly correlated signals when they absorb light from natural surfaces. The correlation between these signals and the signals from the S cones is lower, but still substantial. The visual pathway could transmit information more efficiently by first removing from the cone signals those parts that are shared. The simplest way to do this is to transmit the differences among signals. The best transformation would be one that yielded, for the kinds of visual stimuli the eye normally encounters, the smallest correlation among signals in three pathways. Given the spectral composition of the light entering the eye, and the spectral sensitivities of the cone photoreceptors, the best transformations are the following: The sum of the signals from the three classes of cones (L+M+S). ● The difference between the signals from L and M cones (L - M). ● The difference between the signal from S cones and some combined signal from the L and M cones (S - LM). Mechanisms that transformed cone signals in these ways would have spectral sensitivities broadly like those shown in Figure 29-10. This result is very important, for it provides evidence for a transformation of cone signals that had long been suspected from perceptual observations and that has more recently been explored in physiological experiments.
There are approximately 6 million cones in our retina, and they are sensitive to a wide range of brightness. The three different types of cones are sensitive to short, medium and long wavelengths, respectively, shown in the figure below. (Additionally, we have approximately 125 million rods on the retina, which are used only in dim light, and are monochromatic – black and white.) This graph shows the sensitivity of the different cones to varying wavelengths. The graph shows how the response varies by wavelength for each kind of receptor For example, the medium cone is more sensitive to pure green wavelengths than to red wavelengths. It is interesting to note that the existence of such receptors was first hypothesized by George Palmer in 1777, and more famously a few decades later by Thomas Young, but not actually discovered until the late 19th century.
Figure 11.10. Distribution of rods and cones in the human retina. Graph illustrates that cones are present at a low density throughout the retina, with a sharp peak in the center of the fovea. Conversely, rods are present at high density throughout most of the retina, with a sharp decline in the fovea. Boxes at top illustrate the appearance of cross sections through the outer segments of the photoreceptors at different eccentricities. The increased density of cones in the fovea is accompanied by a striking reduction in the diameter of their outer segments. Anatomical Distribution of Rods and Cones The distribution of rods and cones across the surface of the retina also has important consequences for vision ( Figure 11.10 ). Despite the fact that perception in typical daytime light levels is dominated by cone-mediated vision, the total number of rods in the human retina (91 million) far exceeds the number of cones (roughly 4.5 million). As a result, the density of rods is much greater than cones throughout most of the retina. However, this relationship changes dramatically in the fovea , a highly specialized region of the central retina that measures about 1.2 millimeters in diameter ( Figure 11.11 ). In the fovea, cone density increases almost 200-fold, reaching, at its center, the highest receptor packing density anywhere in the retina. This high density is achieved by decreasing the diameter of the cone outer segments such that foveal cones resemble rods in their appearance. The increased density of cones in the fovea is accompanied by a sharp decline in the density of rods. In fact, the central 300 µm of the fovea, called the foveola , is totally rod-free. The extremely high density of cone receptors in the fovea, and the one-to- one relationship with bipolar cells and retinal ganglion cells (see earlier), endows this region (and the cone system generally) with the capacity to mediate high visual acuity. As cone density declines with eccentricity and the degree of convergence onto retinal ganglion cells increases, acuity is markedly reduced. Just 6° eccentric to the line of sight, acuity is reduced by 75%, a fact that can be readily appreciated by trying to read the words on any line of this page beyond the word being fixated on. The restriction of highest acuity vision to such a small region of the retina is the main reason humans spend so much time moving their eyes (and heads) around—in effect directing the foveas of the two eyes to objects of interest (see Chapter 20 ). It is also the reason why disorders that affect the functioning of the fovea have such devastating effects on sight (see Box C ). Conversely, the exclusion of rods from the fovea, and their presence in high density away from the fovea, explain why the threshold for detecting a light stimulus is lower outside the region of central vision. It is easier to see a dim object (such as a faint star) by looking away from it, so that the stimulus falls on the region of the retina that is richest in rods (see Figure 11.10 ). Another anatomical feature of the fovea (which literally means “pit”) that contributes to the superior acuity of the cone system is that the layers of cell bodies and processes that overlie the photoreceptors in other areas of the retina are displaced around the fovea, and especially the foveola (see Figure 11.11 ). As a result, light rays are subjected to a minimum of scattering before they strike the photoreceptors. Finally, another potential source of optical distortion that lies in the light path to the receptors—the retinal blood vessels—are diverted away from the foveola. This central region of the fovea is therefore dependent on the underlying choroid and pigment epithelium for oxygenation and metabolic sustenance
THE PHYSIOLOGY OF COLOR VISION: EARLY RESULTS The first cell-level physiological information came 250 years after Newton from the studies of the Swedish-Finnish-Venezuelan physiologist Gunnar Svaetichin, who in 1956 recorded intracellularly in teleost fish from what he thought were cones but turned out later to be horizontal cells. These cells responded with slow potentials only (no action potentials) when light was directed on the retina. He found three types of cells, as illustrated on the next page: the first, which he called L cells, were hyperpolarized by light stimulation regardless of the light's wavelength composition; the second, called r-g cells, were hyperpolarized by short wavelengths, with a maximum response to green light, and depolarized by long wavelengths, with a maximum response to red; the third, which with Hering in mind he called y-b cells, responded like r-g cells but with maximal hyperpolarization to blue and maximal depolarization to yellow. For r-g and y-b cells, white light gave only weak and transient responses, as would be expected from white's broad spectral energy content. Moreover, for both types of cell, which we can call opponent-color cells , some intermediate wavelength of light, the crossover point , failed to evoke a response. Because these cells react to colored light but not to white light, they are probably concerned with the sensation of color.
In 1958, Russell De Valois (rhymes with hoi polloi ) and his colleagues recorded responses strikingly similar to Svaetichin's from cells in the lateral geniculate body of macaque monkeys. De Valois had previously shown by behavioral testing that color vision in macaque monkeys is almost identical to color vision in humans; for example, the amounts of two colored lights that have to be combined to match a third light are almost identical in the two species. It is therefore likely that macaques and humans have similar machinery in the early stages of their visual pathways, and we are probably justified in comparing human color psychophysics with macaque physiology. De Valois found many geniculate cells that were activated by diffuse monochromatic light at wavelengths ranging from one end of the spectrum to a crossover point, where there was no response, and were suppressed by light over a second range of wavelengths from the crossover point to the other end. Again the analogy to Hering's color processes was compelling: De Valois tound op-ponent-color cells of two types, red-green and yellow-blue; for each type, combining two lights whose wavelengths were on opposite sides of some crossover point led to mutual cancellation of responses, just as, perceptually, adding blue to yellow or adding green to red produced white. De Valois' results were especially reminiscent of Hering's formulations in that his two classes of color cells had response maxima and crossover points in just the appropriate places along the spectrum for one group to be judging the yellow-blueness of the light and the other, red-greenness. The lateral geniculate body of the monkey, we recall from Chapter 4, consists of six layers, the upper four heavily populated with small cells and the lower two sparsely populated with large cells. We find cells of the type just described in the upper, or parvocellular, layers. Type 1 cells differ one from the next in the types of cone that feed the center and surround systems and in the nature of the center, whether it is excitatory or inhibitory. We can designate the example in the diagram on page 20 as "r+g-". Of the possible subtypes of cells that receive input from these two cone types, we find all four: r+g-, r-g+, g+r-, g-r+. A second group of cells receives input from the blue cone, supplying the center, and from a combination of red and green cones (or perhaps just the green cone), supplying the surround. We call these "blue-yellow", with "yellow" a shorthand way of saying "red-plus-green". We find two other types of cells in the four dorsal layers. Type 2 cells make up about 10 percent of the population and have receptive fields consisting of a center only. Throughout this center, we find red-green opponency in some gives little or no response, because one effect cancels the other—the reverse of what would seem to be required for color contrast. What we can say of type i cells is that they are likely to play an important part in high-precision form perception, given their tiny field centers and their responsiveness to black-and-white contours. As we saw in Chapter 6, we have several ways to measure visual acuity, the ability of our visual system to discriminate small objects; these include the smallest separation between two dots that can just be discriminated and the smallest detectable gap in a circle (called the Landolt C). Acuity measured in either of these ways turns out, for the fovea, to be about 0.5 minute of arc, or about i millimeter at a distance of 8 meters. This corresponds well with the distance between two cones in the fovea. Type 1 geniculate cells that get their input from near the fovea have receptive-field centers as small as about 2 minutes of arc in diameter. It seems likely that in the fovea one cone only contributes to a field center. So we find a reasonable fit between acuity and smallest field-center sizes of lateral geniculate cells. The ventral pair of geniculate layers differs from the dorsal four in being made up entirely of cells whose field centers are broad-band. The cells do show a curious form of color opponency that no one understands and that I will say no more about. Most people assume that these cells are color-blind. Their field centers are several times larger than centers of parvocellular cells, and they differ in several other interesting ways. We presently suspect that these cells feed into parts of the brain that subserve depth and movement perception. To elaborate further would take us far from color and require another book. Most of the cells I have been describing for the lateral geniculate have also been observed in the retina. They are more conveniently segregated in the geniculate and are easier to study there. We do not know what the geniculate contributes to the analysis of visual information in the monkey, besides its obvious function of handing on to the cortex the information it receives from the eyes.
The next step was to look at the receptive fields of these cells by using small spots of colored light, as Torsten Wiesel and I did in 1966, instead of diffuse light. For most of De Valois' opponent-color cells, the receptive fields had a surprising organization, one that still puzzles us. The cells, like Kufflcr's in the cat, had fields divided into antagonistic centers and surrounds; the center could be "on" or "off". In a typical example, the field center is fed exclusively by red cones and the inhibitory surround exclusively by green cones. Consequently, with red light both a small spot and a large spot give brisk responses, because the center is selectively sensitive to long-wavelength light and the surround virtually insensitive; with short-wavelength light, small spots give little or no response and large spots produce strong inhibition with off responses. With white light, containing short and long wavelengths, small spots evoke on responses and large spots produce no response Although our first impression was that such a cell must be getting input from red cones in the center region and green cones in the surround, it now seems probable that the total receptive field is a combination of two overlapping processes, as illustrated in the figure on the next page. Both the red cones and the green cones feed in from a fairly wide circular area, in numbers that are maximal in the center and fall off with distance from the center. In the center, the red cones strongly predominate, and with distance their effects fall off much more rapidly than those of the green cones. A long-wavelength small spot shining in the center will consequently be a very powerful stimulus to the red system; even if it also stimulates green cones, the number, relative to the total number of green cones feeding in, will be too small to give the red system any competition. different-shaped sensitivity-versus-position curves. These graphs plot the sensitivity of a cell (measured, for example, by the response to a constant very small spot of light) against retinal position along a line AA' passing through the receptive-field center. For an r+ center-g- surround cell, a small red spot gives a narrow curve and a small green spot, a much broader one. The lower graph plots the responses to light such as white or yellow that stimulates both of the opponent systems, so that the two systems subtract. Thus the red cones dominate in the center, which gives on responses, whereas the green cones dominate in the surround, which yields off responses. Although our first impression was that such a cell must be getting input from red cones in the center region and green cones in the surround, it now seems probable that the total receptive field is a combination of two overlapping processes, as illustrated in the figure on the next page. Both the red cones and the green cones feed in from a fairly wide circular area, in numbers that are maximal in the center and fall off with distance from the center. In the center, the red cones strongly predominate, and with distance their effects fall off much more rapidly than those of the green cones. A long-wavelength small spot shining in the center will consequently be a very powerful stimulus to the red system; even if it also stimulates green cones, the number, relative to the total number of green cones feeding in, will be too small to give the red system any competition. different-shaped sensitivity-versus-position curves. The same argument applies to the center-surround cells described in Chapter 3, whose receptive fields similarly must consist of two opponent circular overlapping areas having Thus the surround is probably not annular, or donut shaped, as was originally supposed, but filled. With these opponent-color cells in monkeys, it is supposed—without evidence so far—that the surrounds represent the contributions of horizontal cells. The responses to diffuse light—in this case, on to red, off to blue or green, and no response to white—make it clear that such a cell must be registering information about color. But the responses to appropriate white borders and the lack of response to diffuse light make it clear that the cell is also concerned with black-and-white shapes. We call these center-surround color-opponent cells "type 1".
A third problem arises when one compares the excitation and inhibition these cells receive from the opposing cone mechanisms. Only a fraction are actually inhibited by red and excited by green light or the converse. Many are excited more by yellow or white light than other colors, which is not really a Hering red-green channel. There is additional complexity to the L- and M- tonic cone system. It is generally agreed that these cells comprise the midget ganglion cells of the fovea. These retinal ganglion cells receive a direct input from a midget bipolar cell, which receives its input from a single L- or M-cone. The cone antagonism is thought to come indirectly through horizontal and amacrine cells (Fig. 19). There is evidence that the cone antagonism mediated by horizontal cells comes from both L- and M-cones (Dacey, 1996), which is also inconsistent with a Hering red-green opponent channel. A rival view discounts any role of midget ganglion cells in color vision (Rodieck, 1998; Dacey, 1996). This hypothesis rests on evidence of the existence of a small number of geniculate cells that have coextensive receptive fields with L-cones exciting and M-cones inhibiting or the converse (Wiesel & Hubel, 1966). This result has been difficult to confirm. These cells lack the geometry problem mentioned previously because the red-green opponency does not vary with stimulus size. Coextensive L- and M-cone opponent cells have also been reported to be in the intercalated layers (koniocellular layers) of the geniculate and to project to the areas of visual cortex where double opponent color cells are located (see later figures 25, 26 and 27). These results also need confirmation. Some support for this hypothesis comes from recordings in the peripheral retina of midget-like ganglion cells, where L- and M- cones are synergistic rather than antagonistic (Dacey and Lee, 1997). This result has been taken to imply that the midget system plays no role in color vision. Another interpretation is that the antagonistic organization of midget ganglion cells is lost outside the fovea because peripheral 'midgets' are not truly midget ganglion cells at all: they receive more than one midget bipolar input and multiple cone inputs (Kolb et al., 1998). So trivariance, may be lost in the peripheral retina. I believe that all L- and M- tonic cells contribute to color vision but they are not the red-green opponent channels of Hering. I suggest that the antagonism these cells show between L-and M- cone mechanisms is a spectral filter, narrowing the spectral band to which they respond best. This resembles oil droplets located in the cones of certain diurnal vertebrates like birds, reptiles (Fig. 20) and fishes. Oil droplets narrow the action spectrum of the cones, increasing color contrast. Long wave cones become longer wave selective; middle wavelength cones become more middle wavelength selective. This phenomenon makes the monochrome retinex image even more monochrome.
Some cells excited by blue and inhibited by yellow light or the converse were considered to be Hering's blue-yellow channel. This view is also being challenged nowadays. The first problem is that most of these cells are excited by light stimulation of short wave cones, either as blue or white light. The Hering blue-yellow channel should not be responsive to white light. The excitation these cells receive from L- and M- off bipolars contributes to successive contrast but exerts little inhibition on the short wave cone signals. A second problem is their polarity. There are many more excited than inhibited by short wave cones. Malpeli and Schiller (1978) and Gouras and Zrenner (1981) have concluded that retinal and geniculate cells inhibited by short wave cones do not exist. This view is contested by Lee et al. (1987) who have tried carefully to detect cells inhibited by short wave cones. This is not an easy task because cells in the tonic L-and M-cone system can be inhibited by blue and excited by yellow light. In order to eliminate this possibility, Lee et al. (1987) used stimuli, which changed along a tritanopic axis of color space, to which only short wave cones respond. They found cells inhibited by this stimulus. However, macular pigments or other factors could cause their stimuli to miss the tritanopic axis of primate color space thus weakening their conclusion. Anatomy has revealed that the short wave cone excitatory signal uses a unique bistratified retinal ganglion cell organized to be excited by short wave cones absorbing light and excited by off-responses of longer wave cones (Fig. 21); the converse has not been found. The three dimensional structure of the short wave cone synaptic pedicle reveals a synaptic organization that resembles rod spherules more than longer wave cone pedicles (see chapter on S-cone pathways). The S-cone bipolar dendrites have contacts with S-cones resembling those of on-bipolars of rods. The existence of short wave cone specific off-bipolars is therefore questionable (Kolb et al , 1997). Electroretinography also suggests that in contrast to the L- and M-cones, there is no evidence of a short wave cone off-bipolar response (Evers & Gouras, 1986). The short wave on-channel in primate retina is briefly inhibited when a long wave field is turned off, making a blue flash transiently disappear to an observer. This phenomenon was discovered psychophysically by Stiles (1949) and confirmed by Mollon and Polden (1977). This phenomenon is also seen in retinal ganglion cells mediating the excitatory signal of short wave cones (Gouras, 1968), providing a unique psychological marker for the human short wave cone system. A yellow flash does not disappear when a blue adapting field is turned off, which might be expected if there were symmetrical short wave inhibitory-long wave excitory cells. This too supports the absence of a short wave cone off-channel. Short wave cones have little impact on brightness but have a strong influence on color. If there were short wave cone off-bipolars, they should be logically related to signaling darkness. This would conflict with the L- and M-cones, which signal darkness when their off-bipolar system goes off. In the presence of yellow light the short wave cone off-bipolars would go off when the long wave cone on-bipolars go on. On this reasoning short wave cone off- channels are inappropriate
12. Hering White-Black Channel in the Retina Although these sensations are opposite in nature, they are not opponent as blue and yellow or red and green colors are. The intermediary sensation of gray is a mixture of black and white. The reason for this is that no antagonism occurs between cone mechanisms for the establishment of white and black. These sensations depend on antagonism in space but not among cones. It is not a wavelength but an energy comparison. White or gray depends on all cone mechanisms absorbing light and for pure white or gray this absorption rate must be relatively equal. If the short wave channel is not active, the whites and grays become yellowish, greenish or reddish. The early recordings of single retinal and geniculate neurons in monkeys revealed a subset of cells that were either excited or inhibited by all wavelengths. These were considered to represent the white and black channels of Hering. At that time, there was no distinction between tonic (parvo) and phasic (magno) systems. The idea that these cells reflect the perception of white and black is incorrect because they respond to all colors, not just white or black. The perception of white and black occurs in the visual cortex, where simultaneous contrast occurs. I suggest that pure white occurs when the normalized images of the three cone on-systems are equal for the object. Pure black occurs when the normalized L-and M-cone off -systems are equally excited and the short wave cone on-system is silent in the representation of the object in the cortex. Retinal Interneurons The horizontal and amacrine cells represent laterally interacting elements in the retina. In general they are inhibitory (antagonistic) in their neural interactions. There are exceptions, notably the rod amacrine cell, which transmits rod signals to bipolars and ganglion cells (see chapter on circuitry for rod signals). Among primate horizontal cells there are at least two major classes. One class receives its input overwhelmingly from L- and M-cones. A second class receives its input from all three cones but much more from short wave ones (Fig. 22) (Ahnelt and Kolb, 1994; Dacey, 1996). It is thought that horizontal cells feedback antagonistically on cones. The specificity of the feedback is not clearly defined. It is possible that the horizontal cells receiving inputs from short wave cones only exert feedback on to short wave cones, even though they receive inputs from L- and M-cones. I favor this hypothesis because one does not see any input from short wave cones in ganglion cells receiving inputs from L- and M-cones. If the horizontal cells receiving inputs from short wave cones were to feedback on to L- and M-cones, short wave cone inputs would be found in all retinal ganglion cells, which is not the case What is the role of horizontal cells? It would seem that the negative feedback they exert on the cones is to control overdriving of the cones by large energy gradients in both space and time. Over-stimulation of the cones would be curtailed and response speed increased. Spatial contrast could also be facilitated (Ratliff, 1960). The horizontal cell feedback is only brought into action by strong stimuli that affect large groups of neighboring cones. This could also enhance spectral contrast. The depolarization that yellow light would exert on S-cones through horizontal cells could enhance any subsequent hyperpolarization produced by short wave light. This would augment responses to short wave light on long wave backgrounds and facilitate successive color contrast.
The amacrine cells are less understood than horizontal cells. It is reasonable to assume that most transmit antagonistic interactions to bipolar and ganglion cells. The amacrine cell interaction occurs after the on- and off- systems of bipolar cells are established. This allows separate channels of antagonism to be mediated by on- and off- amacrine cells. Their role would be similar to horizontal cells but at the inner plexiform layer (Fig. 23). Another role of the amacrine cell system is to help establish the functional differences in the tonic and phasic ganglion cell systems. The complete circuitry of these two systems is not known. It is likely that the phasic system has separate on- and off- bipolars that transmit signals from cones to the ganglion cell layer (Fig.13) because midget cone bipolars synapse only on midget ganglion cells and not on other ganglion cells (Kolb, 1994; Boycott and Wassle,1999). Therefore, another system of L- and M-cone bipolars, presumably diffuse cone bipolar types, (see chapter on cone pathways through the retina) must transmit cone signals to phasic ganglion cells. It would be at these bipolars and/or ganglion cells that amacrine cells establish the phasicity of the phasic ganglion cells (Werblin, 1991; Slaughter et al., 1995; Cook and McReynolds, 1998). L- and M-cone signals reach these ganglion cells faster than they reach the tonic ganglion cells (Gouras, 1968), which also suggests a separate bipolar system.
. The ganglion cells add and subtract signals from many cones. For example, by comparing the response of the middle-wavelength and long-wavelength cones, a ganglion cell determines the amount of green-or-red. Moreover, they are excited in the middle of the field, and inhibited in the surrounding field, which makes them particularly sensitive to edges.
Transmission of Color Signals by the Ganglion Cells A single ganglion cell may be stimulated by several cones or by only a few. When all three types of cones— the red, blue, and green types—stimulate the same ganglion cell, the signal transmitted through the ganglion cell is the same for any color of the spectrum. Therefore, the signal from the ganglion cell plays no role in the detection of different colors. Instead, it is a “white” signal. Conversely, some of the ganglion cells are excited by only one color type of cone but inhibited by a second type. For instance, this frequently occurs for the red and green cones, with red causing excitation and green causing inhibition, or vice versa. The same type of reciprocal effect occurs between blue cones on the one hand and a combination of red and green cones (both of which are excited by yellow) on the other hand, giving a reciprocal excitation-inhibition relation between the blue and yellow colors. The mechanism of this opposing effect of colors is the following: One color type of cone excites the ganglion cell by the direct excitatory route through a depolarizing bipolar cell, whereas the other color type inhibits the ganglion cell by the indirect inhibitory route through a hyperpolarizing bipolar cell. The importance of these color-contrast mechanisms is that they represent a means by which the retina itself begins to differentiate colors. Thus, each color-contrast type of ganglion cell is excited by one color but inhibited by the “opponent” color. Therefore, color analysis begins in the retina and is not entirely a function of the brain. Figure 29-11 The receptive fields of primate retinal ganglion cells have two concentrically organized regions, a center and an antagonistic surround. This fundamental organization is expressed in two basic forms: In an on-center cell, light falling on the center excites the cell while light falling on the surround inhibits it. In an off-center cell, light falling on the center inhibits the cell while light falling on the surround excites it. Different types of ganglion cells are distinguished by the sizes of their receptive fields and by the ways in which their centers and surrounds integrate signals from the different classes of cones. A M cells constitute about 8% of all ganglion cells. Even the smallest center receives inputs from several cones. The spectral sensitivities of center and surround differ little, if at all. B P cells constitute about 80% of all ganglion cells. Two subtypes are defined by the organization of cone inputs. The “red-green” opponent type receives inputs only from L and M cones, whereas the “yellow-blue” type receives input from all three classes of cones. Within the red-green class different connections to cones give rise to multiple cell subtypes: on- or off-center cells, and centers with L or M cone inputs. The cone inputs to the surround are less firmly established, but are generally thought to arise from the class that does not feed the center. In cells in and near the fovea the center of the receptive field receives input from a single cone; in more peripheral regions of retina several cones provide input to the center. Less is known about the structure of the receptive fields of the blue-yellow type of P cell. The antagonistic mechanisms seem to overlap more, possibly because chromatic aberration defocuses short-wavelength light, and center and surround are harder to distinguish. Cells in which S cones contribute the “off” signal are rare. The first electrophysiological evidence for opponent mechanisms came from recordings made from horizontal cells in the fish retina. These cells become hyperpolarized in response to lights of certain wavelengths and are depolarized in response to lights of other wavelengths. Recordings in the primate retina by Dennis Dacey and colleagues show that the horizontal cells behave differently, giving responses of the same polarity to lights of all wavelengths. Opponent inputs are clearly evident in extracellular recordings made from primate ganglion cells by Peter Gouras and from lateral geniculate nucleus cells by Russell DeValois and colleagues and by Wiesel and Hubel. The properties of neurons in the lateral geniculate nucleus apparently reflect those of ganglion cells, which in turn probably reflect transformations of cone signals occurring at an earlier stage in the retina. Anatomical considerations suggest these happen in bipolar cells, though this has not yet been established physiologically. How do ganglion cells convey the red-green, blue-yellow, and achromatic dimensions of variation in the image? There are several kinds of retinal ganglion cells that differ in their anatomical and physiological characteristics. As we have seen in Chapter 26, there are two major classes of ganglion cells, now most often called M cells and P cells for their separate projections to the magnocellular (large-cell) and parvocellular (small-cell) layers of the lateral geniculate nucleus. These account for about 90% of all ganglion cells. Table 29-1 summarizes some of their properties, and Figure 29-11 shows schematically the organization of receptive fields. Modern physiological recordings from ganglion cells, and from the neurons to which they project in the lateral geniculate nucleus, have firmly established the chromatic properties of both M and P cells. The receptive fields of M cells have a simple antagonistic center-surround organization. Some cells have on-center receptive fields, others off-center receptive fields, but in both types the center and surround have similar, broad spectral sensitivities. Information about color is carried almost exclusively in the P cell system. P cells fall into two subtypes: neurons that receive opposed signals from L and M cones and neurons that receive signals from S cones opposed to some combined signal from L and M cones. These two subtypes of P cells are well suited to provide the red-green and blueyellow channels postulated by Hering, while M cells appear well equipped to convey the achromatic/ brightness signals. However, this scheme looks less satisfactory when we consider how the different kinds of neurons deal with the spatial structure of the image. Most of the information about the detailed structure of the visual world is conveyed by variations of brightness in the image rather than by variations in color (see Figure 29-1). We might therefore expect much of the visual system's capacity to be devoted to analyzing the brightness variations rather than the color variations. Perceptual experiments confirm this expectation: our capacity to resolve fine spatial variations in brightness exceeds our capacity to resolve spatial variations in hue. Since we know how M cells and P cells are distributed on the retina, we can calculate what kind of image detail each class of cell is capable of conveying. M cells are arranged much too sparsely to account for our capacity to resolve detail. They are important in the analysis of image movement (see Chapter 28), but they cannot convey information about detailed spatial variations in brightness. P cells, on the other hand, are very densely distributed—in and around the fovea there are two P cells for every cone— and could easily represent the detail that we can resolve in an image. The problem is that P cells appear superficially to be better suited to conveying information about color than to conveying information about the lightness variations that define structure. In fact, however, the spatial organization of the P cell's receptive field allows the cell to convey both brightness and color information in a complex signal. When the light falling on a P cell's receptive field covers both center and surround, the cell will respond well to variations in color, being excited by some hues and inhibited by others. However, when the light is either very small and confined to the center or distributed over the whole receptive field in a way that does not disturb the average light level on the surround (for example a fine grating pattern), only the central part of the receptive field generates a signal. Because this signal arises from a single type of cone, the cell responds to light over a broad range of wavelengths—it loses its color opponency. Thus a P cell responds well to brightness variations in the fine structure of the image, and it responds well to color variations in the coarse structure of the image. Not all P cells contribute to this encoding of spatial variations in lightness. The cornea and lens of the eye, when imaging a surface, cannot focus light of all wavelengths in the same plane in the retina. This chromatic aberration prevents all wavelengths from being in focus at the same time, so the visual system opts for a sharp image at middle and long wavelengths at the expense of a blurred image at short wavelengths. The S cones constitute less than 10% of the total (they are actually entirely absent from the center of the fovea). The ganglion cells that receive their inputs probably constitute a similar fraction of P cells and are sparsely distributed on the retina. P cells that receive inputs from only L and M cones seem to be the ones that can carry both a color-opponent signal and a brightness signal. These signals are conveyed through the ongoing discharge of action potentials and, as far as we know, are confounded in the discharge of a single cell. That is, just as individual cones confuse variations in wavelength and intensity, so too do individual P cells. The ambiguity in the discharge of any one P cell must be resolved by mechanisms in the cortex. The Role of Phasic Ganglion Cells The first recordings from cells in the magno-cellular layers of the lateral geniculate of monkeys were by Wiesel and Hubel (1966). The sample of cells they encountered in these layers was relatively small. They described cells that were tonically inhibited by red light, a phenomenon not found in their more extensive sampling of the parvo-cellular layers. Two different classes of ganglion cells occur next to each other in monkey retina, one phasic, the other tonic (Gouras, 1968; DeMonasterio and Gouras, 1975). These differences are striking in the retina where these two different types of cells can be recorded from simultaneously. Antidromic driving showed that phasic cells have faster conduction velocities than tonic ones and therefore were presumably larger cells, suggesting a link with the magno- and parvo-cellular layers of the geniculate, respectively. The antidromic field potential of these two cell groups revealed that the tonic cell system was concentrated around the fovea while the phasic system was evident perifoveally and peripherally (Gouras, 1969). It is difficult to know what visual sensation the phasic system mediates. It has been suggested that it is responsible for luminance (Lee et al., 1990). Luminance is an additive quality, which has an action spectrum reflecting the combined L-and M- cone systems but not short wave cones. It has also been suggested that the phasic system detects movement. One of the reasons for this hypothesis is that the phasic ganglion cell system projects to the magno-cellular layers of the lateral geniculate nucleus, which in turn projects through striate cortex to a visual area MT, where cells sensitive to movement and the direction of movement seem to be found. This idea is not completely accepted. It is also possible that the phasic system mediates the signal for the optokinetic reflex, responding to very slow retinal movements (unpublished observations). The phasic system is not involved in color vision because it synergistically mixes the signals of L- and M-cones, which is not what one expects from a system involved in color vision. It is possible that the signal of the phasic system is used for blue-yellow contrast. However, I doubt this hypothesis because 1) the retinal distribution of the phasic ganglion cells is not in register with that of the tonic system and 2) their latencies and conduction velocities are out of phase with those of the tonic system. Why should one visual pathway be phasic and the other tonic? This is an intriguing question that awaits more research. It has been suggested that the foveally oriented tonic pathway plays a more dominant role in conscious perception in which tonic responses may be an advantage (Martinez-Conde et al., 1999).
The Lateral Geniculate Nucleus The lateral geniculate nucleus (see Fig. 3) forms the main stream of visual information to the cerebral cortex. It is a transfer center that disentangles the various retinal subsystems serving the contralateral visual fields and organizes their projections to striate cortex. The tonic system, carrying cone specific channels for both high visual resolution and color vision, is confined to the parvo-cellular layers (Fig. 25). The phasic system is confined to the magno-cellular layers (Fig. 25). The signals from each eye are kept separate in order to combine them appropriately for stereoscopic vision, where different combinations reflect different depth planes. Similarly on-cells are separated from off-cells and cone specific responses are kept separate for color vision. There are non-retinal inputs to the lateral geniculate nucleus that must modulate the flow of information but they are poorly understood. They may play a role in attention and sleep.
Figure 28-1 Organization of V1 and V2. A. Subregions in V1 (area 17) and V2 (area 18). This section from the occipital lobe of a squirrel monkey at the border of areas 17 and 18 was reacted with cytochrome oxidase. The cytochrome oxidase stains the blobs in V1 and the thick and thin stripes in V2. (Courtesy of M. Livingstone.) B. Connections between V1 and V2. The blobs in V1 connect primarily to the thin stripes in V2, while the interblobs in V1 connect to interstripes in V2. Layer 4B projects to the thick stripes in V2 and to the middle temporal area ( MT ). Both thin and interstripes project to V4. Thick stripes in V2 also project to MT. The Parvocellular and Magnocellular Pathways Feed Into Two Processing Pathways in Extrastriate Cortex In Chapter 27 we saw that the parallel parvocellular and magnocellular pathways remain segregated even in the striate cortex. What happens to these P and M pathways beyond the striate cortex? Early research on these pathways indicated that the P pathway continues in the ventral cortical pathway that extends to the inferior temporal cortex, and that the M pathway becomes the dorsal pathway that extends to the posterior parietal cortex. However, the actual relationships are probably not so exclusive. The evidence for separation of function of the dorsal and ventral pathways begins in the primary visual, or striate, cortex (V1). Staining for the mitochondrial enzyme cytochrome oxidase reveals a precise and repeating pattern of dark, peg-like regions about 0.2 mm in diameter called blobs. The blobs are especially prominent in the superficial layers 2 and 3, where they are separated by intervening regions that stain lighter, the interblob regions. The same stain also reveals alternating thick and thin stripes separated by interstripes of little activity (Figure 28-1 in the secondary visual cortex, or V2).
Color Vision in Visual Cortex The cerebral cortex mediates conscious perception. In striate cortex there are local zones called blobs (Fig. 27) that contain cells that exhibit double-opponent behavior (Michael, 1977; Livingstone and Hubel, 1988). We assume double-opponency is an essential stage in color vision. Double-opponency is not introduced at an earlier stage because a commitment to color contrast cannot be made until the achromatic information is extracted from the tonic L- and M-cone input channels Achromatic and chromatic information is considered to be multiplexed in the tonic L- and M-cone system, which is demultiplexed before chromatic contrast is established. By demultiplexing is meant that chromatic information is transmitted to different neural circuits than those for achromatic information (Fig. 27). The L-and M-cone on- and off-channels are used synergistically for achromatic contrast detectors. These same channels are used antagonistically for chromatic contrast detectors. Achromatic contrast involves larger populations of neurons located outside the smaller blob areas (Fig. 27, achromatic and oriented). There is no multiplexing for the short wave channel because it is totally committed to color. Thus this channel goes directly from LGN to the blobs (Fig. 27). Double-opponency involving the short wave cone system also depends on the demultiplexing of the longer wave cone system's signal before a comparison is made for chromatic contrast. We assume that chromatic contrast begins with double-opponent cells (Fig. 11). Double-opponency establishes wavelength contrast independently of brightness contrast. These two forms of contrast become independent neural entities in establishing borders of contrast. Orientation selectivity, undoubtedly essential for form vision, could be based on either or both of these forms of contrast. The greater spatial resolution of achromatic contrast appears to involve more orientation selective cells in visual cortex than color contrast does.
Color Vision beyond Striate Cortex Knowledge of the physiology of color vision beyond striate cortex is sketchy because of the difficulty in exciting cortical cells in anesthetized monkeys. Post striate visual cortex is composed of a number of separate areas. One area, called MT, appears to receive its major input from the magno-system. Several other areas, called visual areas 2, 3 and 4 receive their input from the parvo-system. The role of these different areas is unclear (Schiller and Lee, 1991). Color selective cells have been found in areas 1, 2, 3 and 4 (Kruger and Gouras, 1979), although Zeki (1993) has maintained that they are much more numerous in visual area 4 (V4). Using three projectors to control the spectral reflectance of objects in a Mondrian-like display, Zeki (1993) reported a major difference between striate cortex and visual area 4. Spectrally selective cells in striate cortex of an anesthetized monkey responded to the energies reflected from the objects and not to their color. In other words, objects with different colors but reflecting identical energies from their surface evoked the same response when presented to such neurons. On the other hand, spectrally selective cells in area V4 responded to the colors and not to the energies. This implies that color is not established in striate cortex but at a later stage in vision. Zeki has raised the interesting hypothesis that V4 is the visual center for color and is not represented in a retinotopic but in a chromatic coordinate system. An object's shape would be defined in area V1 (striate cortex) and perhaps V2 where the anatomy reflects a retinotopic plan, and its color would be defined in V4 following a chromatic plan. In V4 colors would be distributed in an orderly way over the structure somewhat like a chromaticity diagram (Fig. 27). This is a radical view of cortical processing that needs more research. A problem with this hypothesis is how a neural response that represents an object in one cortical area can be linked with its color response in another area. Color is complex depending not only on hue, defined by the chromaticity diagram but also by achromatic cues such as shadowing and texture. Another view is that chromatic contrast detectors are ubiquitous in all visual areas, providing parallel cues to borders with achromatic contrast detectors. The remapping of visual space, occurring in these multiple visual areas may increase the universe of forms and objects distinguishable (Fig. 28). The Commision Internationale d'Elairage (CIE) chromaticity diagram (Figure 27) defines human trivariant color experience in a quantitative way, which allows standards for color comparisons worldwide. It is defined by three spectral variables, which can be combined to mimic any color. The values of the three standards have been normalized so that they always add up to 1.0. In this way the color diagram can be plotted in two dimensions, those of the long (red) and middle (green) wave standards. What does not equal 1.0 on the diagram represents the short wave standard. In the middle of the diagram, where the three standards are all 0.33, the color is white (gray or black). Moving up the diagram makes the color green, right makes the color red and down makes it blue. The value 1.0 can never be reached because the absorption spectra of the three cone opsins overlap so much that the standards stimulate more than one cone mechanism. Therefore, all colors are to some extent desaturated. Perhaps if one could find a way to stimulate only one class of cones, more saturated colors might be perceived. Normal humans can perceive about a million different colors but this number depends on the right conditions. The illumination must be bright and the size of the color stimulus must be large, at least 20 degrees of visual angle to appreciate such a large universe of colors. Why very large stimuli create a much greater palette of colors must depend on spatial summation in visual cortex (Figure 28). Color and Form One of the most impressive facts about the physiology of visual cortex is the relatively small proportion of cells that have any striking wavelength selectivity. This is in marked contrast to the retino-geniculate pathway where many cells show wavelength selectivity. This suggests that much of the neural machinery in visual cortex is used for pattern recognition rather than color vision, and that wavelength selectivity plays only a minor role in the response repertoire of cortical visual neurons. Evidently the processing of a black and white (achromatic) image requires almost as much neural power as the processing of a color image: perhaps like a color television, where much more information is transmitted for the pattern than for the color of the image. Just where color enters into pattern recognition will require a better understanding of the latter. It would seem that objects are identified by connected groups of orientation selective neurons having appropriate contrasts (Marr, 1982) and these objects are reinforced by their structural stability with movement in space. In this, light, dark and shading have considerable impact on contour stability and structure as evidenced by the pattern recognition possible in black and white photographs. Color adds an important but minor frill to this complex neural construct but because of its limited dimensionality (only two or three dimensions), it has become an alluring femme fatale to many of us.
Figure 28-2 The magnocellular (M) and parvocellular (P) pathways from the retina project through the lateral geniculate nucleus (LGN) to V1. Separate pathways to the temporal and parietal cortices course through the extrastriate cortex beginning in V2. The connections shown in the figure are based on established anatomical connections, but only selected connections are shown and many cortical areas are omitted (compare Figure 25- 9). Note the cross connections between the two pathways in several cortical areas. The parietal pathway receives input from the M pathway but only the temporal pathway receives input from both the M and P pathways. (Abbreviations: AIT = anterior inferior temporal area; CIT = central inferior temporal area; LIP = lateral intraparietal area; Magno = magnocellular layers of the lateral geniculate nucleus; MST = medial superior temporal area; MT = middle temporal area; Parvo = parvocellular layers of the lateral geniculate nucleus; PIT = posterior inferior temporal area; VIP = ventral intraparietal area.) (Based on Merigan and Maunsell 1993.) Margaret Livingstone and David Hubel identified the anatomical connections between labeled regions in V1 and V2 (Figure 28-1B). They found that the P and M pathways remain partially segregated through V2. The M pathway projects from the magnocellular layers of the lateral geniculate nucleus to the striate cortex, first to layer 4Cα and then to layer 4B. Cells in layer 4B project directly to the middle temporal area (MT) and also to the thick stripes in V2, from which cells also project to MT. Thus, a clear anatomical pathway exists from the magnocellular layers in the lateral geniculate nucleus to MT and from there to the posterior parietal cortex (Figure 28-2). Cells in the parvocellular layers of the lateral geniculate nucleus project to layer 4Cβ in the striate cortex, from which cells project to the blobs and interblobs of V1. The blobs send a strong projection to the thin stripes in V2, whereas interblobs send a strong projection to the interstripes in V2. The thin stripe and interstripe areas of V2 may in turn project to discrete subregions of V4, thus maintaining this separation in the P pathway into V4 and possibly on into the inferior temporal cortex. A pathway from the P cells in the lateral geniculate nucleus to the inferior temporal cortex can therefore also be identified (Figure 28-2). But are these pathways exclusive of each other? Several anatomical observations suggest that they are not. In V1 both the magnocellular and parvocellular pathways have inputs in the blobs, and local neurons make extensive connections between the blob and interblob compartments. In V2 cross connections exist between the stripe compartments. Thus, the separation is not absolute, but whether there is an intermixing of the M and P contributions or whether the cross connections allow one cortical pathway to modulate activity in the other is not clear. Results of experiments that selectively inactivate the P and M pathways as they pass through the lateral geniculate nucleus (described in Chapter 27) also erode the notion of strict segregation between the pathways in V1. Blocking of either pathway affects the responses of fewer than half the neurons in V1, which indicates that most V1 neurons receive physiologically effective inputs from both pathways. Further work has shown that the responses of neurons both within and outside of the blobs in the superficial layers of V1 are altered by blocking only the M pathway. Both observations suggest that there is incomplete segregation of the M and P pathways in V1. This selective blocking of the P and M pathways also reveals the relative contributions of the pathways to the parietal and inferior temporal cortices. Blocking the magnocellular layers of the lateral geniculate nucleus eliminates the responses of many cells in MT and always reduces the responses of the remaining cells; blocking the parvocellular layers produces a much weaker effect on cells in MT. In contrast, blocking the activity of either the parvocellular or magnocellular layers in the lateral geniculate nucleus reduces the activity of neurons in V4. Thus, the dorsal pathway to MT seems primarily to include input from the M pathway, whereas the ventral pathway to the inferior temporal cortex appears to include input from both the M and P pathways. We can now see that there is substantial segregation of the P and M pathways up to V1, probably separation into V2, a likely predominance of the M input to the dorsal pathway to MT and the parietal cortex, and a mixture of P and M input into the pathway leading to the inferior temporal lobe (as indicated by the lines crossing between the pathways in Figure 28-2). What should we conclude about the organization of visual processing throughout the multiple areas of the visual cortex? First, we know that there are specific serial pathways through the multiple visual areas, not just a random assortment of equally connected areas. There is substantial evidence for two major processing pathways, a dorsal one to the posterior parietal cortex and a ventral one to the inferior temporal cortex, but other pathways may also exist. Second, there is strong evidence that the processing in these two cortical pathways is hierarchical. Each level has strong projections to the next level (and projections back), and the type of visual processing changes systematically from one level to the next. Third, the functions of cortical areas in the two cortical pathways are strikingly different, as judged both by the anatomical connections and the cellular activity considered in this chapter and by the behavioral and brain imaging evidence discussed in Chapter 25. Our examination of the functional organization within these vast regions of extrastriate visual cortex begins with the dorsal cortical pathway and the most intensively studied visual attribute, motion. We then examine the processing of depth information in the dorsal pathway. Finally, we turn to the ventral cortical pathway and consider the processing of information related to form. Color vision is the subject of the next chapter.
Color Blindness Red-Green Color Blindness. When a single group of colorreceptive cones is missing from the eye, the person is unable to distinguish some colors from others. For instance, one can see in Figure 50–9 that green, yellow, orange, and red colors, which are the colors between the wavelengths of 525 and 675 nanometers, are normally distinguished from one another by the red and green cones. If either of these two cones is missing, the person cannot use this mechanism for distinguishing these four colors; the person is especially unable to distinguish red from green and is therefore said to have red-green color blindness. A person with loss of red cones is called a protanope; the overall visual spectrum is noticeably shortened at the long wavelength end because of a lack of the red cones. A color-blind person who lacks green cones is called a deuteranope; this person has a perfectly normal visual spectral width because red cones are available to detect the long wavelength red color. Red-green color blindness is a genetic disorder that occurs almost exclusively in males. That is, genes in the female X chromosome code for the respective cones. Yet color blindness almost never occurs in females because at least one of the two X chromosomes almost always has a normal gene for each type of cone. Because the male has only one X chromosome, a missing gene can lead to color blindness. Because the X chromosome in the male is always inherited from the mother, never from the father, color blindness is passed from mother to son, and the mother is said to be a color blindness carrier; this is true in about 8 per cent of all women. Blue Weakness. Only rarely are blue cones missing, although sometimes they are underrepresented, which is a genetically inherited state giving rise to the phenomenon called blue weakness. Color Test Charts. A rapid method for determining color blindness is based on the use of spot charts such as those shown in Figure 50–10. These charts are arranged with a confusion of spots of several different colors. In the top chart, the person with normal color vision reads “74,” whereas the red-green color-blind person reads “21.” In the bottom chart, the person with normal color vision reads “42,” whereas the red-blind person reads “2,” and the green-blind person reads “4.” If one studies these charts while at the same time observing the spectral sensitivity curves of the different cones depicted in Figure 50–9, it can be readily understood how excessive emphasis can be placed on spots of certain colors by color-blind people.