SlideShare une entreprise Scribd logo
1  sur  18
<< BackArch Capital Group Ltd. Reports 2009 First Quarter Results

HAMILTON, Bermuda--(BUSINESS WIRE)--Apr. 28, 2009-- Arch Capital Group Ltd.
(NASDAQ: ACGL) reports that net income available to common shareholders for the 2009 first
quarter was $139.9 million, or $2.24 per share, compared to $189.4 million, or $2.78 per share,
for the 2008 first quarter. The Company also reported after-tax operating income available to
common shareholders of $169.0 million, or $2.70 per share, for the 2009 first quarter, compared
to $202.0 million, or $2.97 per share, for the 2008 first quarter. All earnings per share amounts
discussed in this release are on a diluted basis.

The Company‘s book value per common share increased by 6.3% to $54.61 at March 31, 2009,
from $51.36 per share at December 31, 2008. The Company‘s after-tax operating income
available to common shareholders represented a 21.1% annualized return on average common
equity for the 2009 first quarter, compared to 21.9% for the 2008 first quarter. After-tax
operating income available to common shareholders, a non-GAAP measure, is defined as net
income available to common shareholders, excluding net realized gains or losses, net impairment
losses recognized in earnings, equity in net income or loss of investment funds accounted for
using the equity method and net foreign exchange gains or losses, net of income taxes. See page
7 for a further discussion of after-tax operating income available to common shareholders and
Regulation G.

The following table summarizes the Company‘s underwriting results:

                            Three Months Ended
                            March 31,
(U.S. dollars in thousands) 2009        2008

Gross premiums written      $ 1,024,971       $ 1,053,152
Net premiums written          822,863           811,342
Net premiums earned           700,564           708,234
Underwriting income           93,389            98,371

Combined ratio                86.7        %    86.2         %

The following table summarizes, on an after-tax basis, the Company‘s consolidated financial
data, including a reconciliation of after-tax operating income available to common shareholders
to net income available to common shareholders and related diluted per share results:

                                                                    Three Months Ended
                                                                    March 31,
(U.S. dollars in thousands, except per share data)                  2009        2008

After-tax operating income available to common shareholders         $ 169,001      $ 201,983
Net realized gains (losses), net of tax                               (9,111      ) 45,782
Net impairment losses recognized in earnings, net of tax              (36,134     ) (12,646         )
Equity in net income (loss) of investment funds accounted for
                                                                        (9,581       )    (22,313      )
using the equity method, net of tax
Net foreign exchange gains (losses), net of tax                          25,694            (23,384     )
Net income available to common shareholders                            $ 139,869         $ 189,422

Diluted per common share results:
After-tax operating income available to common shareholders            $ 2.70         $ 2.97
Net realized gains (losses), net of tax                                  (0.14       ) 0.67
Net impairment losses recognized in earnings, net of tax                 (0.58       ) (0.19           )
Equity in net income (loss) of investment funds accounted for
                                                                        (0.15        )    (0.33        )
using the equity method, net of tax
Net foreign exchange gains (losses), net of tax                          0.41              (0.34       )
Net income available to common shareholders                            $ 2.24            $ 2.78

Weighted average common shares and common share equivalents
                                                                        62,559,969        68,019,413
outstanding – diluted

The combined ratio represents a measure of underwriting profitability, excluding investment
income, and is the sum of the loss ratio and expense ratio. A combined ratio under 100%
represents an underwriting profit and a combined ratio over 100% represents an underwriting
loss. For the 2009 first quarter, the combined ratio of the Company‘s insurance and reinsurance
subsidiaries consisted of a loss ratio of 57.2% and an underwriting expense ratio of 29.5%,
compared to a loss ratio of 57.1% and an underwriting expense ratio of 29.1% for the 2008 first
quarter. The loss ratio of 57.2% for the 2009 first quarter was comprised of 45.5 points of paid
losses (including 5.0 points related to 2005 and 2008 named catastrophic events), 4.4 points
related to reserves for reported losses and 7.3 points related to incurred but not reported reserves.

In establishing the reserves for losses and loss adjustment expenses, the Company has made
various assumptions relating to the pricing of its reinsurance contracts and insurance policies and
also has considered available historical industry experience and current industry conditions. The
Company‘s reserving method to date has been, to a large extent, the expected loss method, which
is commonly applied when limited loss experience exists. Any estimates and assumptions made
as part of the reserving process could prove to be inaccurate due to several factors, including the
fact that relatively limited historical information has been reported to the Company through
March 31, 2009. For a discussion of underwriting activities and a review of the Company‘s
results by operating segment, see ―Segment Information‖ in the Supplemental Financial
Information section of this release.

The Company‘s investment portfolio continues to be comprised primarily of high quality fixed
income securities, with no direct holdings of collateralized debt obligations (CDOs),
collateralized loan obligations (CLOs) or credit default swaps (CDSs). The Company‘s portfolio
does not include ownership of common stock or preferred stock of any publicly-traded issuers
and essentially includes no investments in hedge funds or private equity funds. The average
credit quality rating of the portfolio remained at ―AA+‖ at March 31, 2009 and the average
effective duration was 3.02 years at March 31, 2009, compared to 3.62 years at December 31,
2008. Including the effects of foreign exchange, total return on the Company‘s investment
portfolio was approximately 1.09% for the 2009 first quarter, compared to 0.95% for the 2008
first quarter. Excluding foreign exchange, total return was 1.23% for the 2009 first quarter,
compared to 0.71% for the 2008 first quarter.

Net investment income for the 2009 first quarter was $95.9 million, or $1.53 per share, compared
to $111.7 million, or $1.79 per share, in the 2008 fourth quarter and $122.2 million, or $1.80 per
share, in the 2008 first quarter. Contributing to the decrease in investment income compared to
the 2008 fourth quarter were a decline in the portfolio‘s book yield from 4.55% at year-end to
4.17%, due in part to lower available yields and a reduction in the portfolio‘s effective duration.
In addition, $3.0 million of the decrease from the 2008 fourth quarter related to reductions to the
cost basis of treasury inflation protected securities (TIPS) in the 2009 first quarter which resulted
from a decline in the consumer price index (CPI) during the period. Although TIPS investments
negatively impacted net investment income, they generated a positive total return for the quarter.
The Company has now reduced its exposure to TIPS as of March 31, 2009. Income from the
Company‘s securities lending program also declined by $2.4 million from the 2008 fourth
quarter due to the increased supply of U.S. Treasuries and lower federal funds rates in effect
during the 2009 first quarter. The comparability of net investment income during the 2009 and
2008 first quarters was also influenced by the Company‘s share repurchase program described
below. In addition, as previously disclosed, the 2008 amount included $3.4 million of interest
income related to a favorable arbitration decision. The pre-tax investment income yield was
3.82% for the 2009 first quarter, compared to 4.50% for the 2008 fourth quarter and 4.88%
(excluding the arbitration interest) for the 2008 first quarter.

During the 2009 first quarter, the Company adopted FASB Staff Position No. FAS 115-2,
―Recognition and Presentation of Other-Than-Temporary Impairments‖ (―FSP 115-2‖). The new
accounting guidance revises the recognition and reporting requirements for other-than-temporary
impairments (OTTI) on the Company‘s debt securities. The Company reviewed OTTI provisions
it had recorded through realized losses on securities held at December 31, 2008 ($171.1 million)
and estimated the portion related to credit events (i.e., where the present value of cash flows
expected to be collected are lower than the amortized cost basis of the security) and the portion
related to all other factors (e.g., interest rates, market conditions, etc.). The Company determined
that $109.1 million of the OTTI previously recorded related to specific credit events and $62.0
million related to all other factors. Under FSP 115-2, the Company increased the amortized cost
basis of these debt securities by $62.0 million and recorded a cumulative effect adjustment, net
of tax, in its shareholders‘ equity section. The cumulative effect adjustment had no effect on total
shareholders‘ equity as it increased retained earnings and reduced accumulated other
comprehensive income.

Under the new accounting guidance, the amount of the credit loss portion of OTTI is recorded
through earnings while the portion attributable to all other factors is recorded as a component of
other comprehensive income in the equity section. In the 2009 first quarter, the Company
recorded $36.1 million of net impairment losses through earnings, while the portion of loss
recognized as a component of other comprehensive income on these securities was
approximately $56.9 million. The net impairment losses primarily resulted from changes to
expected recovery values during the period on structured securities (mortgage and asset backed)
along with the winding down and liquidation of a Euro-denominated bank loan fund for which
limited recovery value is expected.

The Company recorded $9.6 million of net losses related to investment funds accounted for
using the equity method for the 2009 first quarter, compared to net losses of $22.3 million for the
2008 first quarter. Due to the ownership structure of these investment funds, which invest in
fixed maturity securities, the Company uses the equity method. In applying the equity method,
these investments are initially recorded at cost and are subsequently adjusted based on the
Company‘s proportionate share of the net income or loss of the funds (which include changes in
the market value of the underlying securities in the funds). This method of accounting is different
from the way the Company accounts for its other fixed maturity securities. Investment funds
accounted for using the equity method totaled $293.5 million at March 31, 2009, compared to
$301.0 million at December 31, 2008. The Company‘s portfolio includes $331.3 million of
investments in U.S. and Euro-denominated bank loan funds, which are primarily reflected in the
investment funds accounted for using the equity method shown above. Please refer to the
Company‘s Financial Supplement dated March 31, 2009, which is posted on the Company‘s
website at http://www.archcapgroup.bm/EarningsReleases.aspx for further information on the
Company‘s investment portfolio.

The Company‘s effective tax rates on income before income taxes and pre-tax operating income
for the 2009 first quarter were 6.1% and 3.3%, respectively, compared to 3.9% and 2.5% for the
2008 first quarter. The Company‘s effective tax rates may fluctuate from period to period based
on the relative mix of income reported by jurisdiction primarily due to the varying tax rates in
each jurisdiction. The Company‘s quarterly tax provision is adjusted to reflect changes in its
expected annual effective tax rates, if any. The Company currently expects that its annual
effective tax rate on pre-tax operating income available to common shareholders for the year
ended December 31, 2009 will be in the range of 2.5% to 4.5%. In addition, the Company‘s
Bermuda-based reinsurer incurs federal excise taxes for premiums assumed on U.S. risks. The
Company incurred $3.3 million of federal excise taxes in the 2009 and 2008 first quarters. Such
amounts are reflected as acquisition expenses in the Company‘s consolidated statements of
income.

Net foreign exchange gains for the 2009 first quarter of $25.2 million consisted of net unrealized
gains of $25.9 million and net realized losses of $0.7 million, compared to net foreign exchange
losses for the 2008 first quarter of $23.6 million which consisted of net unrealized losses of
$22.3 million and net realized losses of $1.3 million. Net unrealized foreign exchange gains or
losses result from the effects of revaluing the Company‘s net insurance liabilities required to be
settled in foreign currencies at each balance sheet date. The Company holds investments in
foreign currencies which are intended to mitigate its exposure to foreign currency fluctuations in
its net insurance liabilities. However, changes in the value of such investments due to foreign
currency rate movements are reflected as a direct increase or decrease to shareholders‘ equity
and are not included in the statements of income.

Diluted weighted average common shares and common share equivalents outstanding, used in
the calculation of after-tax operating income and net income per common share, were 62.6
million for the 2009 first quarter, compared to 68.0 million for the 2008 first quarter. The lower
level of weighted average shares outstanding in the 2009 first quarter was primarily due to the
impact of share repurchases as discussed below.

The board of directors of ACGL has authorized the investment of up to $1.5 billion in ACGL‘s
common shares through a share repurchase program. Repurchases under the program may be
effected from time to time in open market or privately negotiated transactions through February
2010. In March 2009, ACGL purchased $1.6 million of common shares through the share
repurchase program. Since the inception of the share repurchase program through March 31,
2009, ACGL has repurchased approximately 15.3 million common shares for an aggregate
purchase price of $1.05 billion. At March 31, 2009, approximately $448.3 million of repurchases
were available under the share repurchase program. As a result of the share repurchase
transactions to date, book value per common share was reduced by $2.86 per share at March 31,
2009, compared to $3.52 at December 31, 2008, while weighted average shares outstanding were
reduced by 15.3 million for the 2009 first quarter, compared to 9.4 million shares for the 2008
first quarter.

At March 31, 2009, the Company‘s capital of $4.03 billion consisted of $300.0 million of senior
notes, representing 7.4% of the total, $100.0 million of revolving credit agreement borrowings
due in August 2011, representing 2.5% of the total, $325.0 million of preferred shares,
representing 8.1% of the total, and common shareholders‘ equity of $3.31 billion, representing
the balance. At December 31, 2008, the Company‘s capital of $3.83 billion consisted of $300.0
million of senior notes, representing 7.8% of the total, $100.0 million of revolving credit
agreement borrowings due in August 2011, representing 2.6% of the total, $325.0 million of
preferred shares, representing 8.5% of the total, and common shareholders‘ equity of $3.11
billion, representing the balance. The increase in total capital during the 2009 first quarter was
primarily attributable to net income during the period.

The Company will hold a conference call for investors and analysts at 11:00 a.m. Eastern Time
on Wednesday, April 29, 2009. A live webcast of this call will be available via the Investor
Relations – Events and Presentations section of the Company's website at
http://www.archcapgroup.bm. A telephone replay of the conference call also will be available
beginning on April 29 at 1:00 p.m. Eastern Time until May 6, 2009 at midnight Eastern Time. To
access the replay, domestic callers should dial 888-286-8010 (passcode 14362334), and
international callers should dial 617-801-6888 (passcode 14362334).

Please refer to the Company‘s Financial Supplement dated March 31, 2009, which is posted on
the Company‘s website at http://www.archcapgroup.bm/EarningsReleases.aspx. The Financial
Supplement provides additional detail regarding the financial performance of the Company.

Arch Capital Group Ltd., a Bermuda-based company with over $4.0 billion in capital at March
31, 2009, provides insurance and reinsurance on a worldwide basis through its wholly owned
subsidiaries.

Cautionary Note Regarding Forward-Looking Statements
The Private Securities Litigation Reform Act of 1995 (―PLSRA‖) provides a ―safe harbor‖ for
forward-looking statements. This release or any other written or oral statements made by or on
behalf of the Company may include forward-looking statements, which reflect the Company‘s
current views with respect to future events and financial performance. All statements other than
statements of historical fact included in or incorporated by reference in this release are forward-
looking statements. Forward-looking statements, for purposes of the PLSRA or otherwise, can
generally be identified by the use of forward-looking terminology such as ―may,‖ ―will,‖
―expect,‖ ―intend,‖ ―estimate,‖ ―anticipate,‖ ―believe‖ or ―continue‖ and similar statements of a
future or forward-looking nature or their negative or variations or similar terminology.

Forward-looking statements involve the Company‘s current assessment of risks and
uncertainties. Actual events and results may differ materially from those expressed or implied in
these statements. Important factors that could cause actual events or results to differ materially
from those indicated in such statements are discussed below and elsewhere in this release and in
the Company‘s periodic reports filed with the Securities and Exchange Commission (the ―SEC‖),
and include:

       the Company‘s ability to successfully implement its business strategy during ―soft‖ as
       well as ―hard‖ markets;
       acceptance of the Company‘s business strategy, security and financial condition by rating
       agencies and regulators, as well as by brokers and its insureds and reinsureds;
       the Company‘s ability to maintain or improve its ratings, which may be affected by its
       ability to raise additional equity or debt financings, by ratings agencies‘ existing or new
       policies and practices, as well as other factors described herein;
       general economic and market conditions (including inflation, interest rates, foreign
       currency exchange rates and prevailing credit terms) and conditions specific to the
       reinsurance and insurance markets in which the Company operates;
       competition, including increased competition, on the basis of pricing, capacity, coverage
       terms or other factors;
       the Company‘s ability to successfully integrate, establish and maintain operating
       procedures (including the implementation of improved computerized systems and
       programs to replace and support manual systems) to effectively support its underwriting
       initiatives and to develop accurate actuarial data;
       the loss of key personnel;
       the integration of businesses the Company has acquired or may acquire into its existing
       operations;
       accuracy of those estimates and judgments utilized in the preparation of the Company‘s
       financial statements, including those related to revenue recognition, insurance and other
       reserves, reinsurance recoverables, investment valuations, intangible assets, bad debts,
       income taxes, contingencies and litigation, and any determination to use the deposit
       method of accounting, which for a relatively new insurance and reinsurance company,
       like the Company, are even more difficult to make than those made in a mature company
       since relatively limited historical information has been reported to the Company through
       March 31, 2009;
greater than expected loss ratios on business written by the Company and adverse
       development on claim and/or claim expense liabilities related to business written by its
       insurance and reinsurance subsidiaries;
       severity and/or frequency of losses;
       claims for natural or man-made catastrophic events in the Company‘s insurance or
       reinsurance business could cause large losses and substantial volatility in its results of
       operations;
       acts of terrorism, political unrest and other hostilities or other unforecasted and
       unpredictable events;
       losses relating to aviation business and business produced by a certain managing
       underwriting agency for which the Company may be liable to the purchaser of its prior
       reinsurance business or to others in connection with the May 5, 2000 asset sale described
       in the Company‘s periodic reports filed with the SEC;
       availability to the Company of reinsurance to manage its gross and net exposures and the
       cost of such reinsurance;
       the failure of reinsurers, managing general agents, third party administrators or others to
       meet their obligations to the Company;
       the timing of loss payments being faster or the receipt of reinsurance recoverables being
       slower than anticipated by the Company;
       the Company‘s investment performance;
       material differences between actual and expected assessments for guaranty funds and
       mandatory pooling arrangements;
       changes in accounting principles or policies or in the Company‘s application of such
       accounting principles or policies;
       changes in the political environment of certain countries in which the Company operates
       or underwrites business;
       statutory or regulatory developments, including as to tax policy matters and insurance
       and other regulatory matters such as the adoption of proposed legislation that would
       affect Bermuda-headquartered companies and/or Bermuda-based insurers or reinsurers
       and/or changes in regulations or tax laws applicable to the Company, its subsidiaries,
       brokers or customers; and
       the other matters set forth under Item 1A ―Risk Factors‖, Item 7 ―Management‘s
       Discussion and Analysis of Financial Condition and Results of Operations‖ and other
       sections of the Company‘s Annual Report on
       Form 10-K, as well as the other factors set forth in the Company‘s other documents on
       file with the SEC, and management‘s response to any of the aforementioned factors.

In addition, other general factors could affect the Company‘s results, including developments in
the world‘s financial and capital markets and its access to such markets.

All subsequent written and oral forward-looking statements attributable to the Company or
persons acting on its behalf are expressly qualified in their entirety by these cautionary
statements. The foregoing review of important factors should not be construed as exhaustive and
should be read in conjunction with other cautionary statements that are included herein or
elsewhere. The Company undertakes no obligation to publicly update or revise any forward-
looking statement, whether as a result of new information, future events or otherwise.
Comment on Regulation G

Throughout this release, the Company presents its operations in the way it believes will be the
most meaningful and useful to investors, analysts, rating agencies and others who use the
Company‘s financial information in evaluating the performance of the Company. This
presentation includes the use of after-tax operating income available to common shareholders,
which is defined as net income available to common shareholders, excluding net realized gains
or losses, net impairment losses included in earnings, equity in net income or loss of investment
funds accounted for using the equity method and net foreign exchange gains or losses, net of
income taxes. The presentation of after-tax operating income available to common shareholders
is a ―non-GAAP financial measure‖ as defined in Regulation G. The reconciliation of such
measure to net income available to common shareholders (the most directly comparable GAAP
financial measure) in accordance with Regulation G is included on page 2 of this release.

The Company believes that net realized gains or losses, net impairment losses included in
earnings, equity in net income or loss of investment funds accounted for using the equity method
and net foreign exchange gains or losses in any particular period are not indicative of the
performance of, or trends in, the Company‘s business performance. Although net realized gains
or losses, net impairment losses included in earnings, equity in net income or loss of investment
funds accounted for using the equity method and net foreign exchange gains or losses are an
integral part of the Company‘s operations, the decision to realize investment gains or losses, the
recognition of net impairment losses, the recognition of equity in net income or loss of
investment funds accounted for using the equity method and the recognition of foreign exchange
gains or losses are independent of the insurance underwriting process and result, in large part,
from general economic and financial market conditions. Furthermore, certain users of the
Company‘s financial information believe that, for many companies, the timing of the realization
of investment gains or losses is largely opportunistic. In addition, net impairment losses included
in earnings on the Company‘s investments represent other-than-temporary declines in expected
recovery values on securities without actual realization. The use of the equity method on certain
of the Company‘s investments in certain funds that invest in fixed maturity securities is driven
by the ownership structure of such funds (either limited partnerships or limited liability
companies). In applying the equity method, these investments are initially recorded at cost and
are subsequently adjusted based on the Company‘s proportionate share of the net income or loss
of the funds (which include changes in the market value of the underlying securities in the
funds). This method of accounting is different from the way the Company accounts for its other
fixed maturity securities and the timing of the recognition of equity in net income or loss of
investment funds accounted for using the equity method may differ from gains or losses in the
future upon sale or maturity of such investments. Due to these reasons, the Company excludes
net realized gains or losses, equity in net income or loss of investment funds accounted for using
the equity method and net foreign exchange gains or losses from the calculation of after-tax
operating income available to common shareholders.

The Company believes that showing net income available to common shareholders exclusive of
the items referred to above reflects the underlying fundamentals of the Company‘s business since
the Company evaluates the performance of and manages its business to produce an underwriting
profit. In addition to presenting net income available to common shareholders, the Company
believes that this presentation enables investors and other users of the Company‘s financial
information to analyze the Company‘s performance in a manner similar to how the Company‘s
management analyzes performance. The Company also believes that this measure follows
industry practice and, therefore, allows the users of the Company‘s financial information to
compare the Company‘s performance with its industry peer group. The Company believes that
the equity analysts and certain rating agencies which follow the Company and the insurance
industry as a whole generally exclude these items from their analyses for the same reasons.

ARCH CAPITAL GROUP LTD. AND SUBSIDIARIES

SUPPLEMENTAL FINANCIAL INFORMATION

Book Value Per Common Share and Share Repurchases

                                               March 31,      December 31,
(U.S. dollars in thousands, except share data) 2009           2008

Calculation of book value per common share:
Total shareholders‘ equity                     $ 3,630,396 $ 3,432,965
Less preferred shareholders‘ equity              (325,000 ) (325,000 )
Common shareholders‘ equity                    $ 3,305,396 $ 3,107,965
Common shares outstanding (1)                    60,532,222    60,511,974
Book value per common share                    $ 54.61       $ 51.36
                                                           Three Months
                                                                                     Cumulative
                                                           Ended
                                                           March 31,                 March 31,
(U.S. dollars in thousands, except share data)             2009      2008            2009

Effect of share repurchases:
Aggregate purchase price of shares repurchased             $ 1,552 $ 189,843         $ 1,051,748
Shares repurchased                                           33,305 2,749,909          15,289,594
Average price per share repurchased                        $ 46.60 $ 69.04           $ 68.79

Estimated net accretive (dilutive) impact on ending book
                                                           $ 0.01      ($0.49    )    ($2.86        )
value per common share (2)
Estimated net accretive impact on diluted earnings per
                                                           $ 0.40    $ 0.26
share (3)

(1) Excludes the effects of 5,111,344 and 5,131,135 stock options and 347,019 and 412,622
restricted stock units outstanding at March 31, 2009 and December 31, 2008, respectively.

(2) As the average price per share repurchased during the 2009 first quarter was lower than the
book value per common share, the repurchase of shares during the period increased book value
per common share during the 2009 first quarter. For the 2008 first quarter and cumulative
through March 31, 2009, the average price per share repurchased was higher than the book value
per common share and, accordingly, decreased book value per common share.

(3) The estimated impact on diluted earnings per share was calculated comparing reported results
versus (i) net income (loss) per share plus an estimate of lost net investment income on the
cumulative share repurchases divided by (ii) weighted average diluted shares outstanding
excluding the weighted average impact of cumulative share repurchases. The impact of
cumulative share repurchases was accretive to diluted earnings per share in the periods
presented.

Investment Information
                                                        Three Months Ended
                                                        March 31,
(U.S. dollars in thousands, except share data)          2009      2008

Net investment income:
Total                                                   $ 95,882        $ 122,193
Per share                                               $ 1.53          $ 1.80

Pre-tax investment income yield (at amortized cost)      3.82       %    4.88       %
After-tax investment income yield (at amortized cost)    3.70       %    4.75       %

Cash flow from operations                               $ 294,803       $ 334,545

On a consolidated basis, the Company‘s aggregate investable assets totaled $10.3 billion at
March 31, 2009, compared to $10.0 billion at December 31, 2008, as detailed in the table below:

                                                                                        December
                                                                    March 31,
                                                                                        31,
(U.S. dollars in thousands)                                         2009                2008

Investable assets:
Fixed maturities available for sale, at market value             $ 8,540,653            $ 8,122,221
Fixed maturities pledged under securities lending agreements, at
                                                                   503,449               626,501
market value (1)
Total fixed maturities                                             9,044,102             8,748,722
Short-term investments available for sale, at market value         749,708               479,586
Short-term investments pledged under securities lending
                                                                   56,242                101,564
agreements, at market value (1)
Cash                                                               244,037               251,739
Other investments (2)
Fixed income mutual funds                                          32,912                39,858
Privately held securities and other                                72,076                69,743
Investment funds accounted for using the equity method (3)             293,452            301,027
Securities transactions entered into but not settled at the balance
                                                                       (241,836      )    (18,236      )
sheet date
Total investable assets (1)                                           $ 10,250,693       $ 9,974,003

Fixed income portfolio (1):
Average effective duration (in years)                                  3.02            3.62
Average credit quality                                                AA+             AA+
Imbedded book yield (before investment expenses)                       4.17          % 4.55            %

(1) In securities lending transactions, the Company receives collateral in excess of the market
value of the fixed maturities and short-term investments pledged under securities lending
agreements. For purposes of this table, the Company has excluded the collateral received and
reinvested at March 31, 2009 and December 31, 2008 of $550.8 million and $730.2 million,
respectively, which is reflected as ―investment of funds received under securities lending
agreements, at market value‖ and included the $559.7 million and $728.1 million, respectively,
of ―fixed maturities and short-term investments pledged under securities lending agreements, at
market value.‖

(2) Other investments include (i) mutual funds which invest in fixed maturity securities and
international equity index funds; and (ii) privately held securities and other which include the
Company‘s investment in Aeolus LP and other privately held securities.

(3) The Company‘s investment portfolio includes certain funds that invest in fixed maturity
securities which, due to the ownership structure of the funds, are accounted for by the Company
using the equity method. In applying the equity method, these investments are initially recorded
at cost and are subsequently adjusted based on the Company‘s proportionate share of the net
income or loss of the funds (which include changes in the market value of the underlying
securities in the funds). Changes in the carrying value of such investments are recorded as
‗Equity in net income (loss) of investment funds accounted for using the equity method‘ rather
than as an unrealized gain or loss component of accumulated other comprehensive income in
shareholders‘ equity as are changes in the carrying value of the Company‘s other fixed income
investments.

For further information on the Company‘s investment portfolio, please refer to the Company‘s
Financial Supplement dated March 31, 2009, which is posted on the Company‘s website at
http://www.archcapgroup.bm/EarningsReleases.aspx.

Selected Information on Losses and Loss Adjustment Expenses

                                                                       Three Months Ended
                                                                       March 31,
(U.S. dollars in thousands)                                            2009        2008

Components of losses and loss adjustment expenses
Paid losses and loss adjustment expenses                      $ 318,541        $ 249,499
Increase in unpaid losses and loss adjustment expenses          82,001           154,918
Total losses and loss adjustment expenses                     $ 400,542        $ 404,417

Estimated net (favorable) adverse development in prior year
loss reserves,
net of related adjustments
Net impact on underwriting results:
Insurance                                                      ($8,178 )        ($5,610 )
Reinsurance                                                    (39,693 )        (51,050 )
Total                                                          ($47,871 )       ($56,660 )

Impact on losses and loss adjustment expenses:
Insurance                                                      ($9,126 )        ($5,776 )
Reinsurance                                                    (42,016 )        (51,086 )
Total                                                          ($51,142 )       ($56,862 )

Impact on acquisition expenses:
Insurance                                                     $ 948            $ 166
Reinsurance                                                     2,323            36
Total                                                         $ 3,271          $ 202

Impact on combined ratio:
Insurance                                                      (2.0       %)    (1.3       %)
Reinsurance                                                    (13.3      %)    (17.7      %)
Total                                                          (6.8       %)    (8.0       %)

Impact on loss ratio:
Insurance                                                      (2.3       %)    (1.4       %)
Reinsurance                                                    (14.0      %)    (17.7      %)
Total                                                          (7.3       %)    (8.0       %)

Impact on acquisition expense ratio:
Insurance                                                      0.3        %     0.1        %
Reinsurance                                                    0.7        %     0.0        %
Total                                                          0.5        %     0.0        %

Estimated net losses incurred from current accident year
catastrophic events (1)
                                                              $—
Insurance                                                                      $ 20,300
Reinsurance                                                     8,012            5,774
Total                                                         $ 8,012          $ 26,074
Impact on loss ratio:
                                                                       —
Insurance                                                                             4.8       %
Reinsurance                                                            2.7      %     2.0       %
Total                                                                  1.1      %     3.7       %

(1) Equals estimated losses from catastrophic events occurring in the current accident year, net of
reinsurance and reinstatement premiums. Amounts shown for the insurance segment are for
named catastrophic events only. Amounts shown for the reinsurance segment include (i) named
events with over $5 million of losses incurred by its Bermuda and Europe operations and (ii) all
catastrophe losses incurred by its U.S. operations.

Segment Information

For additional detail regarding the Company‘s operating segments, please refer to the
Company‘s Financial Supplement dated March 31, 2009 on the Company‘s website at
http://www.archcapgroup.bm/EarningsReleases.aspx.

Discussion of 2009 First Quarter Performance

Insurance Segment
                                Three Months Ended
                                March 31,
(U.S. dollars in thousands)     2009      2008

Gross premiums written          $ 638,409       $ 626,348
Net premiums written              441,586         402,764
Net premiums earned               401,097         419,100
Underwriting income               11,421          7,153

Loss ratio                       67.3       %    68.6       %
Acquisition expense ratio        14.1       %    12.2       %
Other operating expense ratio    15.7       %    17.6       %
Combined ratio                   97.1       %    98.4       %

Gross premiums written by the insurance segment in the 2009 first quarter were 1.9% higher
than in the 2008 first quarter, with growth in programs, national accounts casualty and executive
assurance business. The increase in programs and national accounts casualty business primarily
resulted from new business while the increase in executive assurance business primarily resulted
from renewal rate increases. Such amounts were partially offset by reductions in casualty,
construction and professional liability business as the insurance segment continued to maintain
underwriting discipline in response to the current market environment. The higher net premiums
written growth rate of 9.6% primarily resulted from changes in reinsurance usage and the impact
of changes in the mix of business. Net premiums earned by the insurance segment in the 2009
first quarter were 4.3% lower than in the 2008 first quarter, and reflect changes in net premiums
written over the previous five quarters.

The loss ratio for the insurance segment was 67.3% in the 2009 first quarter, compared to 68.6%
in the 2008 first quarter. The 2009 first quarter loss ratio reflected a 2.3 point reduction related to
estimated net favorable development in prior year loss reserves, compared to 1.4 points in the
2008 first quarter. The estimated net favorable development in the 2009 first quarter was
primarily in medium-tail lines and mainly resulted from better than expected claims emergence.
The 2009 first quarter loss ratio did not include any significant catastrophic activity while the
2008 first quarter loss ratio included 4.8 points related to the Australian floods. The insurance
segment‘s loss ratio in the 2009 first quarter reflected an increase in expected loss ratios across a
number of lines of business primarily due to the anticipated impact of rate changes and changes
in the mix of business.

The insurance segment‘s underwriting expense ratio was 29.8% in the 2009 and 2008 first
quarters. The acquisition expense ratio was 14.1% for the 2009 first quarter, compared to 12.2%
for the 2008 first quarter. The acquisition expense ratio is influenced by, among other things, (1)
the amount of ceding commissions received from unaffiliated reinsurers, (2) the amount of
business written on a surplus lines (non-admitted) basis and (3) mix of business. In addition, the
2009 first quarter loss ratio reflected 0.3 points related to estimated net favorable development in
prior year loss reserves, compared to 0.1 points in the 2008 first quarter. The comparison of the
2009 first quarter and 2008 first quarter acquisition expense ratios reflects changes in the form of
reinsurance ceded and the mix of business. The insurance segment‘s other operating expense
ratio was 15.7% for the 2009 first quarter, compared to 17.6% in the 2008 first quarter, with the
decrease primarily attributable to non-recurring adjustments in compensation costs in the 2009
first quarter. In addition, the 2009 first quarter operating expense ratio reflects the benefits of the
insurance segment‘s expense management plan implemented in 2008, which included office
relocation and personnel and other expense saving initiatives.

Reinsurance Segment

                                Three Months Ended
                                March 31,
(U.S. dollars in thousands)     2009      2008

Gross premiums written          $ 390,129       $ 433,827
Net premiums written              381,277         408,578
Net premiums earned               299,467         289,134
Underwriting income               81,968          91,218

Loss ratio                        43.6      %    40.5       %
Acquisition expense ratio         23.0      %    21.7       %
Other operating expense ratio     6.1       %    6.3        %
Combined ratio                    72.7      %    68.5       %
Gross premiums written by the reinsurance segment in the 2009 first quarter were 10.1% lower
than in the 2009 first quarter, primarily due to reductions in other specialty and property
catastrophe business written in the 2009 first quarter. The decrease in other specialty was
primarily due to the non-renewal of a non-standard auto treaty, while the lower level of property
catastrophe business resulted from the impact of non-renewals of a small number of contracts.
The decreases were partially offset by an increase in writings by the reinsurance segment‘s
property facultative operation, which contributed $12.4 million of additional gross premiums
written in the 2009 first quarter compared to the 2008 first quarter.

Ceded premiums written by the reinsurance segment were 2.3% of gross premiums written for
the 2009 first quarter, compared to 5.8% for the 2008 first quarter. In the 2009 first quarter, Arch
Reinsurance Ltd., the Company‘s Bermuda-based reinsurer, ceded $3.5 million of premiums
written, or 0.9%, under a quota share reinsurance treaty to Flatiron Re Ltd., compared to $18.4
million, or 4.2%, in the 2008 first quarter. Commission income from the treaty (in excess of the
reimbursement of direct acquisition expenses) reduced the reinsurance segment‘s acquisition
expense ratio by 0.8 points in the 2009 first quarter, compared to 3.3 points in the 2008 first
quarter.

Net premiums written by the reinsurance segment in the 2009 first quarter were 6.7% lower than
in the 2008 first quarter, primarily due to the items noted above. Net premiums earned in the
2009 first quarter were 3.6% higher than in the 2008 first quarter, and reflect changes in net
premiums written over the previous five quarters, including the mix and type of business written.

The reinsurance segment‘s loss ratio was 43.6% in the 2009 first quarter, compared to 40.5% for
the 2008 first quarter. The loss ratio for the 2009 first quarter reflected a 14.0 point reduction
related to estimated net favorable development in prior year loss reserves, compared to a 17.7
point reduction in the 2008 first quarter. The estimated net favorable development in the 2009
first quarter primarily resulted from better than anticipated claims emergence in older
underwriting years. The 2009 first quarter loss ratio also reflected approximately 2.7 points of
catastrophic activity, while the 2008 first quarter loss ratio reflected approximately 2.0 points of
catastrophic activity. The reinsurance segment‘s 2009 first quarter loss ratio also reflected an
increase in expected loss ratios in a number of lines of business primarily due to the anticipated
impact of rate changes as well as changes in the mix of business.

The underwriting expense ratio for the reinsurance segment was 29.1% in the 2009 first quarter,
compared to 28.0% in the 2008 first quarter. The acquisition expense ratio for the 2009 first
quarter was 23.0%, compared to 21.7% for the 2008 first quarter, with the increase primarily due
to a lower level of commission income from the Treaty with Flatiron noted above. In addition,
the 2009 first quarter loss ratio reflected 0.7 points related to estimated net favorable
development in prior year loss reserves. The comparison of the 2009 first quarter and 2008 first
quarter acquisition expense ratios is influenced by, among other things, the mix and type of
business written and earned and the level of ceding commission income. The reinsurance
segment‘s other operating expense ratio was 6.1% for the 2009 first quarter, compared to 6.3%
for the 2008 first quarter. The decrease in the operating expense ratio primarily related to a
higher level of net premiums earned in the 2009 first quarter.
ARCH CAPITAL GROUP LTD. AND SUBSIDIARIES
CONSOLIDATED STATEMENTS OF INCOME
(U.S. dollars in thousands, except share data)

                                                                   (Unaudited)
                                                                   Three Months Ended
                                                                   March 31,
                                                                   2009        2008
Revenues
Net premiums written                                               $ 822,863     $ 811,342
Increase in unearned premiums                                        (122,299   ) (103,108    )
Net premiums earned                                                  700,564       708,234
Net investment income                                                95,882        122,193
Net realized gains (losses)                                          (5,164     ) 48,686

Total other-than-temporary impairment losses                        (92,989     )   (12,711   )
Portion of loss recognized in other comprehensive income (loss),
                                                                                    —
                                                                    56,855
before taxes
Net impairment losses recognized in earnings                        (36,134     )   (12,711   )

Fee income                                                          925             1,068
Equity in net income (loss) of investment funds accounted for
                                                                    (9,581      )   (22,313   )
using the equity method
Other income                                                        3,951           4,036
                                                                    750,443         849,193
Total revenues

Expenses
Losses and loss adjustment expenses                                 400,542         404,417
Acquisition expenses                                                126,458         114,639
Other operating expenses                                            87,116          97,187
Interest expense                                                    5,712           5,524
Net foreign exchange (gains) losses                                 (25,205     )   23,587
                                                                    594,623         645,354
Total expenses

                                                                    155,820         203,839
Income before income taxes

Income tax expense                                                  9,490           7,956

                                                                    146,330         195,883
Net income

Preferred dividends                                                 6,461           6,461
$ 139,869     $ 189,422
Net income available to common shareholders

Net income per common share
Basic                                                           $ 2.32        $ 2.90
Diluted                                                         $ 2.24        $ 2.78

Weighted average common shares and common share
equivalents outstanding
Basic                                                            60,313,550    65,295,516
Diluted                                                          62,559,969    68,019,413
ARCH CAPITAL GROUP LTD. AND SUBSIDIARIES
CONSOLIDATED BALANCE SHEETS
(U.S. dollars in thousands, except share data)

                                                               (Unaudited)
                                                                              December
                                                               March 31,
                                                                              31,
                                                               2009           2008
Assets
Investments:
Fixed maturities available for sale, at market value (amortized
                                                                  $ 8,540,653 $ 8,122,221
cost: 2009, $8,735,769; 2008, $8,314,615)
Short-term investments available for sale, at market value
                                                                    749,708     479,586
(amortized cost: 2009, $749,178; 2008, $478,088)
Investment of funds received under securities lending agreements,
                                                                    550,821     730,194
at market value (amortized cost: 2009, $571,102; 2008, $750,330)
Other investments (cost: 2009, $114,779; 2008, $125,858)            104,988     109,601
Investment funds accounted for using the equity method              293,452     301,027
Total investments                                                   10,239,622  9,742,629

Cash                                                             244,037       251,739
Accrued investment income                                        65,365        78,052
Investment in joint venture (cost: $100,000)                     101,143       98,341
Fixed maturities and short-term investments pledged under
                                                                 559,691       728,065
securities lending agreements, at market value
Premiums receivable                                              720,724       628,951
Unpaid losses and loss adjustment expenses recoverable           1,710,781     1,729,135
Paid losses and loss adjustment expenses recoverable             76,312        63,294
Prepaid reinsurance premiums                                     274,578       303,707
Deferred income tax assets, net                                  62,210        60,192
Deferred acquisition costs, net                                  313,973       295,192
Receivable for securities sold                                   1,191,896     105,073
Other assets                                                       531,955      532,175
                                                                 $ 16,092,287 $ 14,616,545
Total Assets

Liabilities
Reserve for losses and loss adjustment expenses                  $ 7,709,317 $ 7,666,957
Unearned premiums                                                  1,617,431   1,526,682
Reinsurance balances payable                                       146,981     138,509
Senior notes                                                       300,000     300,000
Revolving credit agreement borrowings                              100,000     100,000
Securities lending payable                                         574,337     753,528
Payable for securities purchased                                   1,433,732   123,309
Other liabilities                                                  580,093     574,595
                                                                   12,461,891  11,183,580
Total Liabilities

Commitments and Contingencies

Shareholders’ Equity
Non-cumulative preferred shares ($0.01 par value, 50,000,000
                                                                  130             130
shares authorized, issued: 13,000,000)
Common shares ($0.01 par value, 200,000,000 shares authorized,
                                                                  605             605
issued: 2009, 60,532,222; 2008, 60,511,974)
Additional paid-in capital                                        996,417         994,585
Retained earnings                                                 2,894,577       2,693,239
Accumulated other comprehensive income (loss), net of deferred
                                                                  (261,333    )   (255,594    )
income tax
Total Shareholders’ Equity                                         3,630,396    3,432,965
Total Liabilities and Shareholders’ Equity                       $ 16,092,287 $ 14,616,545

Source: Arch Capital Group Ltd.

Arch Capital Group Ltd.
John C.R. Hele, 441-278-9250
Fax: 441-278-9255
Executive Vice President and
Chief Financial Officer

Contenu connexe

Tendances

Ryder System, Inc. 3Q 2011 Earnings
Ryder System, Inc. 3Q 2011 EarningsRyder System, Inc. 3Q 2011 Earnings
Ryder System, Inc. 3Q 2011 EarningsRyder System, Inc.
 
credit swisseAnnual Report Part 2 Financial report 1998 / 1999
credit swisseAnnual Report Part 2 Financial report 1998 / 1999credit swisseAnnual Report Part 2 Financial report 1998 / 1999
credit swisseAnnual Report Part 2 Financial report 1998 / 1999QuarterlyEarningsReports2
 
CLX1101Rec-456456
CLX1101Rec-456456CLX1101Rec-456456
CLX1101Rec-456456finance48
 
allstate Quarterly Investor Information 2002 1st
allstate Quarterly Investor Information 2002 1stallstate Quarterly Investor Information 2002 1st
allstate Quarterly Investor Information 2002 1stfinance7
 
allstate Quarterly Investor Information Earnings Press Release 2006 3rd
allstate Quarterly Investor Information Earnings Press Release 2006 3rdallstate Quarterly Investor Information Earnings Press Release 2006 3rd
allstate Quarterly Investor Information Earnings Press Release 2006 3rdfinance7
 
Phoenix Technologies 1st Quarter 2009 Earnings Call
Phoenix Technologies 1st Quarter 2009 Earnings CallPhoenix Technologies 1st Quarter 2009 Earnings Call
Phoenix Technologies 1st Quarter 2009 Earnings Callearningsreport
 
visteon 1Q 2005 Form 10-Q
visteon 1Q 2005 Form 10-Qvisteon 1Q 2005 Form 10-Q
visteon 1Q 2005 Form 10-Qfinance24
 
avis budget group ABCR_1Q07_Financials
avis budget group ABCR_1Q07_Financialsavis budget group ABCR_1Q07_Financials
avis budget group ABCR_1Q07_Financialsfinance35
 
ameriprise Q308_Release
ameriprise Q308_Releaseameriprise Q308_Release
ameriprise Q308_Releasefinance43
 
Q1 2009 Financial results for SpareBank 1 Gruppen presented by acting CEO Kir...
Q1 2009 Financial results for SpareBank 1 Gruppen presented by acting CEO Kir...Q1 2009 Financial results for SpareBank 1 Gruppen presented by acting CEO Kir...
Q1 2009 Financial results for SpareBank 1 Gruppen presented by acting CEO Kir...SpareBank 1 Gruppen AS
 
Duke Energy 02/02/05_GAAP
Duke Energy 02/02/05_GAAPDuke Energy 02/02/05_GAAP
Duke Energy 02/02/05_GAAPfinance21
 
northrop grumman Earnings Announcement 2008 3rd
northrop grumman Earnings Announcement 2008 3rdnorthrop grumman Earnings Announcement 2008 3rd
northrop grumman Earnings Announcement 2008 3rdfinance8
 
RYDERFINAL 881F2721-61D0-41D9-90DD-BC4D3287E1AB_newryder4Q08Earnings_final
RYDERFINAL 881F2721-61D0-41D9-90DD-BC4D3287E1AB_newryder4Q08Earnings_finalRYDERFINAL 881F2721-61D0-41D9-90DD-BC4D3287E1AB_newryder4Q08Earnings_final
RYDERFINAL 881F2721-61D0-41D9-90DD-BC4D3287E1AB_newryder4Q08Earnings_finalfinance44
 

Tendances (16)

Ryder System, Inc. 3Q 2011 Earnings
Ryder System, Inc. 3Q 2011 EarningsRyder System, Inc. 3Q 2011 Earnings
Ryder System, Inc. 3Q 2011 Earnings
 
credit swisseAnnual Report Part 2 Financial report 1998 / 1999
credit swisseAnnual Report Part 2 Financial report 1998 / 1999credit swisseAnnual Report Part 2 Financial report 1998 / 1999
credit swisseAnnual Report Part 2 Financial report 1998 / 1999
 
CLX1101Rec-456456
CLX1101Rec-456456CLX1101Rec-456456
CLX1101Rec-456456
 
allstate Quarterly Investor Information 2002 1st
allstate Quarterly Investor Information 2002 1stallstate Quarterly Investor Information 2002 1st
allstate Quarterly Investor Information 2002 1st
 
allstate Quarterly Investor Information Earnings Press Release 2006 3rd
allstate Quarterly Investor Information Earnings Press Release 2006 3rdallstate Quarterly Investor Information Earnings Press Release 2006 3rd
allstate Quarterly Investor Information Earnings Press Release 2006 3rd
 
Q1 2009 Earning Report of Comerica Inc.
Q1 2009 Earning Report of Comerica Inc.Q1 2009 Earning Report of Comerica Inc.
Q1 2009 Earning Report of Comerica Inc.
 
Phoenix Technologies 1st Quarter 2009 Earnings Call
Phoenix Technologies 1st Quarter 2009 Earnings CallPhoenix Technologies 1st Quarter 2009 Earnings Call
Phoenix Technologies 1st Quarter 2009 Earnings Call
 
Q1 2009 Earning Report of Builders Firstsource
Q1 2009 Earning Report of Builders FirstsourceQ1 2009 Earning Report of Builders Firstsource
Q1 2009 Earning Report of Builders Firstsource
 
visteon 1Q 2005 Form 10-Q
visteon 1Q 2005 Form 10-Qvisteon 1Q 2005 Form 10-Q
visteon 1Q 2005 Form 10-Q
 
avis budget group ABCR_1Q07_Financials
avis budget group ABCR_1Q07_Financialsavis budget group ABCR_1Q07_Financials
avis budget group ABCR_1Q07_Financials
 
ameriprise Q308_Release
ameriprise Q308_Releaseameriprise Q308_Release
ameriprise Q308_Release
 
Q1 2009 Financial results for SpareBank 1 Gruppen presented by acting CEO Kir...
Q1 2009 Financial results for SpareBank 1 Gruppen presented by acting CEO Kir...Q1 2009 Financial results for SpareBank 1 Gruppen presented by acting CEO Kir...
Q1 2009 Financial results for SpareBank 1 Gruppen presented by acting CEO Kir...
 
Duke Energy 02/02/05_GAAP
Duke Energy 02/02/05_GAAPDuke Energy 02/02/05_GAAP
Duke Energy 02/02/05_GAAP
 
northrop grumman Earnings Announcement 2008 3rd
northrop grumman Earnings Announcement 2008 3rdnorthrop grumman Earnings Announcement 2008 3rd
northrop grumman Earnings Announcement 2008 3rd
 
RYDERFINAL 881F2721-61D0-41D9-90DD-BC4D3287E1AB_newryder4Q08Earnings_final
RYDERFINAL 881F2721-61D0-41D9-90DD-BC4D3287E1AB_newryder4Q08Earnings_finalRYDERFINAL 881F2721-61D0-41D9-90DD-BC4D3287E1AB_newryder4Q08Earnings_final
RYDERFINAL 881F2721-61D0-41D9-90DD-BC4D3287E1AB_newryder4Q08Earnings_final
 
federal reserve
federal reservefederal reserve
federal reserve
 

En vedette

Q1 2009 Earning Report of Columbia Banking System, Inc.
Q1 2009 Earning Report of Columbia Banking System, Inc.Q1 2009 Earning Report of Columbia Banking System, Inc.
Q1 2009 Earning Report of Columbia Banking System, Inc.earningreport earningreport
 
Q1 2009 Earning Report of Westamerica Bancorporation
Q1 2009 Earning Report of Westamerica BancorporationQ1 2009 Earning Report of Westamerica Bancorporation
Q1 2009 Earning Report of Westamerica Bancorporationearningreport earningreport
 
Q1 2009 Earning Report of Amerisourcebergen Corp.
Q1 2009 Earning Report of Amerisourcebergen Corp.Q1 2009 Earning Report of Amerisourcebergen Corp.
Q1 2009 Earning Report of Amerisourcebergen Corp.earningreport earningreport
 
Let’s Shap Cultures! A Creative Approach to Language Learning
Let’s Shap Cultures! A Creative Approach to Language LearningLet’s Shap Cultures! A Creative Approach to Language Learning
Let’s Shap Cultures! A Creative Approach to Language LearningFiorenza Congedo
 
Q1 2009 Earning Report of Newell Rubbermaid Inc.
Q1 2009 Earning Report of Newell Rubbermaid Inc.Q1 2009 Earning Report of Newell Rubbermaid Inc.
Q1 2009 Earning Report of Newell Rubbermaid Inc.earningreport earningreport
 
Double Page Spread Analyis Presentation
Double Page Spread Analyis  PresentationDouble Page Spread Analyis  Presentation
Double Page Spread Analyis Presentationguest77508c5
 
Q1 2009 Earning Report of Potash Corporation of Saskatchewan
Q1 2009 Earning Report of Potash Corporation of SaskatchewanQ1 2009 Earning Report of Potash Corporation of Saskatchewan
Q1 2009 Earning Report of Potash Corporation of Saskatchewanearningreport earningreport
 
Mountain Stream Group: Portfolio Sample - Valve Industry Market Research
Mountain Stream Group: Portfolio Sample - Valve Industry Market ResearchMountain Stream Group: Portfolio Sample - Valve Industry Market Research
Mountain Stream Group: Portfolio Sample - Valve Industry Market ResearchMountain Stream Group, Inc.
 
Inside Intuit: Effectively Managing Social Conversations to Strengthen Custom...
Inside Intuit: Effectively Managing Social Conversations to Strengthen Custom...Inside Intuit: Effectively Managing Social Conversations to Strengthen Custom...
Inside Intuit: Effectively Managing Social Conversations to Strengthen Custom...Adrian Parker
 
Q1 2009 Earning Report of First Financial Bankshares, Inc.
Q1 2009 Earning Report of First Financial Bankshares, Inc.Q1 2009 Earning Report of First Financial Bankshares, Inc.
Q1 2009 Earning Report of First Financial Bankshares, Inc.earningreport earningreport
 
The Brand University - How to make a sustainable, successful brand
The Brand University - How to make a sustainable, successful brandThe Brand University - How to make a sustainable, successful brand
The Brand University - How to make a sustainable, successful brandMinter Dial
 

En vedette (20)

Q1 2009 Earning Report of Columbia Banking System, Inc.
Q1 2009 Earning Report of Columbia Banking System, Inc.Q1 2009 Earning Report of Columbia Banking System, Inc.
Q1 2009 Earning Report of Columbia Banking System, Inc.
 
Q1 2009 Earning Report of Westamerica Bancorporation
Q1 2009 Earning Report of Westamerica BancorporationQ1 2009 Earning Report of Westamerica Bancorporation
Q1 2009 Earning Report of Westamerica Bancorporation
 
Q1 2009 Earning Report of Itt Industries Inc.
Q1 2009 Earning Report of Itt Industries Inc. Q1 2009 Earning Report of Itt Industries Inc.
Q1 2009 Earning Report of Itt Industries Inc.
 
Q1 2009 Earning Report of Huntington Bancshares
Q1 2009 Earning Report of Huntington BancsharesQ1 2009 Earning Report of Huntington Bancshares
Q1 2009 Earning Report of Huntington Bancshares
 
Q1 2009 Earning Report of Halliburton Co.
Q1 2009 Earning Report of Halliburton Co.Q1 2009 Earning Report of Halliburton Co.
Q1 2009 Earning Report of Halliburton Co.
 
Q1 2009 Earning Report of Amerisourcebergen Corp.
Q1 2009 Earning Report of Amerisourcebergen Corp.Q1 2009 Earning Report of Amerisourcebergen Corp.
Q1 2009 Earning Report of Amerisourcebergen Corp.
 
Q1 2009 Financial Report of Crane Co.
Q1 2009 Financial Report of Crane Co.Q1 2009 Financial Report of Crane Co.
Q1 2009 Financial Report of Crane Co.
 
Let’s Shap Cultures! A Creative Approach to Language Learning
Let’s Shap Cultures! A Creative Approach to Language LearningLet’s Shap Cultures! A Creative Approach to Language Learning
Let’s Shap Cultures! A Creative Approach to Language Learning
 
Q1 2009 Earning Report of Fiserv Inc.
Q1 2009 Earning Report of Fiserv Inc.Q1 2009 Earning Report of Fiserv Inc.
Q1 2009 Earning Report of Fiserv Inc.
 
Q1 2009 Earning Report of Taubman Centers, Inc.
Q1 2009 Earning Report of Taubman Centers, Inc.Q1 2009 Earning Report of Taubman Centers, Inc.
Q1 2009 Earning Report of Taubman Centers, Inc.
 
Q1 2009 Earning Report of Newell Rubbermaid Inc.
Q1 2009 Earning Report of Newell Rubbermaid Inc.Q1 2009 Earning Report of Newell Rubbermaid Inc.
Q1 2009 Earning Report of Newell Rubbermaid Inc.
 
Double Page Spread Analyis Presentation
Double Page Spread Analyis  PresentationDouble Page Spread Analyis  Presentation
Double Page Spread Analyis Presentation
 
Q1 2009 Earning Report of Potash Corporation of Saskatchewan
Q1 2009 Earning Report of Potash Corporation of SaskatchewanQ1 2009 Earning Report of Potash Corporation of Saskatchewan
Q1 2009 Earning Report of Potash Corporation of Saskatchewan
 
Q1 2009 Earning Report of Eagle Materials Inc.
 Q1 2009 Earning Report of Eagle Materials Inc. Q1 2009 Earning Report of Eagle Materials Inc.
Q1 2009 Earning Report of Eagle Materials Inc.
 
Q1 2009 Earning Report of Kennametal Inc.
Q1 2009 Earning Report of Kennametal Inc.Q1 2009 Earning Report of Kennametal Inc.
Q1 2009 Earning Report of Kennametal Inc.
 
Mountain Stream Group: Portfolio Sample - Valve Industry Market Research
Mountain Stream Group: Portfolio Sample - Valve Industry Market ResearchMountain Stream Group: Portfolio Sample - Valve Industry Market Research
Mountain Stream Group: Portfolio Sample - Valve Industry Market Research
 
Inside Intuit: Effectively Managing Social Conversations to Strengthen Custom...
Inside Intuit: Effectively Managing Social Conversations to Strengthen Custom...Inside Intuit: Effectively Managing Social Conversations to Strengthen Custom...
Inside Intuit: Effectively Managing Social Conversations to Strengthen Custom...
 
Q1 2009 Earning Report of Cit Group, Inc.
Q1 2009 Earning Report of Cit Group, Inc.Q1 2009 Earning Report of Cit Group, Inc.
Q1 2009 Earning Report of Cit Group, Inc.
 
Q1 2009 Earning Report of First Financial Bankshares, Inc.
Q1 2009 Earning Report of First Financial Bankshares, Inc.Q1 2009 Earning Report of First Financial Bankshares, Inc.
Q1 2009 Earning Report of First Financial Bankshares, Inc.
 
The Brand University - How to make a sustainable, successful brand
The Brand University - How to make a sustainable, successful brandThe Brand University - How to make a sustainable, successful brand
The Brand University - How to make a sustainable, successful brand
 

Similaire à Q1 2009 Earning Report of Arch Capital Group Ltd.

Q4 2008 Earnings Press Release and Financial Tables
Q4 2008 Earnings Press Release and Financial TablesQ4 2008 Earnings Press Release and Financial Tables
Q4 2008 Earnings Press Release and Financial Tablesfinance7
 
Q1 2009 Earning Report of Lennox International Inc.
Q1 2009 Earning Report of Lennox International Inc.Q1 2009 Earning Report of Lennox International Inc.
Q1 2009 Earning Report of Lennox International Inc.earningreport earningreport
 
Q1 2009 Earning Report of FBR Capital Markets Corp.
Q1 2009 Earning Report of FBR Capital Markets Corp.Q1 2009 Earning Report of FBR Capital Markets Corp.
Q1 2009 Earning Report of FBR Capital Markets Corp.earningreport earningreport
 
ameriprise Q408_Release
ameriprise Q408_Releaseameriprise Q408_Release
ameriprise Q408_Releasefinance43
 
allstate Quarterly Investor Information Earnings Press Release 2004 3rd
allstate Quarterly Investor Information Earnings Press Release 2004 3rdallstate Quarterly Investor Information Earnings Press Release 2004 3rd
allstate Quarterly Investor Information Earnings Press Release 2004 3rdfinance7
 
allstate Quarterly Investor Information 2005 1st Earnings Press Release
allstate Quarterly Investor Information 2005 1st Earnings Press Release allstate Quarterly Investor Information 2005 1st Earnings Press Release
allstate Quarterly Investor Information 2005 1st Earnings Press Release finance7
 
allstate Quarterly Investor Information 2005 3rd Earnings Press Release
allstate Quarterly Investor Information 2005 3rd Earnings Press Release allstate Quarterly Investor Information 2005 3rd Earnings Press Release
allstate Quarterly Investor Information 2005 3rd Earnings Press Release finance7
 
johnson & johnson Condensed Consolidated Statement of Earnings Q4 2008
johnson & johnson Condensed Consolidated Statement of Earnings Q4 2008johnson & johnson Condensed Consolidated Statement of Earnings Q4 2008
johnson & johnson Condensed Consolidated Statement of Earnings Q4 2008finance4
 
The blackstone group quarterly reports
The blackstone group quarterly reportsThe blackstone group quarterly reports
The blackstone group quarterly reportsrynbouc
 
allstate Quarterly Investor Information Earnings Press Release 2005 2nd
allstate Quarterly Investor Information Earnings Press Release 2005 2ndallstate Quarterly Investor Information Earnings Press Release 2005 2nd
allstate Quarterly Investor Information Earnings Press Release 2005 2ndfinance7
 
allstate Quarterly Investor Information 2002 3rd
allstate Quarterly Investor Information 2002 3rd allstate Quarterly Investor Information 2002 3rd
allstate Quarterly Investor Information 2002 3rd finance7
 
Release ifrs us 3 q11 final
Release ifrs us 3 q11 finalRelease ifrs us 3 q11 final
Release ifrs us 3 q11 finalEmbraer RI
 
Q2 2008 Earnings Press Release and Financial Tables
Q2 2008 Earnings Press Release and Financial TablesQ2 2008 Earnings Press Release and Financial Tables
Q2 2008 Earnings Press Release and Financial Tablesfinance7
 
Q1 2009 Earning Report of Federated Investors, Inc.
Q1 2009 Earning Report of Federated Investors, Inc.Q1 2009 Earning Report of Federated Investors, Inc.
Q1 2009 Earning Report of Federated Investors, Inc.earningreport earningreport
 

Similaire à Q1 2009 Earning Report of Arch Capital Group Ltd. (20)

Q4 2008 Earnings Press Release and Financial Tables
Q4 2008 Earnings Press Release and Financial TablesQ4 2008 Earnings Press Release and Financial Tables
Q4 2008 Earnings Press Release and Financial Tables
 
Q1 2009 Earning Report of Lennox International Inc.
Q1 2009 Earning Report of Lennox International Inc.Q1 2009 Earning Report of Lennox International Inc.
Q1 2009 Earning Report of Lennox International Inc.
 
Q1 2009 Earning Report of FBR Capital Markets Corp.
Q1 2009 Earning Report of FBR Capital Markets Corp.Q1 2009 Earning Report of FBR Capital Markets Corp.
Q1 2009 Earning Report of FBR Capital Markets Corp.
 
ameriprise Q408_Release
ameriprise Q408_Releaseameriprise Q408_Release
ameriprise Q408_Release
 
allstate Quarterly Investor Information Earnings Press Release 2004 3rd
allstate Quarterly Investor Information Earnings Press Release 2004 3rdallstate Quarterly Investor Information Earnings Press Release 2004 3rd
allstate Quarterly Investor Information Earnings Press Release 2004 3rd
 
Q1 2009 Earning Report of Baldwin & Lyons
Q1 2009 Earning Report of Baldwin & LyonsQ1 2009 Earning Report of Baldwin & Lyons
Q1 2009 Earning Report of Baldwin & Lyons
 
allstate Quarterly Investor Information 2005 1st Earnings Press Release
allstate Quarterly Investor Information 2005 1st Earnings Press Release allstate Quarterly Investor Information 2005 1st Earnings Press Release
allstate Quarterly Investor Information 2005 1st Earnings Press Release
 
allstate Quarterly Investor Information 2005 3rd Earnings Press Release
allstate Quarterly Investor Information 2005 3rd Earnings Press Release allstate Quarterly Investor Information 2005 3rd Earnings Press Release
allstate Quarterly Investor Information 2005 3rd Earnings Press Release
 
Q1 2009 Earning Report of Acergy S A
 Q1 2009 Earning Report of Acergy S A Q1 2009 Earning Report of Acergy S A
Q1 2009 Earning Report of Acergy S A
 
johnson & johnson Condensed Consolidated Statement of Earnings Q4 2008
johnson & johnson Condensed Consolidated Statement of Earnings Q4 2008johnson & johnson Condensed Consolidated Statement of Earnings Q4 2008
johnson & johnson Condensed Consolidated Statement of Earnings Q4 2008
 
The blackstone group quarterly reports
The blackstone group quarterly reportsThe blackstone group quarterly reports
The blackstone group quarterly reports
 
allstate Quarterly Investor Information Earnings Press Release 2005 2nd
allstate Quarterly Investor Information Earnings Press Release 2005 2ndallstate Quarterly Investor Information Earnings Press Release 2005 2nd
allstate Quarterly Investor Information Earnings Press Release 2005 2nd
 
allstate Quarterly Investor Information 2002 3rd
allstate Quarterly Investor Information 2002 3rd allstate Quarterly Investor Information 2002 3rd
allstate Quarterly Investor Information 2002 3rd
 
Release ifrs us 3 q11 final
Release ifrs us 3 q11 finalRelease ifrs us 3 q11 final
Release ifrs us 3 q11 final
 
Q2 2008 Earnings Press Release and Financial Tables
Q2 2008 Earnings Press Release and Financial TablesQ2 2008 Earnings Press Release and Financial Tables
Q2 2008 Earnings Press Release and Financial Tables
 
Q1 2009 Earning Report of Leggett & Platt Inc.
Q1 2009 Earning Report of Leggett & Platt Inc.Q1 2009 Earning Report of Leggett & Platt Inc.
Q1 2009 Earning Report of Leggett & Platt Inc.
 
Q1 2009 Earning Report of Ameriserv Financial
Q1 2009 Earning Report of Ameriserv FinancialQ1 2009 Earning Report of Ameriserv Financial
Q1 2009 Earning Report of Ameriserv Financial
 
Q1 2009 Earning Report of Federated Investors, Inc.
Q1 2009 Earning Report of Federated Investors, Inc.Q1 2009 Earning Report of Federated Investors, Inc.
Q1 2009 Earning Report of Federated Investors, Inc.
 
Q1 2009 Earning Report of Genuine Parts Company
Q1 2009 Earning Report of Genuine Parts CompanyQ1 2009 Earning Report of Genuine Parts Company
Q1 2009 Earning Report of Genuine Parts Company
 
Q1 2009 Earning Report of State Street Corp
Q1 2009 Earning Report of State Street CorpQ1 2009 Earning Report of State Street Corp
Q1 2009 Earning Report of State Street Corp
 

Plus de earningreport earningreport

Q3 2009 Earning Report of Boston Scientific Corporation
Q3 2009 Earning Report of Boston Scientific CorporationQ3 2009 Earning Report of Boston Scientific Corporation
Q3 2009 Earning Report of Boston Scientific Corporationearningreport earningreport
 
Q3 2009 Earning Report of Boston Scientific Corporation
Q3 2009 Earning Report of Boston Scientific CorporationQ3 2009 Earning Report of Boston Scientific Corporation
Q3 2009 Earning Report of Boston Scientific Corporationearningreport earningreport
 
Q3 2009 Earning Report of Atheros Communications, Inc.
Q3 2009 Earning Report of Atheros Communications, Inc.Q3 2009 Earning Report of Atheros Communications, Inc.
Q3 2009 Earning Report of Atheros Communications, Inc.earningreport earningreport
 
Q3 2009 Earning Report of Hancock Holding Company
Q3 2009 Earning Report of Hancock Holding CompanyQ3 2009 Earning Report of Hancock Holding Company
Q3 2009 Earning Report of Hancock Holding Companyearningreport earningreport
 
Q3 2009 Earning Report of Infosys Technologies Ltd.
Q3 2009 Earning Report of Infosys Technologies Ltd.Q3 2009 Earning Report of Infosys Technologies Ltd.
Q3 2009 Earning Report of Infosys Technologies Ltd.earningreport earningreport
 
Q3 2009 Earning Report of Marriott International
Q3 2009 Earning Report of Marriott InternationalQ3 2009 Earning Report of Marriott International
Q3 2009 Earning Report of Marriott Internationalearningreport earningreport
 
Q3 2009 Earning Report of Worthington Industries, Inc.
Q3 2009 Earning Report of Worthington Industries, Inc.Q3 2009 Earning Report of Worthington Industries, Inc.
Q3 2009 Earning Report of Worthington Industries, Inc.earningreport earningreport
 

Plus de earningreport earningreport (20)

Q3 2009 Earning Report of Banco Santander S.A.
Q3 2009 Earning Report of Banco Santander S.A.Q3 2009 Earning Report of Banco Santander S.A.
Q3 2009 Earning Report of Banco Santander S.A.
 
Q3 Earning report of Daimler AG
Q3 Earning report of Daimler AGQ3 Earning report of Daimler AG
Q3 Earning report of Daimler AG
 
Q3 Earning Report of BB&T Corporation
Q3 Earning Report of BB&T CorporationQ3 Earning Report of BB&T Corporation
Q3 Earning Report of BB&T Corporation
 
Q3 Earning Report of BB&T Corporation
Q3 Earning Report of BB&T CorporationQ3 Earning Report of BB&T Corporation
Q3 Earning Report of BB&T Corporation
 
Q3 2009 Earning Report of Brown & Brown
Q3 2009 Earning Report of Brown & BrownQ3 2009 Earning Report of Brown & Brown
Q3 2009 Earning Report of Brown & Brown
 
Q3 2009 Earning Report of Boston Scientific Corporation
Q3 2009 Earning Report of Boston Scientific CorporationQ3 2009 Earning Report of Boston Scientific Corporation
Q3 2009 Earning Report of Boston Scientific Corporation
 
Q3 2009 Earning Report of Boston Scientific Corporation
Q3 2009 Earning Report of Boston Scientific CorporationQ3 2009 Earning Report of Boston Scientific Corporation
Q3 2009 Earning Report of Boston Scientific Corporation
 
Q3 2009 Earning Report of Atheros Communications, Inc.
Q3 2009 Earning Report of Atheros Communications, Inc.Q3 2009 Earning Report of Atheros Communications, Inc.
Q3 2009 Earning Report of Atheros Communications, Inc.
 
Q3 2009 Earning Report of Apple Inc.
Q3 2009 Earning Report of Apple Inc.Q3 2009 Earning Report of Apple Inc.
Q3 2009 Earning Report of Apple Inc.
 
Q3 2009 Earning Report of Hancock Holding Company
Q3 2009 Earning Report of Hancock Holding CompanyQ3 2009 Earning Report of Hancock Holding Company
Q3 2009 Earning Report of Hancock Holding Company
 
Q3 2009 Earning Report of Walgreen Co.
Q3 2009 Earning Report of Walgreen Co.Q3 2009 Earning Report of Walgreen Co.
Q3 2009 Earning Report of Walgreen Co.
 
Q3 2009 Earning Report of Infosys Technologies Ltd.
Q3 2009 Earning Report of Infosys Technologies Ltd.Q3 2009 Earning Report of Infosys Technologies Ltd.
Q3 2009 Earning Report of Infosys Technologies Ltd.
 
Q3 2009 Earning Report of Marriott International
Q3 2009 Earning Report of Marriott InternationalQ3 2009 Earning Report of Marriott International
Q3 2009 Earning Report of Marriott International
 
Q3 2009 Earning Report of PepsiCo.
Q3 2009 Earning Report of PepsiCo.Q3 2009 Earning Report of PepsiCo.
Q3 2009 Earning Report of PepsiCo.
 
Q3 2009 Earning Report of Alcoa, Inc.
Q3 2009 Earning Report of Alcoa, Inc.Q3 2009 Earning Report of Alcoa, Inc.
Q3 2009 Earning Report of Alcoa, Inc.
 
Q3 2009 Earning Report of Pepsi Bottling Group
Q3 2009 Earning Report of Pepsi Bottling GroupQ3 2009 Earning Report of Pepsi Bottling Group
Q3 2009 Earning Report of Pepsi Bottling Group
 
Q3 2009 Earning Report of Jean Coutu Group
Q3 2009 Earning Report of Jean Coutu GroupQ3 2009 Earning Report of Jean Coutu Group
Q3 2009 Earning Report of Jean Coutu Group
 
Q3 2009 Earning Report of Minerva plc
Q3 2009 Earning Report of Minerva plcQ3 2009 Earning Report of Minerva plc
Q3 2009 Earning Report of Minerva plc
 
Q3 2009 Earning Report of Worthington Industries, Inc.
Q3 2009 Earning Report of Worthington Industries, Inc.Q3 2009 Earning Report of Worthington Industries, Inc.
Q3 2009 Earning Report of Worthington Industries, Inc.
 
Q3 2009 Earning Report of Walgreen
Q3 2009 Earning Report of WalgreenQ3 2009 Earning Report of Walgreen
Q3 2009 Earning Report of Walgreen
 

Dernier

In Sharjah ௵(+971)558539980 *_௵abortion pills now available.
In Sharjah ௵(+971)558539980 *_௵abortion pills now available.In Sharjah ௵(+971)558539980 *_௵abortion pills now available.
In Sharjah ௵(+971)558539980 *_௵abortion pills now available.hyt3577
 
Significant AI Trends for the Financial Industry in 2024 and How to Utilize Them
Significant AI Trends for the Financial Industry in 2024 and How to Utilize ThemSignificant AI Trends for the Financial Industry in 2024 and How to Utilize Them
Significant AI Trends for the Financial Industry in 2024 and How to Utilize Them360factors
 
Webinar on E-Invoicing for Fintech Belgium
Webinar on E-Invoicing for Fintech BelgiumWebinar on E-Invoicing for Fintech Belgium
Webinar on E-Invoicing for Fintech BelgiumFinTech Belgium
 
Mahendragarh Escorts 🥰 8617370543 Call Girls Offer VIP Hot Girls
Mahendragarh Escorts 🥰 8617370543 Call Girls Offer VIP Hot GirlsMahendragarh Escorts 🥰 8617370543 Call Girls Offer VIP Hot Girls
Mahendragarh Escorts 🥰 8617370543 Call Girls Offer VIP Hot GirlsDeepika Singh
 
Benefits & Risk Of Stock Loans
Benefits & Risk Of Stock LoansBenefits & Risk Of Stock Loans
Benefits & Risk Of Stock LoansMartinRowse
 
Turbhe Fantastic Escorts📞📞9833754194 Kopar Khairane Marathi Call Girls-Kopar ...
Turbhe Fantastic Escorts📞📞9833754194 Kopar Khairane Marathi Call Girls-Kopar ...Turbhe Fantastic Escorts📞📞9833754194 Kopar Khairane Marathi Call Girls-Kopar ...
Turbhe Fantastic Escorts📞📞9833754194 Kopar Khairane Marathi Call Girls-Kopar ...priyasharma62062
 
Call Girls Howrah ( 8250092165 ) Cheap rates call girls | Get low budget
Call Girls Howrah ( 8250092165 ) Cheap rates call girls | Get low budgetCall Girls Howrah ( 8250092165 ) Cheap rates call girls | Get low budget
Call Girls Howrah ( 8250092165 ) Cheap rates call girls | Get low budgetSareena Khatun
 
cost-volume-profit analysis.ppt(managerial accounting).pptx
cost-volume-profit analysis.ppt(managerial accounting).pptxcost-volume-profit analysis.ppt(managerial accounting).pptx
cost-volume-profit analysis.ppt(managerial accounting).pptxazadalisthp2020i
 
20240419-SMC-submission-Annual-Superannuation-Performance-Test-–-design-optio...
20240419-SMC-submission-Annual-Superannuation-Performance-Test-–-design-optio...20240419-SMC-submission-Annual-Superannuation-Performance-Test-–-design-optio...
20240419-SMC-submission-Annual-Superannuation-Performance-Test-–-design-optio...Henry Tapper
 
Lion One Corporate Presentation May 2024
Lion One Corporate Presentation May 2024Lion One Corporate Presentation May 2024
Lion One Corporate Presentation May 2024Adnet Communications
 
Q1 2024 Conference Call Presentation vF.pdf
Q1 2024 Conference Call Presentation vF.pdfQ1 2024 Conference Call Presentation vF.pdf
Q1 2024 Conference Call Presentation vF.pdfAdnet Communications
 
logistics industry development power point ppt.pdf
logistics industry development power point ppt.pdflogistics industry development power point ppt.pdf
logistics industry development power point ppt.pdfSalimullah13
 
Solution Manual For Financial Statement Analysis, 13th Edition By Charles H. ...
Solution Manual For Financial Statement Analysis, 13th Edition By Charles H. ...Solution Manual For Financial Statement Analysis, 13th Edition By Charles H. ...
Solution Manual For Financial Statement Analysis, 13th Edition By Charles H. ...rightmanforbloodline
 
Famous No1 Amil Baba Love marriage Astrologer Specialist Expert In Pakistan a...
Famous No1 Amil Baba Love marriage Astrologer Specialist Expert In Pakistan a...Famous No1 Amil Baba Love marriage Astrologer Specialist Expert In Pakistan a...
Famous No1 Amil Baba Love marriage Astrologer Specialist Expert In Pakistan a...janibaber266
 
Pension dashboards forum 1 May 2024 (1).pdf
Pension dashboards forum 1 May 2024 (1).pdfPension dashboards forum 1 May 2024 (1).pdf
Pension dashboards forum 1 May 2024 (1).pdfHenry Tapper
 
Fixed exchange rate and flexible exchange rate.pptx
Fixed exchange rate and flexible exchange rate.pptxFixed exchange rate and flexible exchange rate.pptx
Fixed exchange rate and flexible exchange rate.pptxTintoTom3
 
CBD Belapur((Thane)) Charming Call Girls📞❤9833754194 Kamothe Beautiful Call G...
CBD Belapur((Thane)) Charming Call Girls📞❤9833754194 Kamothe Beautiful Call G...CBD Belapur((Thane)) Charming Call Girls📞❤9833754194 Kamothe Beautiful Call G...
CBD Belapur((Thane)) Charming Call Girls📞❤9833754194 Kamothe Beautiful Call G...priyasharma62062
 
Strategic Resources May 2024 Corporate Presentation
Strategic Resources May 2024 Corporate PresentationStrategic Resources May 2024 Corporate Presentation
Strategic Resources May 2024 Corporate PresentationAdnet Communications
 

Dernier (20)

In Sharjah ௵(+971)558539980 *_௵abortion pills now available.
In Sharjah ௵(+971)558539980 *_௵abortion pills now available.In Sharjah ௵(+971)558539980 *_௵abortion pills now available.
In Sharjah ௵(+971)558539980 *_௵abortion pills now available.
 
Significant AI Trends for the Financial Industry in 2024 and How to Utilize Them
Significant AI Trends for the Financial Industry in 2024 and How to Utilize ThemSignificant AI Trends for the Financial Industry in 2024 and How to Utilize Them
Significant AI Trends for the Financial Industry in 2024 and How to Utilize Them
 
Webinar on E-Invoicing for Fintech Belgium
Webinar on E-Invoicing for Fintech BelgiumWebinar on E-Invoicing for Fintech Belgium
Webinar on E-Invoicing for Fintech Belgium
 
Mahendragarh Escorts 🥰 8617370543 Call Girls Offer VIP Hot Girls
Mahendragarh Escorts 🥰 8617370543 Call Girls Offer VIP Hot GirlsMahendragarh Escorts 🥰 8617370543 Call Girls Offer VIP Hot Girls
Mahendragarh Escorts 🥰 8617370543 Call Girls Offer VIP Hot Girls
 
Benefits & Risk Of Stock Loans
Benefits & Risk Of Stock LoansBenefits & Risk Of Stock Loans
Benefits & Risk Of Stock Loans
 
Turbhe Fantastic Escorts📞📞9833754194 Kopar Khairane Marathi Call Girls-Kopar ...
Turbhe Fantastic Escorts📞📞9833754194 Kopar Khairane Marathi Call Girls-Kopar ...Turbhe Fantastic Escorts📞📞9833754194 Kopar Khairane Marathi Call Girls-Kopar ...
Turbhe Fantastic Escorts📞📞9833754194 Kopar Khairane Marathi Call Girls-Kopar ...
 
Call Girls Howrah ( 8250092165 ) Cheap rates call girls | Get low budget
Call Girls Howrah ( 8250092165 ) Cheap rates call girls | Get low budgetCall Girls Howrah ( 8250092165 ) Cheap rates call girls | Get low budget
Call Girls Howrah ( 8250092165 ) Cheap rates call girls | Get low budget
 
cost-volume-profit analysis.ppt(managerial accounting).pptx
cost-volume-profit analysis.ppt(managerial accounting).pptxcost-volume-profit analysis.ppt(managerial accounting).pptx
cost-volume-profit analysis.ppt(managerial accounting).pptx
 
20240419-SMC-submission-Annual-Superannuation-Performance-Test-–-design-optio...
20240419-SMC-submission-Annual-Superannuation-Performance-Test-–-design-optio...20240419-SMC-submission-Annual-Superannuation-Performance-Test-–-design-optio...
20240419-SMC-submission-Annual-Superannuation-Performance-Test-–-design-optio...
 
Lion One Corporate Presentation May 2024
Lion One Corporate Presentation May 2024Lion One Corporate Presentation May 2024
Lion One Corporate Presentation May 2024
 
Q1 2024 Conference Call Presentation vF.pdf
Q1 2024 Conference Call Presentation vF.pdfQ1 2024 Conference Call Presentation vF.pdf
Q1 2024 Conference Call Presentation vF.pdf
 
logistics industry development power point ppt.pdf
logistics industry development power point ppt.pdflogistics industry development power point ppt.pdf
logistics industry development power point ppt.pdf
 
Solution Manual For Financial Statement Analysis, 13th Edition By Charles H. ...
Solution Manual For Financial Statement Analysis, 13th Edition By Charles H. ...Solution Manual For Financial Statement Analysis, 13th Edition By Charles H. ...
Solution Manual For Financial Statement Analysis, 13th Edition By Charles H. ...
 
W.D. Gann Theory Complete Information.pdf
W.D. Gann Theory Complete Information.pdfW.D. Gann Theory Complete Information.pdf
W.D. Gann Theory Complete Information.pdf
 
Famous No1 Amil Baba Love marriage Astrologer Specialist Expert In Pakistan a...
Famous No1 Amil Baba Love marriage Astrologer Specialist Expert In Pakistan a...Famous No1 Amil Baba Love marriage Astrologer Specialist Expert In Pakistan a...
Famous No1 Amil Baba Love marriage Astrologer Specialist Expert In Pakistan a...
 
Pension dashboards forum 1 May 2024 (1).pdf
Pension dashboards forum 1 May 2024 (1).pdfPension dashboards forum 1 May 2024 (1).pdf
Pension dashboards forum 1 May 2024 (1).pdf
 
Fixed exchange rate and flexible exchange rate.pptx
Fixed exchange rate and flexible exchange rate.pptxFixed exchange rate and flexible exchange rate.pptx
Fixed exchange rate and flexible exchange rate.pptx
 
CBD Belapur((Thane)) Charming Call Girls📞❤9833754194 Kamothe Beautiful Call G...
CBD Belapur((Thane)) Charming Call Girls📞❤9833754194 Kamothe Beautiful Call G...CBD Belapur((Thane)) Charming Call Girls📞❤9833754194 Kamothe Beautiful Call G...
CBD Belapur((Thane)) Charming Call Girls📞❤9833754194 Kamothe Beautiful Call G...
 
Strategic Resources May 2024 Corporate Presentation
Strategic Resources May 2024 Corporate PresentationStrategic Resources May 2024 Corporate Presentation
Strategic Resources May 2024 Corporate Presentation
 
Call Girls in Tilak Nagar (delhi) call me [🔝9953056974🔝] escort service 24X7
Call Girls in Tilak Nagar (delhi) call me [🔝9953056974🔝] escort service 24X7Call Girls in Tilak Nagar (delhi) call me [🔝9953056974🔝] escort service 24X7
Call Girls in Tilak Nagar (delhi) call me [🔝9953056974🔝] escort service 24X7
 

Q1 2009 Earning Report of Arch Capital Group Ltd.

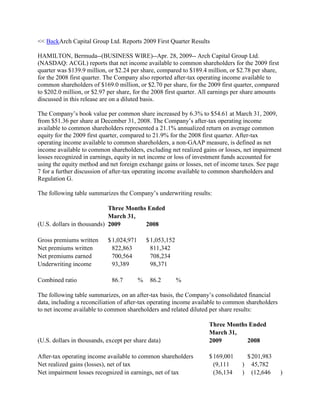
  • 1. << BackArch Capital Group Ltd. Reports 2009 First Quarter Results HAMILTON, Bermuda--(BUSINESS WIRE)--Apr. 28, 2009-- Arch Capital Group Ltd. (NASDAQ: ACGL) reports that net income available to common shareholders for the 2009 first quarter was $139.9 million, or $2.24 per share, compared to $189.4 million, or $2.78 per share, for the 2008 first quarter. The Company also reported after-tax operating income available to common shareholders of $169.0 million, or $2.70 per share, for the 2009 first quarter, compared to $202.0 million, or $2.97 per share, for the 2008 first quarter. All earnings per share amounts discussed in this release are on a diluted basis. The Company‘s book value per common share increased by 6.3% to $54.61 at March 31, 2009, from $51.36 per share at December 31, 2008. The Company‘s after-tax operating income available to common shareholders represented a 21.1% annualized return on average common equity for the 2009 first quarter, compared to 21.9% for the 2008 first quarter. After-tax operating income available to common shareholders, a non-GAAP measure, is defined as net income available to common shareholders, excluding net realized gains or losses, net impairment losses recognized in earnings, equity in net income or loss of investment funds accounted for using the equity method and net foreign exchange gains or losses, net of income taxes. See page 7 for a further discussion of after-tax operating income available to common shareholders and Regulation G. The following table summarizes the Company‘s underwriting results: Three Months Ended March 31, (U.S. dollars in thousands) 2009 2008 Gross premiums written $ 1,024,971 $ 1,053,152 Net premiums written 822,863 811,342 Net premiums earned 700,564 708,234 Underwriting income 93,389 98,371 Combined ratio 86.7 % 86.2 % The following table summarizes, on an after-tax basis, the Company‘s consolidated financial data, including a reconciliation of after-tax operating income available to common shareholders to net income available to common shareholders and related diluted per share results: Three Months Ended March 31, (U.S. dollars in thousands, except per share data) 2009 2008 After-tax operating income available to common shareholders $ 169,001 $ 201,983 Net realized gains (losses), net of tax (9,111 ) 45,782 Net impairment losses recognized in earnings, net of tax (36,134 ) (12,646 )
  • 2. Equity in net income (loss) of investment funds accounted for (9,581 ) (22,313 ) using the equity method, net of tax Net foreign exchange gains (losses), net of tax 25,694 (23,384 ) Net income available to common shareholders $ 139,869 $ 189,422 Diluted per common share results: After-tax operating income available to common shareholders $ 2.70 $ 2.97 Net realized gains (losses), net of tax (0.14 ) 0.67 Net impairment losses recognized in earnings, net of tax (0.58 ) (0.19 ) Equity in net income (loss) of investment funds accounted for (0.15 ) (0.33 ) using the equity method, net of tax Net foreign exchange gains (losses), net of tax 0.41 (0.34 ) Net income available to common shareholders $ 2.24 $ 2.78 Weighted average common shares and common share equivalents 62,559,969 68,019,413 outstanding – diluted The combined ratio represents a measure of underwriting profitability, excluding investment income, and is the sum of the loss ratio and expense ratio. A combined ratio under 100% represents an underwriting profit and a combined ratio over 100% represents an underwriting loss. For the 2009 first quarter, the combined ratio of the Company‘s insurance and reinsurance subsidiaries consisted of a loss ratio of 57.2% and an underwriting expense ratio of 29.5%, compared to a loss ratio of 57.1% and an underwriting expense ratio of 29.1% for the 2008 first quarter. The loss ratio of 57.2% for the 2009 first quarter was comprised of 45.5 points of paid losses (including 5.0 points related to 2005 and 2008 named catastrophic events), 4.4 points related to reserves for reported losses and 7.3 points related to incurred but not reported reserves. In establishing the reserves for losses and loss adjustment expenses, the Company has made various assumptions relating to the pricing of its reinsurance contracts and insurance policies and also has considered available historical industry experience and current industry conditions. The Company‘s reserving method to date has been, to a large extent, the expected loss method, which is commonly applied when limited loss experience exists. Any estimates and assumptions made as part of the reserving process could prove to be inaccurate due to several factors, including the fact that relatively limited historical information has been reported to the Company through March 31, 2009. For a discussion of underwriting activities and a review of the Company‘s results by operating segment, see ―Segment Information‖ in the Supplemental Financial Information section of this release. The Company‘s investment portfolio continues to be comprised primarily of high quality fixed income securities, with no direct holdings of collateralized debt obligations (CDOs), collateralized loan obligations (CLOs) or credit default swaps (CDSs). The Company‘s portfolio does not include ownership of common stock or preferred stock of any publicly-traded issuers and essentially includes no investments in hedge funds or private equity funds. The average credit quality rating of the portfolio remained at ―AA+‖ at March 31, 2009 and the average effective duration was 3.02 years at March 31, 2009, compared to 3.62 years at December 31,
  • 3. 2008. Including the effects of foreign exchange, total return on the Company‘s investment portfolio was approximately 1.09% for the 2009 first quarter, compared to 0.95% for the 2008 first quarter. Excluding foreign exchange, total return was 1.23% for the 2009 first quarter, compared to 0.71% for the 2008 first quarter. Net investment income for the 2009 first quarter was $95.9 million, or $1.53 per share, compared to $111.7 million, or $1.79 per share, in the 2008 fourth quarter and $122.2 million, or $1.80 per share, in the 2008 first quarter. Contributing to the decrease in investment income compared to the 2008 fourth quarter were a decline in the portfolio‘s book yield from 4.55% at year-end to 4.17%, due in part to lower available yields and a reduction in the portfolio‘s effective duration. In addition, $3.0 million of the decrease from the 2008 fourth quarter related to reductions to the cost basis of treasury inflation protected securities (TIPS) in the 2009 first quarter which resulted from a decline in the consumer price index (CPI) during the period. Although TIPS investments negatively impacted net investment income, they generated a positive total return for the quarter. The Company has now reduced its exposure to TIPS as of March 31, 2009. Income from the Company‘s securities lending program also declined by $2.4 million from the 2008 fourth quarter due to the increased supply of U.S. Treasuries and lower federal funds rates in effect during the 2009 first quarter. The comparability of net investment income during the 2009 and 2008 first quarters was also influenced by the Company‘s share repurchase program described below. In addition, as previously disclosed, the 2008 amount included $3.4 million of interest income related to a favorable arbitration decision. The pre-tax investment income yield was 3.82% for the 2009 first quarter, compared to 4.50% for the 2008 fourth quarter and 4.88% (excluding the arbitration interest) for the 2008 first quarter. During the 2009 first quarter, the Company adopted FASB Staff Position No. FAS 115-2, ―Recognition and Presentation of Other-Than-Temporary Impairments‖ (―FSP 115-2‖). The new accounting guidance revises the recognition and reporting requirements for other-than-temporary impairments (OTTI) on the Company‘s debt securities. The Company reviewed OTTI provisions it had recorded through realized losses on securities held at December 31, 2008 ($171.1 million) and estimated the portion related to credit events (i.e., where the present value of cash flows expected to be collected are lower than the amortized cost basis of the security) and the portion related to all other factors (e.g., interest rates, market conditions, etc.). The Company determined that $109.1 million of the OTTI previously recorded related to specific credit events and $62.0 million related to all other factors. Under FSP 115-2, the Company increased the amortized cost basis of these debt securities by $62.0 million and recorded a cumulative effect adjustment, net of tax, in its shareholders‘ equity section. The cumulative effect adjustment had no effect on total shareholders‘ equity as it increased retained earnings and reduced accumulated other comprehensive income. Under the new accounting guidance, the amount of the credit loss portion of OTTI is recorded through earnings while the portion attributable to all other factors is recorded as a component of other comprehensive income in the equity section. In the 2009 first quarter, the Company recorded $36.1 million of net impairment losses through earnings, while the portion of loss recognized as a component of other comprehensive income on these securities was approximately $56.9 million. The net impairment losses primarily resulted from changes to expected recovery values during the period on structured securities (mortgage and asset backed)
  • 4. along with the winding down and liquidation of a Euro-denominated bank loan fund for which limited recovery value is expected. The Company recorded $9.6 million of net losses related to investment funds accounted for using the equity method for the 2009 first quarter, compared to net losses of $22.3 million for the 2008 first quarter. Due to the ownership structure of these investment funds, which invest in fixed maturity securities, the Company uses the equity method. In applying the equity method, these investments are initially recorded at cost and are subsequently adjusted based on the Company‘s proportionate share of the net income or loss of the funds (which include changes in the market value of the underlying securities in the funds). This method of accounting is different from the way the Company accounts for its other fixed maturity securities. Investment funds accounted for using the equity method totaled $293.5 million at March 31, 2009, compared to $301.0 million at December 31, 2008. The Company‘s portfolio includes $331.3 million of investments in U.S. and Euro-denominated bank loan funds, which are primarily reflected in the investment funds accounted for using the equity method shown above. Please refer to the Company‘s Financial Supplement dated March 31, 2009, which is posted on the Company‘s website at http://www.archcapgroup.bm/EarningsReleases.aspx for further information on the Company‘s investment portfolio. The Company‘s effective tax rates on income before income taxes and pre-tax operating income for the 2009 first quarter were 6.1% and 3.3%, respectively, compared to 3.9% and 2.5% for the 2008 first quarter. The Company‘s effective tax rates may fluctuate from period to period based on the relative mix of income reported by jurisdiction primarily due to the varying tax rates in each jurisdiction. The Company‘s quarterly tax provision is adjusted to reflect changes in its expected annual effective tax rates, if any. The Company currently expects that its annual effective tax rate on pre-tax operating income available to common shareholders for the year ended December 31, 2009 will be in the range of 2.5% to 4.5%. In addition, the Company‘s Bermuda-based reinsurer incurs federal excise taxes for premiums assumed on U.S. risks. The Company incurred $3.3 million of federal excise taxes in the 2009 and 2008 first quarters. Such amounts are reflected as acquisition expenses in the Company‘s consolidated statements of income. Net foreign exchange gains for the 2009 first quarter of $25.2 million consisted of net unrealized gains of $25.9 million and net realized losses of $0.7 million, compared to net foreign exchange losses for the 2008 first quarter of $23.6 million which consisted of net unrealized losses of $22.3 million and net realized losses of $1.3 million. Net unrealized foreign exchange gains or losses result from the effects of revaluing the Company‘s net insurance liabilities required to be settled in foreign currencies at each balance sheet date. The Company holds investments in foreign currencies which are intended to mitigate its exposure to foreign currency fluctuations in its net insurance liabilities. However, changes in the value of such investments due to foreign currency rate movements are reflected as a direct increase or decrease to shareholders‘ equity and are not included in the statements of income. Diluted weighted average common shares and common share equivalents outstanding, used in the calculation of after-tax operating income and net income per common share, were 62.6 million for the 2009 first quarter, compared to 68.0 million for the 2008 first quarter. The lower
  • 5. level of weighted average shares outstanding in the 2009 first quarter was primarily due to the impact of share repurchases as discussed below. The board of directors of ACGL has authorized the investment of up to $1.5 billion in ACGL‘s common shares through a share repurchase program. Repurchases under the program may be effected from time to time in open market or privately negotiated transactions through February 2010. In March 2009, ACGL purchased $1.6 million of common shares through the share repurchase program. Since the inception of the share repurchase program through March 31, 2009, ACGL has repurchased approximately 15.3 million common shares for an aggregate purchase price of $1.05 billion. At March 31, 2009, approximately $448.3 million of repurchases were available under the share repurchase program. As a result of the share repurchase transactions to date, book value per common share was reduced by $2.86 per share at March 31, 2009, compared to $3.52 at December 31, 2008, while weighted average shares outstanding were reduced by 15.3 million for the 2009 first quarter, compared to 9.4 million shares for the 2008 first quarter. At March 31, 2009, the Company‘s capital of $4.03 billion consisted of $300.0 million of senior notes, representing 7.4% of the total, $100.0 million of revolving credit agreement borrowings due in August 2011, representing 2.5% of the total, $325.0 million of preferred shares, representing 8.1% of the total, and common shareholders‘ equity of $3.31 billion, representing the balance. At December 31, 2008, the Company‘s capital of $3.83 billion consisted of $300.0 million of senior notes, representing 7.8% of the total, $100.0 million of revolving credit agreement borrowings due in August 2011, representing 2.6% of the total, $325.0 million of preferred shares, representing 8.5% of the total, and common shareholders‘ equity of $3.11 billion, representing the balance. The increase in total capital during the 2009 first quarter was primarily attributable to net income during the period. The Company will hold a conference call for investors and analysts at 11:00 a.m. Eastern Time on Wednesday, April 29, 2009. A live webcast of this call will be available via the Investor Relations – Events and Presentations section of the Company's website at http://www.archcapgroup.bm. A telephone replay of the conference call also will be available beginning on April 29 at 1:00 p.m. Eastern Time until May 6, 2009 at midnight Eastern Time. To access the replay, domestic callers should dial 888-286-8010 (passcode 14362334), and international callers should dial 617-801-6888 (passcode 14362334). Please refer to the Company‘s Financial Supplement dated March 31, 2009, which is posted on the Company‘s website at http://www.archcapgroup.bm/EarningsReleases.aspx. The Financial Supplement provides additional detail regarding the financial performance of the Company. Arch Capital Group Ltd., a Bermuda-based company with over $4.0 billion in capital at March 31, 2009, provides insurance and reinsurance on a worldwide basis through its wholly owned subsidiaries. Cautionary Note Regarding Forward-Looking Statements
  • 6. The Private Securities Litigation Reform Act of 1995 (―PLSRA‖) provides a ―safe harbor‖ for forward-looking statements. This release or any other written or oral statements made by or on behalf of the Company may include forward-looking statements, which reflect the Company‘s current views with respect to future events and financial performance. All statements other than statements of historical fact included in or incorporated by reference in this release are forward- looking statements. Forward-looking statements, for purposes of the PLSRA or otherwise, can generally be identified by the use of forward-looking terminology such as ―may,‖ ―will,‖ ―expect,‖ ―intend,‖ ―estimate,‖ ―anticipate,‖ ―believe‖ or ―continue‖ and similar statements of a future or forward-looking nature or their negative or variations or similar terminology. Forward-looking statements involve the Company‘s current assessment of risks and uncertainties. Actual events and results may differ materially from those expressed or implied in these statements. Important factors that could cause actual events or results to differ materially from those indicated in such statements are discussed below and elsewhere in this release and in the Company‘s periodic reports filed with the Securities and Exchange Commission (the ―SEC‖), and include: the Company‘s ability to successfully implement its business strategy during ―soft‖ as well as ―hard‖ markets; acceptance of the Company‘s business strategy, security and financial condition by rating agencies and regulators, as well as by brokers and its insureds and reinsureds; the Company‘s ability to maintain or improve its ratings, which may be affected by its ability to raise additional equity or debt financings, by ratings agencies‘ existing or new policies and practices, as well as other factors described herein; general economic and market conditions (including inflation, interest rates, foreign currency exchange rates and prevailing credit terms) and conditions specific to the reinsurance and insurance markets in which the Company operates; competition, including increased competition, on the basis of pricing, capacity, coverage terms or other factors; the Company‘s ability to successfully integrate, establish and maintain operating procedures (including the implementation of improved computerized systems and programs to replace and support manual systems) to effectively support its underwriting initiatives and to develop accurate actuarial data; the loss of key personnel; the integration of businesses the Company has acquired or may acquire into its existing operations; accuracy of those estimates and judgments utilized in the preparation of the Company‘s financial statements, including those related to revenue recognition, insurance and other reserves, reinsurance recoverables, investment valuations, intangible assets, bad debts, income taxes, contingencies and litigation, and any determination to use the deposit method of accounting, which for a relatively new insurance and reinsurance company, like the Company, are even more difficult to make than those made in a mature company since relatively limited historical information has been reported to the Company through March 31, 2009;
  • 7. greater than expected loss ratios on business written by the Company and adverse development on claim and/or claim expense liabilities related to business written by its insurance and reinsurance subsidiaries; severity and/or frequency of losses; claims for natural or man-made catastrophic events in the Company‘s insurance or reinsurance business could cause large losses and substantial volatility in its results of operations; acts of terrorism, political unrest and other hostilities or other unforecasted and unpredictable events; losses relating to aviation business and business produced by a certain managing underwriting agency for which the Company may be liable to the purchaser of its prior reinsurance business or to others in connection with the May 5, 2000 asset sale described in the Company‘s periodic reports filed with the SEC; availability to the Company of reinsurance to manage its gross and net exposures and the cost of such reinsurance; the failure of reinsurers, managing general agents, third party administrators or others to meet their obligations to the Company; the timing of loss payments being faster or the receipt of reinsurance recoverables being slower than anticipated by the Company; the Company‘s investment performance; material differences between actual and expected assessments for guaranty funds and mandatory pooling arrangements; changes in accounting principles or policies or in the Company‘s application of such accounting principles or policies; changes in the political environment of certain countries in which the Company operates or underwrites business; statutory or regulatory developments, including as to tax policy matters and insurance and other regulatory matters such as the adoption of proposed legislation that would affect Bermuda-headquartered companies and/or Bermuda-based insurers or reinsurers and/or changes in regulations or tax laws applicable to the Company, its subsidiaries, brokers or customers; and the other matters set forth under Item 1A ―Risk Factors‖, Item 7 ―Management‘s Discussion and Analysis of Financial Condition and Results of Operations‖ and other sections of the Company‘s Annual Report on Form 10-K, as well as the other factors set forth in the Company‘s other documents on file with the SEC, and management‘s response to any of the aforementioned factors. In addition, other general factors could affect the Company‘s results, including developments in the world‘s financial and capital markets and its access to such markets. All subsequent written and oral forward-looking statements attributable to the Company or persons acting on its behalf are expressly qualified in their entirety by these cautionary statements. The foregoing review of important factors should not be construed as exhaustive and should be read in conjunction with other cautionary statements that are included herein or elsewhere. The Company undertakes no obligation to publicly update or revise any forward- looking statement, whether as a result of new information, future events or otherwise.
  • 8. Comment on Regulation G Throughout this release, the Company presents its operations in the way it believes will be the most meaningful and useful to investors, analysts, rating agencies and others who use the Company‘s financial information in evaluating the performance of the Company. This presentation includes the use of after-tax operating income available to common shareholders, which is defined as net income available to common shareholders, excluding net realized gains or losses, net impairment losses included in earnings, equity in net income or loss of investment funds accounted for using the equity method and net foreign exchange gains or losses, net of income taxes. The presentation of after-tax operating income available to common shareholders is a ―non-GAAP financial measure‖ as defined in Regulation G. The reconciliation of such measure to net income available to common shareholders (the most directly comparable GAAP financial measure) in accordance with Regulation G is included on page 2 of this release. The Company believes that net realized gains or losses, net impairment losses included in earnings, equity in net income or loss of investment funds accounted for using the equity method and net foreign exchange gains or losses in any particular period are not indicative of the performance of, or trends in, the Company‘s business performance. Although net realized gains or losses, net impairment losses included in earnings, equity in net income or loss of investment funds accounted for using the equity method and net foreign exchange gains or losses are an integral part of the Company‘s operations, the decision to realize investment gains or losses, the recognition of net impairment losses, the recognition of equity in net income or loss of investment funds accounted for using the equity method and the recognition of foreign exchange gains or losses are independent of the insurance underwriting process and result, in large part, from general economic and financial market conditions. Furthermore, certain users of the Company‘s financial information believe that, for many companies, the timing of the realization of investment gains or losses is largely opportunistic. In addition, net impairment losses included in earnings on the Company‘s investments represent other-than-temporary declines in expected recovery values on securities without actual realization. The use of the equity method on certain of the Company‘s investments in certain funds that invest in fixed maturity securities is driven by the ownership structure of such funds (either limited partnerships or limited liability companies). In applying the equity method, these investments are initially recorded at cost and are subsequently adjusted based on the Company‘s proportionate share of the net income or loss of the funds (which include changes in the market value of the underlying securities in the funds). This method of accounting is different from the way the Company accounts for its other fixed maturity securities and the timing of the recognition of equity in net income or loss of investment funds accounted for using the equity method may differ from gains or losses in the future upon sale or maturity of such investments. Due to these reasons, the Company excludes net realized gains or losses, equity in net income or loss of investment funds accounted for using the equity method and net foreign exchange gains or losses from the calculation of after-tax operating income available to common shareholders. The Company believes that showing net income available to common shareholders exclusive of the items referred to above reflects the underlying fundamentals of the Company‘s business since the Company evaluates the performance of and manages its business to produce an underwriting profit. In addition to presenting net income available to common shareholders, the Company
  • 9. believes that this presentation enables investors and other users of the Company‘s financial information to analyze the Company‘s performance in a manner similar to how the Company‘s management analyzes performance. The Company also believes that this measure follows industry practice and, therefore, allows the users of the Company‘s financial information to compare the Company‘s performance with its industry peer group. The Company believes that the equity analysts and certain rating agencies which follow the Company and the insurance industry as a whole generally exclude these items from their analyses for the same reasons. ARCH CAPITAL GROUP LTD. AND SUBSIDIARIES SUPPLEMENTAL FINANCIAL INFORMATION Book Value Per Common Share and Share Repurchases March 31, December 31, (U.S. dollars in thousands, except share data) 2009 2008 Calculation of book value per common share: Total shareholders‘ equity $ 3,630,396 $ 3,432,965 Less preferred shareholders‘ equity (325,000 ) (325,000 ) Common shareholders‘ equity $ 3,305,396 $ 3,107,965 Common shares outstanding (1) 60,532,222 60,511,974 Book value per common share $ 54.61 $ 51.36 Three Months Cumulative Ended March 31, March 31, (U.S. dollars in thousands, except share data) 2009 2008 2009 Effect of share repurchases: Aggregate purchase price of shares repurchased $ 1,552 $ 189,843 $ 1,051,748 Shares repurchased 33,305 2,749,909 15,289,594 Average price per share repurchased $ 46.60 $ 69.04 $ 68.79 Estimated net accretive (dilutive) impact on ending book $ 0.01 ($0.49 ) ($2.86 ) value per common share (2) Estimated net accretive impact on diluted earnings per $ 0.40 $ 0.26 share (3) (1) Excludes the effects of 5,111,344 and 5,131,135 stock options and 347,019 and 412,622 restricted stock units outstanding at March 31, 2009 and December 31, 2008, respectively. (2) As the average price per share repurchased during the 2009 first quarter was lower than the book value per common share, the repurchase of shares during the period increased book value per common share during the 2009 first quarter. For the 2008 first quarter and cumulative
  • 10. through March 31, 2009, the average price per share repurchased was higher than the book value per common share and, accordingly, decreased book value per common share. (3) The estimated impact on diluted earnings per share was calculated comparing reported results versus (i) net income (loss) per share plus an estimate of lost net investment income on the cumulative share repurchases divided by (ii) weighted average diluted shares outstanding excluding the weighted average impact of cumulative share repurchases. The impact of cumulative share repurchases was accretive to diluted earnings per share in the periods presented. Investment Information Three Months Ended March 31, (U.S. dollars in thousands, except share data) 2009 2008 Net investment income: Total $ 95,882 $ 122,193 Per share $ 1.53 $ 1.80 Pre-tax investment income yield (at amortized cost) 3.82 % 4.88 % After-tax investment income yield (at amortized cost) 3.70 % 4.75 % Cash flow from operations $ 294,803 $ 334,545 On a consolidated basis, the Company‘s aggregate investable assets totaled $10.3 billion at March 31, 2009, compared to $10.0 billion at December 31, 2008, as detailed in the table below: December March 31, 31, (U.S. dollars in thousands) 2009 2008 Investable assets: Fixed maturities available for sale, at market value $ 8,540,653 $ 8,122,221 Fixed maturities pledged under securities lending agreements, at 503,449 626,501 market value (1) Total fixed maturities 9,044,102 8,748,722 Short-term investments available for sale, at market value 749,708 479,586 Short-term investments pledged under securities lending 56,242 101,564 agreements, at market value (1) Cash 244,037 251,739 Other investments (2) Fixed income mutual funds 32,912 39,858 Privately held securities and other 72,076 69,743
  • 11. Investment funds accounted for using the equity method (3) 293,452 301,027 Securities transactions entered into but not settled at the balance (241,836 ) (18,236 ) sheet date Total investable assets (1) $ 10,250,693 $ 9,974,003 Fixed income portfolio (1): Average effective duration (in years) 3.02 3.62 Average credit quality AA+ AA+ Imbedded book yield (before investment expenses) 4.17 % 4.55 % (1) In securities lending transactions, the Company receives collateral in excess of the market value of the fixed maturities and short-term investments pledged under securities lending agreements. For purposes of this table, the Company has excluded the collateral received and reinvested at March 31, 2009 and December 31, 2008 of $550.8 million and $730.2 million, respectively, which is reflected as ―investment of funds received under securities lending agreements, at market value‖ and included the $559.7 million and $728.1 million, respectively, of ―fixed maturities and short-term investments pledged under securities lending agreements, at market value.‖ (2) Other investments include (i) mutual funds which invest in fixed maturity securities and international equity index funds; and (ii) privately held securities and other which include the Company‘s investment in Aeolus LP and other privately held securities. (3) The Company‘s investment portfolio includes certain funds that invest in fixed maturity securities which, due to the ownership structure of the funds, are accounted for by the Company using the equity method. In applying the equity method, these investments are initially recorded at cost and are subsequently adjusted based on the Company‘s proportionate share of the net income or loss of the funds (which include changes in the market value of the underlying securities in the funds). Changes in the carrying value of such investments are recorded as ‗Equity in net income (loss) of investment funds accounted for using the equity method‘ rather than as an unrealized gain or loss component of accumulated other comprehensive income in shareholders‘ equity as are changes in the carrying value of the Company‘s other fixed income investments. For further information on the Company‘s investment portfolio, please refer to the Company‘s Financial Supplement dated March 31, 2009, which is posted on the Company‘s website at http://www.archcapgroup.bm/EarningsReleases.aspx. Selected Information on Losses and Loss Adjustment Expenses Three Months Ended March 31, (U.S. dollars in thousands) 2009 2008 Components of losses and loss adjustment expenses
  • 12. Paid losses and loss adjustment expenses $ 318,541 $ 249,499 Increase in unpaid losses and loss adjustment expenses 82,001 154,918 Total losses and loss adjustment expenses $ 400,542 $ 404,417 Estimated net (favorable) adverse development in prior year loss reserves, net of related adjustments Net impact on underwriting results: Insurance ($8,178 ) ($5,610 ) Reinsurance (39,693 ) (51,050 ) Total ($47,871 ) ($56,660 ) Impact on losses and loss adjustment expenses: Insurance ($9,126 ) ($5,776 ) Reinsurance (42,016 ) (51,086 ) Total ($51,142 ) ($56,862 ) Impact on acquisition expenses: Insurance $ 948 $ 166 Reinsurance 2,323 36 Total $ 3,271 $ 202 Impact on combined ratio: Insurance (2.0 %) (1.3 %) Reinsurance (13.3 %) (17.7 %) Total (6.8 %) (8.0 %) Impact on loss ratio: Insurance (2.3 %) (1.4 %) Reinsurance (14.0 %) (17.7 %) Total (7.3 %) (8.0 %) Impact on acquisition expense ratio: Insurance 0.3 % 0.1 % Reinsurance 0.7 % 0.0 % Total 0.5 % 0.0 % Estimated net losses incurred from current accident year catastrophic events (1) $— Insurance $ 20,300 Reinsurance 8,012 5,774 Total $ 8,012 $ 26,074
  • 13. Impact on loss ratio: — Insurance 4.8 % Reinsurance 2.7 % 2.0 % Total 1.1 % 3.7 % (1) Equals estimated losses from catastrophic events occurring in the current accident year, net of reinsurance and reinstatement premiums. Amounts shown for the insurance segment are for named catastrophic events only. Amounts shown for the reinsurance segment include (i) named events with over $5 million of losses incurred by its Bermuda and Europe operations and (ii) all catastrophe losses incurred by its U.S. operations. Segment Information For additional detail regarding the Company‘s operating segments, please refer to the Company‘s Financial Supplement dated March 31, 2009 on the Company‘s website at http://www.archcapgroup.bm/EarningsReleases.aspx. Discussion of 2009 First Quarter Performance Insurance Segment Three Months Ended March 31, (U.S. dollars in thousands) 2009 2008 Gross premiums written $ 638,409 $ 626,348 Net premiums written 441,586 402,764 Net premiums earned 401,097 419,100 Underwriting income 11,421 7,153 Loss ratio 67.3 % 68.6 % Acquisition expense ratio 14.1 % 12.2 % Other operating expense ratio 15.7 % 17.6 % Combined ratio 97.1 % 98.4 % Gross premiums written by the insurance segment in the 2009 first quarter were 1.9% higher than in the 2008 first quarter, with growth in programs, national accounts casualty and executive assurance business. The increase in programs and national accounts casualty business primarily resulted from new business while the increase in executive assurance business primarily resulted from renewal rate increases. Such amounts were partially offset by reductions in casualty, construction and professional liability business as the insurance segment continued to maintain underwriting discipline in response to the current market environment. The higher net premiums written growth rate of 9.6% primarily resulted from changes in reinsurance usage and the impact of changes in the mix of business. Net premiums earned by the insurance segment in the 2009
  • 14. first quarter were 4.3% lower than in the 2008 first quarter, and reflect changes in net premiums written over the previous five quarters. The loss ratio for the insurance segment was 67.3% in the 2009 first quarter, compared to 68.6% in the 2008 first quarter. The 2009 first quarter loss ratio reflected a 2.3 point reduction related to estimated net favorable development in prior year loss reserves, compared to 1.4 points in the 2008 first quarter. The estimated net favorable development in the 2009 first quarter was primarily in medium-tail lines and mainly resulted from better than expected claims emergence. The 2009 first quarter loss ratio did not include any significant catastrophic activity while the 2008 first quarter loss ratio included 4.8 points related to the Australian floods. The insurance segment‘s loss ratio in the 2009 first quarter reflected an increase in expected loss ratios across a number of lines of business primarily due to the anticipated impact of rate changes and changes in the mix of business. The insurance segment‘s underwriting expense ratio was 29.8% in the 2009 and 2008 first quarters. The acquisition expense ratio was 14.1% for the 2009 first quarter, compared to 12.2% for the 2008 first quarter. The acquisition expense ratio is influenced by, among other things, (1) the amount of ceding commissions received from unaffiliated reinsurers, (2) the amount of business written on a surplus lines (non-admitted) basis and (3) mix of business. In addition, the 2009 first quarter loss ratio reflected 0.3 points related to estimated net favorable development in prior year loss reserves, compared to 0.1 points in the 2008 first quarter. The comparison of the 2009 first quarter and 2008 first quarter acquisition expense ratios reflects changes in the form of reinsurance ceded and the mix of business. The insurance segment‘s other operating expense ratio was 15.7% for the 2009 first quarter, compared to 17.6% in the 2008 first quarter, with the decrease primarily attributable to non-recurring adjustments in compensation costs in the 2009 first quarter. In addition, the 2009 first quarter operating expense ratio reflects the benefits of the insurance segment‘s expense management plan implemented in 2008, which included office relocation and personnel and other expense saving initiatives. Reinsurance Segment Three Months Ended March 31, (U.S. dollars in thousands) 2009 2008 Gross premiums written $ 390,129 $ 433,827 Net premiums written 381,277 408,578 Net premiums earned 299,467 289,134 Underwriting income 81,968 91,218 Loss ratio 43.6 % 40.5 % Acquisition expense ratio 23.0 % 21.7 % Other operating expense ratio 6.1 % 6.3 % Combined ratio 72.7 % 68.5 %
  • 15. Gross premiums written by the reinsurance segment in the 2009 first quarter were 10.1% lower than in the 2009 first quarter, primarily due to reductions in other specialty and property catastrophe business written in the 2009 first quarter. The decrease in other specialty was primarily due to the non-renewal of a non-standard auto treaty, while the lower level of property catastrophe business resulted from the impact of non-renewals of a small number of contracts. The decreases were partially offset by an increase in writings by the reinsurance segment‘s property facultative operation, which contributed $12.4 million of additional gross premiums written in the 2009 first quarter compared to the 2008 first quarter. Ceded premiums written by the reinsurance segment were 2.3% of gross premiums written for the 2009 first quarter, compared to 5.8% for the 2008 first quarter. In the 2009 first quarter, Arch Reinsurance Ltd., the Company‘s Bermuda-based reinsurer, ceded $3.5 million of premiums written, or 0.9%, under a quota share reinsurance treaty to Flatiron Re Ltd., compared to $18.4 million, or 4.2%, in the 2008 first quarter. Commission income from the treaty (in excess of the reimbursement of direct acquisition expenses) reduced the reinsurance segment‘s acquisition expense ratio by 0.8 points in the 2009 first quarter, compared to 3.3 points in the 2008 first quarter. Net premiums written by the reinsurance segment in the 2009 first quarter were 6.7% lower than in the 2008 first quarter, primarily due to the items noted above. Net premiums earned in the 2009 first quarter were 3.6% higher than in the 2008 first quarter, and reflect changes in net premiums written over the previous five quarters, including the mix and type of business written. The reinsurance segment‘s loss ratio was 43.6% in the 2009 first quarter, compared to 40.5% for the 2008 first quarter. The loss ratio for the 2009 first quarter reflected a 14.0 point reduction related to estimated net favorable development in prior year loss reserves, compared to a 17.7 point reduction in the 2008 first quarter. The estimated net favorable development in the 2009 first quarter primarily resulted from better than anticipated claims emergence in older underwriting years. The 2009 first quarter loss ratio also reflected approximately 2.7 points of catastrophic activity, while the 2008 first quarter loss ratio reflected approximately 2.0 points of catastrophic activity. The reinsurance segment‘s 2009 first quarter loss ratio also reflected an increase in expected loss ratios in a number of lines of business primarily due to the anticipated impact of rate changes as well as changes in the mix of business. The underwriting expense ratio for the reinsurance segment was 29.1% in the 2009 first quarter, compared to 28.0% in the 2008 first quarter. The acquisition expense ratio for the 2009 first quarter was 23.0%, compared to 21.7% for the 2008 first quarter, with the increase primarily due to a lower level of commission income from the Treaty with Flatiron noted above. In addition, the 2009 first quarter loss ratio reflected 0.7 points related to estimated net favorable development in prior year loss reserves. The comparison of the 2009 first quarter and 2008 first quarter acquisition expense ratios is influenced by, among other things, the mix and type of business written and earned and the level of ceding commission income. The reinsurance segment‘s other operating expense ratio was 6.1% for the 2009 first quarter, compared to 6.3% for the 2008 first quarter. The decrease in the operating expense ratio primarily related to a higher level of net premiums earned in the 2009 first quarter.
  • 16. ARCH CAPITAL GROUP LTD. AND SUBSIDIARIES CONSOLIDATED STATEMENTS OF INCOME (U.S. dollars in thousands, except share data) (Unaudited) Three Months Ended March 31, 2009 2008 Revenues Net premiums written $ 822,863 $ 811,342 Increase in unearned premiums (122,299 ) (103,108 ) Net premiums earned 700,564 708,234 Net investment income 95,882 122,193 Net realized gains (losses) (5,164 ) 48,686 Total other-than-temporary impairment losses (92,989 ) (12,711 ) Portion of loss recognized in other comprehensive income (loss), — 56,855 before taxes Net impairment losses recognized in earnings (36,134 ) (12,711 ) Fee income 925 1,068 Equity in net income (loss) of investment funds accounted for (9,581 ) (22,313 ) using the equity method Other income 3,951 4,036 750,443 849,193 Total revenues Expenses Losses and loss adjustment expenses 400,542 404,417 Acquisition expenses 126,458 114,639 Other operating expenses 87,116 97,187 Interest expense 5,712 5,524 Net foreign exchange (gains) losses (25,205 ) 23,587 594,623 645,354 Total expenses 155,820 203,839 Income before income taxes Income tax expense 9,490 7,956 146,330 195,883 Net income Preferred dividends 6,461 6,461
  • 17. $ 139,869 $ 189,422 Net income available to common shareholders Net income per common share Basic $ 2.32 $ 2.90 Diluted $ 2.24 $ 2.78 Weighted average common shares and common share equivalents outstanding Basic 60,313,550 65,295,516 Diluted 62,559,969 68,019,413 ARCH CAPITAL GROUP LTD. AND SUBSIDIARIES CONSOLIDATED BALANCE SHEETS (U.S. dollars in thousands, except share data) (Unaudited) December March 31, 31, 2009 2008 Assets Investments: Fixed maturities available for sale, at market value (amortized $ 8,540,653 $ 8,122,221 cost: 2009, $8,735,769; 2008, $8,314,615) Short-term investments available for sale, at market value 749,708 479,586 (amortized cost: 2009, $749,178; 2008, $478,088) Investment of funds received under securities lending agreements, 550,821 730,194 at market value (amortized cost: 2009, $571,102; 2008, $750,330) Other investments (cost: 2009, $114,779; 2008, $125,858) 104,988 109,601 Investment funds accounted for using the equity method 293,452 301,027 Total investments 10,239,622 9,742,629 Cash 244,037 251,739 Accrued investment income 65,365 78,052 Investment in joint venture (cost: $100,000) 101,143 98,341 Fixed maturities and short-term investments pledged under 559,691 728,065 securities lending agreements, at market value Premiums receivable 720,724 628,951 Unpaid losses and loss adjustment expenses recoverable 1,710,781 1,729,135 Paid losses and loss adjustment expenses recoverable 76,312 63,294 Prepaid reinsurance premiums 274,578 303,707 Deferred income tax assets, net 62,210 60,192 Deferred acquisition costs, net 313,973 295,192 Receivable for securities sold 1,191,896 105,073
  • 18. Other assets 531,955 532,175 $ 16,092,287 $ 14,616,545 Total Assets Liabilities Reserve for losses and loss adjustment expenses $ 7,709,317 $ 7,666,957 Unearned premiums 1,617,431 1,526,682 Reinsurance balances payable 146,981 138,509 Senior notes 300,000 300,000 Revolving credit agreement borrowings 100,000 100,000 Securities lending payable 574,337 753,528 Payable for securities purchased 1,433,732 123,309 Other liabilities 580,093 574,595 12,461,891 11,183,580 Total Liabilities Commitments and Contingencies Shareholders’ Equity Non-cumulative preferred shares ($0.01 par value, 50,000,000 130 130 shares authorized, issued: 13,000,000) Common shares ($0.01 par value, 200,000,000 shares authorized, 605 605 issued: 2009, 60,532,222; 2008, 60,511,974) Additional paid-in capital 996,417 994,585 Retained earnings 2,894,577 2,693,239 Accumulated other comprehensive income (loss), net of deferred (261,333 ) (255,594 ) income tax Total Shareholders’ Equity 3,630,396 3,432,965 Total Liabilities and Shareholders’ Equity $ 16,092,287 $ 14,616,545 Source: Arch Capital Group Ltd. Arch Capital Group Ltd. John C.R. Hele, 441-278-9250 Fax: 441-278-9255 Executive Vice President and Chief Financial Officer