
Recommended
More Related Content
What's hot
What's hot (16)
Similar to Amd Results Q306
Similar to Amd Results Q306 (20)
More from earningsreport
More from earningsreport (20)
Recently uploaded
Recently uploaded (20)
Amd Results Q306
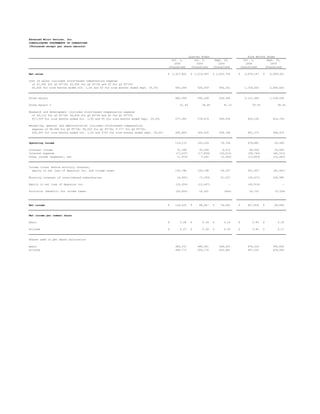
- 1. Advanced Micro Devices, Inc. CONSOLIDATED STATEMENTS OF OPERATIONS (Thousands except per share amounts) Quarter Ended Nine Months Ended Oct. 1, Jul. 2, Sept. 25, Oct. 1, Sept. 25, 2006 2006 2005 2006 2005 (Unaudited) (Unaudited) (Unaudited) (Unaudited) (Unaudited) Net sales $ 1,327,622 $ 1,216,367 $ 1,522,755 $ 3,876,147 $ 4,009,301 Cost of sales (includes stock-based compensation expense of $1,932 for Q3 FY'06; $2,200 for Q2 FY'06 and $0 for Q3 FY'05; $5,920 for nine months ended Oct. 1,06 and $0 for nine months ended Sept. 25,05) 645,264 526,059 896,261 1,724,663 2,469,663 Gross margin 682,358 690,308 626,494 2,151,484 1,539,638 Gross margin % 51.4% 56.8% 41.1% 55.5% 38.4% Research and development (includes stock-based compensation expense of $6,110 for Q3 FY'06; $6,834 for Q2 FY'06 and $0 for Q3 FY'05; $17,039 for nine months ended Oct. 1,06 and $0 for nine months ended Sept. 25,05) 277,380 278,674 289,018 820,230 814,724 Marketing, general and administrative (includes stock-based compensation expense of $8,468 for Q3 FY'06; $9,020 for Q2 FY'06; $ 277 for Q3 FY'05; $26,650 for nine months ended Oct. 1,06 and $743 for nine months ended Sept. 25,05) 285,806 309,525 258,748 851,373 698,974 Operating income 119,172 102,109 78,728 479,881 25,940 Interest income 31,188 35,308 9,510 94,658 23,589 Interest expense (17,637) (17,859) (30,615) (58,743) (80,513) Other income (expense), net (1,975) 7,240 (3,456) (13,863) (10,463) Income (loss) before minority interest, equity in net loss of Spansion Inc. and income taxes 130,748 126,798 54,167 501,933 (41,447) Minority interest of consolidated subsidiaries (6,941) (7,183) 21,227 (20,471) 105,985 Equity in net loss of Spansion Inc. (10,204) (12,467) - (40,914) - Provision (benefit) for income taxes (20,852) 18,301 (606) 32,722 (5,358) Net income $ 134,455 $ 88,847 $ 76,000 $ 407,826 $ 69,896 Net income per common share Basic $ 0.28 $ 0.18 $ 0.19 $ 0.85 $ 0.18 Diluted $ 0.27 $ 0.18 $ 0.18 $ 0.82 $ 0.17 Shares used in per share calculation Basic 486,331 484,541 399,025 478,318 395,839 Diluted 496,772 500,176 443,681 497,332 409,586
- 2. Advanced Micro Devices, Inc. CONSOLIDATED BALANCE SHEETS (Thousands) Oct. 1, Jul. 2, Dec. 25, 2006 2006 2005* (Unaudited) (Unaudited) Assets Current assets: Cash, cash equivalents and marketable securities $ 2,356,903 $ 2,530,062 $ 1,794,766 Accounts receivable, net 688,023 571,539 805,531 Inventories 465,716 405,285 388,631 Prepaid expenses and other current assets 326,238 308,323 477,302 Deferred income taxes 74,981 90,323 92,606 Total current assets 3,911,861 3,905,532 3,558,836 Property, plant and equipment, net 3,403,878 3,163,181 2,701,000 Net investment in Spansion Inc. 671,249 686,984 721,342 Other assets 392,255 306,198 306,601 Total Assets $ 8,379,243 $ 8,061,895 $ 7,287,779 Liabilities and Stockholders' Equity Current liabilities: Accounts payable 901,349 706,454 855,834 Accrued compensation and benefits 147,250 161,547 226,874 Accrued liabilities 473,477 429,843 388,998 Income taxes payable 17,790 45,567 3,326 Deferred income on shipments to distributors 115,571 189,992 141,898 Current portion of long-term debt and capital lease obligations 44,950 45,139 43,224 Other current liabilities 191,824 175,947 161,807 Total current liabilities 1,892,211 1,754,489 1,821,961 Deferred income taxes 75,861 90,323 92,606 Long-term debt and capital lease obligations 644,357 647,109 1,327,065 Other long-term liabilities 482,204 450,289 459,322 Minority interest in consolidated subsidiaries 272,116 267,095 234,988 Stockholders' equity: Capital stock: Common stock, par value 4,870 4,856 4,355 Capital in excess of par value 3,958,680 3,921,784 2,710,168 Retained earnings 881,631 747,160 473,678 Accumulated other comprehensive income 167,313 178,790 163,636 Total stockholders' equity 5,012,494 4,852,590 3,351,837 Total Liabilities and Stockholders' Equity $ 8,379,243 $ 8,061,895 $ 7,287,779 *Derived from the December 25, 2005 audited financial statements of Advanced Micro Devices, Inc.
- 3. Advanced Micro Devices, Inc. SELECTED CORPORATE DATA (Unaudited) (Millions except headcount and percentages) Quarter Ended Nine Months Ended Oct. 1, Jul. 2, Sept. 25, Oct. 1, Sept. 25, Segment Information (6) 2006 2006 2005 2006 2005 Computation Products (2) Net sales $ 1,290 $ 1,172 $ 969 $ 3,761 $ 2,486 Operating income 133 113 149 531 331 Embedded Products (3) Net sales 38 44 35 120 95 Operating loss (1) (6) (14) (18) (40) All Other (4) Net sales - - 3 (5) 3 Operating loss (13) (5) (6) (33) (16) Subtotal (excluding Memory Products segment) Net sales 1,328 1,216 1,007 3,876 2,584 Operating income 119 102 129 480 275 Memory Products (5) Net sales - - 516 - 1,425 Operating loss - - (50) - (249) Total AMD Net sales 1,328 1,216 1,523 3,876 4,009 Operating income 119 102 79 480 26 Other Data (AMD excluding Memory Products segment) Gross margin % 51.4% 56.8% 55.4% 55.5% 55.4% Research and development expenses $ 277 $ 279 $ 216 $ 820 $ 598 Marketing, general and administrative expenses $ 286 $ 310 $ 214 $ 851 $ 559 Depreciation & amortization $ 200 $ 193 $ 154 $ 567 $ 515 Capital additions $ 425 $ 455 $ 177 $ 1,190 $ 859 Headcount 11,609 10,967 9,530 11,609 9,530 International sales % 70.9% 70.2% 72.5% 70.2% 70.7% EBITDA (1) $ 331 $ 318 $ 397 $ 1,066 $ 1,087 (1) RECONCILIATION OF NET INCOME TO EBITDA* Net income $ 134 $ 89 $ 76 $ 408 $ 70 Depreciation and amortization 200 193 291 567 942 Interest expense 18 18 31 59 81 Provision (benefit) for income taxes (21) 18 (1) 33 (5) EBITDA $ 331 $ 318 $ 397 $ 1,066 $ 1,087 * Starting Q106, the Company defines EBITDA as net income adjusted for interest expense, tax, depreciation and amortization. Prior period information has been restated to conform to current period presentation. (2) Computation Products segment includes PC processors and Chipsets. (3) Embedded Products segment, formerly known as Personal Connectivity Solution Products, includes Embedded Processors and Products for global commercial and consumer markets. (4) The All Other category includes certain operating expenses and credits that are not allocated to the operating segments and, starting Q305, includes Personal Internet Communicator (PIC) products. (5) Memory Products segment included Flash memory products of AMD and Spansion. Spansion closed its IPO on Dec 21, 2005. Since that time, AMD uses the equity method of accounting to reflect its proportionate share of Spansion's net income (loss). (6) Starting Q405, the Company allocates bonus and profit sharing expenses to the segments. Prior period information has been restated to conform to current period presentation. Note: Figures may not foot due to rounding