Contenu connexe
Similaire à 2005:The Changing Efficiency of African Stock Markets
Similaire à 2005:The Changing Efficiency of African Stock Markets (12)
2005:The Changing Efficiency of African Stock Markets
- 1. South African Journal of Economics Vol. 73:1 March 2005©
THE CHANGING EFFICIENCY OF AFRICAN STOCK
MARKETS
KEITH JEFFERIS AND GRAHAM SMITH†
Abstract
This paper classifies formal African stock markets into four categories and discuses the principal
characteristics of the seven markets covered in this study: South Africa, Egypt, Morocco,
Nigeria, Zimbabwe, Mauritius and Kenya. Using a GARCH approach with time-varying
parameters, a test of evolving efficiency (TEE) is implemented for periods starting in the early
1990s and ending in June 2001. This test detects changes in weak form efficiency through time.
The TEE finds that the Johannesburg stock market is weak form efficient throughout the
period, and three stock markets become weak form efficient towards the end of the period:
Egypt and Morocco from 1999 and Nigeria from early 2001. These contrast with the Kenya and
Zimbabwe stock markets which show no tendency towards weak form efficiency and the
Mauritius market which displays a slow tendency to eliminate inefficiency. The paper relates
weak form efficiency to stock market turnover, capitalisation and institutional characteristics of
markets.
JEL Classification: G14, G15, O16 Keywords: African Stock Markets, efficiency, GARCH
WITH THE POSSIBLE EXCEPTION of the JSE Securities Exchange (JSE), there have been
relatively few studies of the weak form efficiency of African stock markets. While the
evidence for the JSE is mixed, the few studies that have been carried out for other
markets find, not surprisingly, that most are inefficient (in a financial sense, meaning
that stock prices do not reflect all available information, and that stocks are not
therefore being appropriately priced at their equilibrium values).
A variety of empirical tests can be used to assess market efficiency. Thompson and
Ward (1995) reviewed a wide range of literature covering empirical tests of the
efficiency of the JSE and noted that, with different methodologies for testing efficiency
giving different results, no clear conclusion is possible. Jefferis and Okeahalam (1999a)
applied unit root tests to stock price indices to assess the efficiency of the stock
markets in South Africa, Botswana and Zimbabwe over the period 1989-96, and find
that the South African and Zimbabwean markets were efficient during this period,
although Botswana was not, at least during the early part of the period. However the
unit root test of market efficiency is not a powerful one, and subsequent analysis using
different tests provided contrasting results. Jefferis and Okeahalam (1999b) used an
event study of the same three markets to test the response of individual stock prices to
information announcements, by evaluating the speed and efficiency with which
information is incorporated into market prices. They found that the Botswana and
Zimbabwe markets are inefficient, while the JSE is weak form efficient. This
corresponds with the findings of Smith et al (2002), who tested whether eight African
stock markets follow a random walk using multiple variance ratio tests. Of the eight
markets (South Africa, Egypt, Kenya, Morocco, Nigeria, Zimbabwe, Botswana and
† Bank of Botswana, and Department of Economics, School of Oriental and African Studies,
University of London, respectively. This paper represents the personal views of the authors and
not necessarily those of their respective institutions. We are grateful to Hyun-Jung Ryoo for
helpful comments on an earlier version of the paper.
© 2005 Economic Society of South Africa. Published by Blackwell Publishing, 9600 Garsington Road, Oxford OX4
DQ, UK and 350 Main Street, Malden, MA 02148, USA. on behalf of ESSA.
54
- 2. South African Journal of Economics Vol. 73:1 March 2005©
Mauritius), only the JSE was found to follow a random walk and therefore to be weak
form efficient. Magnusson and Wydick (2002) provided three tests of the random walk
hypothesis focusing on uncorrelated price changes, independently but not identically
distributed (INID) price changes, and IID price changes. Using the test of INID price
changes with stock price indices in local currency, they found that Botswana, Ghana,
Nigeria and Zimbabwe are inefficient while Côte d’Ivoire, Kenya, Mauritius and South
Africa are weak form efficient. Furthermore, the weak form efficiency of the eight
African stock markets examined in their study compared favourably with a sample of
emerging stock markets in Asia and Latin America.
All of these studies employed tests which lead to the inference that a stock market
either is or is not weak-form efficient. Gradual changes in efficiency are not captured. It
seems implausible that a relatively new emerging stock market is equally efficient over
the whole of its history. When a market first starts trading, it takes time for the price
discovery process to become known. As markets operate and market microstructures
develop, emerging stock markets are likely to become more efficient (Cornelius, 1993).
A test is required that can capture gradual changes in efficiency. Such a test has been
provided by Emerson et al (1997) and Zalewska-Mitura and Hall (1999) who use a
GARCH approach with time-varying parameters which can detect gradual changes in
weak form efficiency through time. This paper implements this test of evolving
efficiency for seven African stock markets. The rest of this paper is organised as
follows. Section 1 provides an overview of African stock markets and identifies four
categories of formal stock market. Section 2 describes the data and their characteristics.
Section 3 discusses the empirical methodology employed. In section 4 the results are
presented. Section 5 provides a brief conclusion.
1. AN OVERVIEW OF AFRICAN STOCK MARKETS
At the end of 2003 there were 12 formal stock markets in Africa monitored by the S&P
Emerging Markets Database (EMDB) (see Table 1). These can usefully be divided into
three categories:
(i) South Africa, which dominates other African stock markets in terms of both size
and sophistication.
(ii) A group of medium sized markets, many of which have been established for a long
time (e.g., Egypt, Morocco, Nigeria, Zimbabwe).
(iii) Small new markets that have shown rapid growth (e.g., Botswana, Ghana,
Mauritius).
A fourth category comprises a number of very small, relatively new markets that are
in the embryonic stage and are yet to take off (e.g., Swaziland, Zambia, Malawi,
Tanzania, Uganda) and which are not yet included in the EMDB.
With the exception of South Africa, African stock markets are extremely small by
world standards. Together, the fifteen markets apart from South Africa accounted for
only 0.2 per cent of world stock market capitalisation at the end of 2003, and 2.0 per
cent of emerging market capitalisation. In contrast, South Africa - which accounts for
80 per cent of African stock market capitalisation - is quite large by world standards.
With a capitalisation of US $267 billion at the end of 2003, South Africa was then the
fifth largest emerging market (after China, Taiwan, South Korea and India), and the 18th
largest equity market in the world. All African markets (including South Africa) tend to
lack liquidity, however, and therefore when ranked by turnover rather than market
© 2005 Economic Society of South Africa. 55
- 3. South African Journal of Economics Vol. 73:1 March 2005©
capitalisation their relative position is diminished. Five of the African markets are
included in the S&P Global Emerging Market Index (S&P/IFCG) (South Africa,
Egypt, Morocco, Nigeria, and Zimbabwe) although, apart from South Africa, they have
very small weights in the S&P index.
Table 1. African Stock Markets, 2003
(Ranked by capitalisation, end of year)
Capitalisation Turnover Liquidity No. of Stocks
Annual Change %
(US$ million) 1994-2003 (US$ million) (%)
Namibia 308 6.3 2 0.7 13
Ghana 1,426 (3.0) 46 4.1 28
Cote D’Ivoire 1,650 16.2 25 1.6 38
Mauritius 1,955 2.7 99 6.2 40
Botswana 2,131 21.2 87 4.4 19
Tunisia 2,464 (0.4) 164 7.2 46
Kenya 4,178 3.4 209 7.4 51
Zimbabwe 4,975 11.8 1,345 26.1 81
Nigeria 9,494 4.2 78 11.0 200
Morocco 13,152 4.3 114 6.5 53
Egypt 27,073 22.8 3,278 13.7 967
South Africa 267,745 1.9 102,808 44.8 426
TOTAL 336,244 108,252 1,949
Excl. SA 68,499 5,444 1,523
SA as % of total 79.6% 95.0% 21.9%
Emerging Markets 3,656,722
Africa as % 9.2%
Note: countries in bold included in present study
Source: Standard & Poors (2004)
Although most African stock markets are relatively small, many have grown rapidly in
recent years, and there have been very rapid increases in capitalisation and turnover
over the past decade. Turnover, for instance, increased at an average annual rate of 22
per cent (measured in US$ terms) between 1994 and 2003, compared to 9 per cent a
year for emerging markets as a whole. At the same time, many of these markets have
performed well in terms of returns for investors. Although in many cases they have also
been characterised by high levels of volatility, these markets tend to exhibit relatively
low correlations with other stock markets internationally.
A number of factors have contributed to the expansion and growth of African stock
markets. Many countries have been undergoing economic reform programmes that
have involved a reduction in the role of the state in the economy and a strengthening of
the role of the private sector. This has been accompanied by a greater role for market
forces in price determination and the allocation of both real and financial resources.
Financial sector reforms have often included the establishment of new stock markets,
or improving the environment in which existing stock markets operate. Furthermore,
privatisation programmes in several countries have involved the listing of shares in
formerly nationalised firms, which are often very large in relation to the size of national
economies, thus providing a supply of new shares and a further boost to stock market
development.
This process has been accompanied by increased attention from international
© 2005 Economic Society of South Africa. 56
- 4. South African Journal of Economics Vol. 73:1 March 2005©
investors. Their interest reflects the growing size of African markets, along with the
potential for high returns accompanied by the diversification benefits resulting from
low correlations with other markets. At the same time many of the barriers to entry that
have previously restricted the participation of foreign investors in many African
markets are being progressively eased. Many countries have liberalised exchange
controls on both current and capital account, making entry and exit easier, and direct
restrictions on foreign ownership of shares have also been relaxed, although some
controls do remain. Standards of market governance have improved, with several
countries introducing new or revised legislation and governance structures.
Table 2. African Stock Markets included in this study
Descriptive Statistics 2003
Capitalisation Turnover Turnover Mkt Cap Number Price- Price
(US$ (US$ Ratio (%) /GDP % of earnings Index
million) million) (Liquidity) Stocks Ratio Correlations [a]
(2003) Average, 2000-2003 S&P 500 FTSE 100
Mauritius 1,955 86 6.3 41.1 40 7.7 n/a n/a
Kenya 4,178 83 4.4 32.3 51 31.9 n/a n/a
Zimbabwe 4,975 1410 21.9 66.6 81 5.5 (0.07) (0.13)
Nigeria 9,494 523 9.2 20.8 200 18.5 0.24 0.15
Morocco 13,152 837 8.1 34.7 53 25.2 0.15 0.21
Egypt 27,073 5,213 18.2 28.7 967 11.7 0.26 0.26
South Africa 267,745 82,202 41.4 244.6 426 11.5 0.45 0.50
TOTAL 328,572 90,354 36.3 105.1 1,818 12.4 - -
Excl. RSA 60,827 8,152 13.6 29.9 1,392 16.4 - -
IFCG Composite - - - - - 21.7 0.74 0.63
Notes: [a] 1998-2003
Source: Standard and Poors (2004)
The lack of liquidity remains a serious problem for African markets, however. Turnover
ratios (the ratio of turnover to capitalisation) in liquid markets are typically over 100 per
cent; in Africa, however, the most liquid market is South Africa, with a turnover ratio
of 44 per cent, while in other markets liquidity is generally well below this (see Table
1)1. Lack of liquidity can stem from both sides of the market.
Table 3. Market Characteristics
Foreign Withholding Taxes on Foreign Status of Entry Trading
Investment Investors and Exit for System
Ceilings Interest Dividends Capital Foreign
% (in general) Gains Investors
South Africa 100 0 0 0 Free Electronic (1996)
Egypt 100 15 0 40 Free Electronic (2000)
Morocco 100 10 10 0 Free Electronic (1997)
Nigeria 100 10 10 0 Free Electronic (1999)
Zimbabwe 40 10 20 0 Relatively free Open outcry
Mauritius 100 0 0 0 Relatively free Electronic (2001)
Kenya 40 15 10 0 Relatively free Open outcry
Source: Standard & Poors (2004); Stock Exchanges
On the supply side, many shares in listed companies are held by controlling interests -
1 Although low liquidity also characterises smaller emerging markets elsewhere in the world.
© 2005 Economic Society of South Africa. 57
- 5. South African Journal of Economics Vol. 73:1 March 2005©
often foreign parent companies - leaving relatively small proportions of shares available
for public trading. This can have implications on the demand side, especially in small
markets, where local and foreign institutional investors know that “the costs of trading
in and out of African equities are high and that positions once sold may not be easily
re-established” (Flemings, 1997 p.2).
The present study covers seven African stock markets: South Africa, Egypt,
Morocco, Nigeria, Zimbabwe, Mauritius and Kenya. These represent seven of the nine
largest stock markets in Africa, and account for 97.5 per cent of total capitalisation.
Summary statistics for these markets are reported in Table 2 and market characteristics
in Table 3. More information is provided on each of these markets in Appendix 1.
2. THE DATA AND THEIR PROPERTIES
The stock price indices used in this paper are broadly-based and representative of the
market as a whole. The series are: the EFG Price Index for Egypt, the Nairobi Stock
Exchange Index, the Stock Exchange of Mauritius Index (SEMDEX), the Casablanca
Finance Group CFG 25, the S&P/IFC Global Index for Nigeria and the Johannesburg
Securities Exchange JSE-Actuaries All Share Index. A composite index is not produced
by the Zimbabwe Stock Exchange – only separate indices for the industrial and mining
sectors. Since the stock market is dominated by the industrial sector, this index is used.
All indices have value weights and are in local currency. The data are weekly starting in
the third week of January 1990 and ending in the last week of June 2001 (598
observations), except for Egypt for which the series starts in the first week of January
1993 (443 observations) and Morocco and Nigeria where the data begin in the first
week of January 1994 (391 observations). All observations are closing prices and refer
to Wednesdays to minimise any day-of-the-week effects. The source is Datastream.
Table 4. Summary Statistics for Weekly Returns
Egypt Kenya Mauritius Morocco Nigeria South Africa Zimbabwe
Mean 0.0023 0.0012 0.0019 0.0023 0.0063 0.0018 0.0063
Median 0.0003 0.0000 0.0009 0.0009 0.0046 0.0031 0.0056
Standard Deviation 0.0312 0.0251 0.016 0.0152 0.0223 0.0254 0.0374
Skewness 0.3695 4.3152 0.3888 0.5165 0.4512 –0.9794 –0.0691
0.117 0.100 0.100 0.124 0.124 0.100 0.100
Excess Kurtosis 2.0519 40.0703 3.3112 3.424 5.1737 4.4178 9.481
0.233 0.201 0.201 0.248 0.248 0.201 0.201
Jarque-Bera 87.59 41792.8 287.77 207.84 448.2 580.93 2236.5
ARCH(1) 50.96 97.67 38.48 22.92 23.19 28.39 67.93
Notes: [1] The numbers in italics are standard errors of the coefficients of skewness and excess kurtosis
under the hypothesis of normality.
[2] The .05 critical value for the Jarque-Bera test is 5.99.
[3] The .05 critical value for ARCH(1) is 3.84.
[4] For all markets, Phillips-Perron unit root tests (not reported here) find that logarithms of the indices are
I(1) and weekly returns are I(0). Unit root tests are not tests of the random walk hypothesis (Campbell et
al, 1997, pp 64-5).
Table 4 reports descriptive statistics for weekly returns. For all of these stock markets,
average returns are positive. Under the hypothesis of normality, the distribution of the
coefficient of skewness is asymptotically normal with mean zero and variance 6/T
where T is the sample size. The distribution of returns on the Zimbabwe stock market
is not significantly skewed at the .05 significance level. However, for the JSE the
© 2005 Economic Society of South Africa. 58
- 6. South African Journal of Economics Vol. 73:1 March 2005©
distribution of returns is skewed to the left and for the other five markets the
distributions are positively skewed. Under normality, the distribution of the coefficient
of excess kurtosis is asymptotically normal with zero mean and variance 24/T. For all
seven markets, the distributions of weekly returns are leptokurtic, that is, they have
higher peaks about the mean and thicker tails than the normal distribution. For all of
these stock markets, the Jarque-Bera joint test of symmetry and mesokurtosis provides
further evidence that weekly returns are not normally distributed. The null hypothesis
of no autoregressive conditional heteroscedasticity (ARCH) is clearly rejected for
returns in all seven markets. In summary, returns in these seven stock markets are not
white noise. They show clear departures from normality and time-varying volatility. For
returns having these characteristics, a test of evolving efficiency can be used and this is
discussed in the next section.
3. METHODOLOGY: A TEST OF EVOLVING EFFICIENCY
If a stock market follows a random walk it is weak form efficient. That is, prices fully
reflect the information contained in past price changes. In these circumstances,
historical price information provides no profit opportunities; an efficient market is
unpredictable. In principle, this can be tested using a simple model of the form
rt = β 0 + β1rt −1 + ut (1)
where rt = pt − pt −1 and pt is the natural logarithm of a stock price index (or stock
price). If the stock price index follows a random walk, β1 = 0 and so
pt = β 0 + pt −1 + ut . (2)
Campbell et al (1997) distinguished three successively weaker versions, depending on
the assumptions made about the increments {u t } . With Random Walk 1 model, RW1,
increments are independently and identically distributed with zero mean and constant
variance, denoted by ut ∼ IID(0,σ2). Under RW2, they are independently but not
identically distributed, which allows for unconditional heteroscedasticity in the {u t } ,
and with RW3, increments are uncorrelated but not independently and not identically
distributed. This paper focuses on RW3, with volatilities changing over time.
Equation (1) has constant parameters and the disturbance is assumed to satisfy the
usual classical assumptions. With emerging markets, the assumption of constant
parameters may be inappropriate because as these markets develop and become more
mature the parameters are expected to change. Also, empirical evidence frequently finds
that returns in stock markets have a variance which changes systematically. This may
affect the required rate of return and may also have an autoregressive component.
Using a GARCH approach with time-varying parameters, Emerson et al (1997) and
Zalewska-Mitura and Hall (1999) have developed a test for evolving efficiency (TEE)
which detects changes in weak form efficiency through time where the error process
does not have a full set of NID properties.
Consider the following model in which returns depend on past returns and the
conditional variance
rt = β 0t + β1t rt −1 + δht + ut . (3)
© 2005 Economic Society of South Africa. 59
- 7. South African Journal of Economics Vol. 73:1 March 2005©
u t ψ t −1 ~ N (0, ht ) (4)
ht = α 0 + α 1 u + γ 1h t −1
2
t −1 (5)
and β it = β it −1 + vit i = 0,1 vit ~ N (0, σ i2 ) (6)
in which ht is the conditional variance of the error term and ψ t is the information set
available at time t. This model differs from the basic model given by equation (1) in two
important respects. First, the intercept, β ot , and slope coefficient, β1t , can change
through time. Secondly, this model incorporates an error process in which the variance
changes systematically over time. A maximum likelihood search procedure with a
standard Kalman filter is used to estimate the model with equation (3) the measurement
equation and the set of equations given by (5) and (6) the state equations.2 The Kalman
filter sequentially updates coefficient estimates and generates the set of
β it s, i = 0,1 and t = 1...T and their standard errors. Graphs of β1t illustrate the
ˆ ˆ
evolution of weak form efficiency through time.
Conventional tests of the random walk hypothesis, for example the Lo and
MacKinlay (1988) variance ratio test, lead to the inference that a stock price or stock
price index does or does not follow a random walk at a predetermined significance
level. Although such tests can be applied to successive time periods, they cannot readily
capture gradual changes in efficiency over successive observations.
4. RESULTS
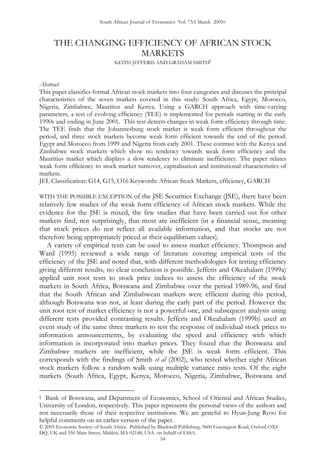
Fig. 1 to 7 present the results of the TEE. They show the time-paths of the estimated
β1t coefficients together with their 95 per cent confidence intervals. Consider Fig. 1
which presents the results for the Johannesburg stock market.
0.2
0.15
0.1
0.05
0
-0.05
90
91
92
93
94
95
96
97
98
99
00
01
19
19
19
19
19
19
19
19
19
19
20
20
B1 0.95 -0.95
Figure 1. South Africa
These results are different from those for all of the other stock markets,
2 We are grateful to Ania Zalewska-Mitura for providing a copy of her Gauss code.
© 2005 Economic Society of South Africa. 60
- 8. South African Journal of Economics Vol. 73:1 March 2005©
β1t = 0.085 and constant. The upper and lower bounds of the .95 confidence interval
ˆ
are 0.175 and -0.005 respectively.
These span β = 0 ; this market is weak form efficient and shows no tendency to
change. This is a characteristic of many developed markets and similar to the results for
the London Stock Exchange reported in Zalewska-Mitura and Hall (1999). Fig. 2
illustrates the results for the Egyptian market. The estimate β1t has an initial value of
ˆ
0.346 and is significantly different from zero at the .05 level. The magnitude of the
estimated parameter gradually declines and first becomes insignificantly different from
zero in 1999. This stock market gradually became weak form efficient.
0.8
0.6
0.4
0.2
0
-0.2
-0.4
93
94
95
96
97
98
99
00
01
19
19
19
19
19
19
19
20
20
B1 0.95 -0.95
Figure 2. Egypt
The results for the Casablanca index are reported in Fig. 3. The estimated
autocorrelation coefficient of weekly returns increases to a maximum value of 0.568 in
January/February 1997 and then decreases. It is significantly different from zero at the
.05 level over the period from November 1995 until August 1999. Following this, the
market is weak form efficient. Fig. 4 is generated from returns on the Nigerian stock
market and shows changing levels of inefficiency followed by changes towards weak
form efficiency.
1
0.8
0.6
0.4
0.2
0
-0.2
-0.4
94
95
96
97
98
99
00
01
19
19
19
19
19
19
20
20
B1 0.95 -0.95
Figure 3. Morocco
© 2005 Economic Society of South Africa. 61
- 9. South African Journal of Economics Vol. 73:1 March 2005©
1.4
1.2
1
0.8
0.6
0.4
0.2
0
-0.2
-0.4
94
95
96
97
98
99
00
01
19
19
19
19
19
19
20
20
B1 0.95 -0.95
Figure 4. Nigeria
This contrasts with the results for the Zimbabwe stock market reported in Fig. 5. The
estimated autocorrelation coefficient of weekly returns fluctuates with no sign of
stabilisation and no tendency towards weak form efficiency. The results for Zimbabwe
and Mauritius (Fig. 5 and 6) both reject the hypothesis of weak form efficiency with
time-varying β1t . For the period 1994-99, the Zimbabwe market gradually becomes
ˆ
less inefficient but more recently the trend towards eliminating inefficiency has
reversed. The Mauritius market displays a very slow tendency to eliminate inefficiency.
1
0.8
0.6
0.4
0.2
0
90
91
92
93
94
95
96
97
98
99
00
01
19
19
19
19
19
19
19
19
19
19
20
20
B1 0.95 -0.95
Figure 5. Zimbabwe
The results for the Nairobi Stock Exchange index are illustrated in Fig. 7. In contrast to
the previous case, the estimated parameter, β1t , is approximately constant with an
ˆ
average value of 0.379 and significantly different from zero. This market is not weak
form efficient and shows no tendency towards efficiency. In summary, the TEE finds
that the Johannesburg stock market is weak form efficient throughout the period, and
© 2005 Economic Society of South Africa. 62
- 10. South African Journal of Economics Vol. 73:1 March 2005©
three stock markets become weak form efficient towards the end of the period: Egypt
and Morocco from 1999 and Nigeria from early 2001.
0.8
0.7
0.6
0.5
0.4
0.3
0.2
0.1
0
90
91
92
93
94
95
96
97
98
99
00
01
19
19
19
19
19
19
19
19
19
19
20
20
B1 0.95 -0.95
Figure 6. Mauritius
0.6
0.5
0.4
0.3
0.2
0.1
0
1990 1991 1992 1993 1994 1995 1996 1997 1998 1999 2000 2001
B1 0.95 -0.95
Figure 7. Kenya
The results can be interpreted with respect to the quantitative and institutional
characteristics of the respective markets. The most important quantitative
characteristics appear to be those related to the size of the market, in terms of
capitalisation and turnover. The South African stock market, which is weak form
efficient throughout, is by far the largest of the markets studied. The Egyptian market,
which became less inefficient from late 1996/early 1997 and became weak form
efficient from 1999 is the second largest market measured by turnover and
capitalisation (see Table 2). The South African and Egyptian markets also demonstrate
relatively high levels of liquidity. The Moroccan and Nigerian markets, which became
© 2005 Economic Society of South Africa. 63
- 11. South African Journal of Economics Vol. 73:1 March 2005©
less inefficient from 1997 onwards and eventually weak form efficient, are the third and
fourth largest market by capitalisation and have comparable levels of liquidity. Kenya
and Mauritius, which at no point become weak form efficient, are the smallest and least
liquid of the seven markets.
The key results, that is, South Africa being weak form efficient throughout the
period; Egypt, Morocco and Nigeria experiencing reduced inefficiency during the later
part of the period and becoming weak form efficient towards the end; and Zimbabwe,
Mauritius and Kenya remaining weak-form inefficient throughout, can also be related
to broader economic factors and the institutional characteristics of markets. The
Zimbabwean market, while demonstrating relatively high levels of turnover and
liquidity, is hampered by chronic economic instability. All markets except Zimbabwe
and Kenya had, by the end of the period, adopted an electronic trading system that
transforms the price formation process. Zimbabwe and Kenya also retain restrictions
on foreign ownership of shares, which inhibit the activities of foreign participants in the
market and the efficiencies that their presence can bring. The most efficient market,
South Africa, benefits from the trading of some of its shares on major international
markets where they are cross-listed. It is also the only African market that approximates
a developed market in size, and availability of information and analysis.
The focus of this paper is on providing a quantitative assessment of weak-form
efficiency trends in the most important African stock markets and this is carried out
using a test of evolving efficiency. While it is not the intention to provide a quantitative
analysis of the factors causing these efficiency trends - this remains a topic for future
research - it is possible nonetheless to provide indications of what these factors might
be. Interpreting the results in the context of the institutional characteristics of the
various stock exchanges and the economies in which they operate indicates that
absolute size (in terms of capitalisation and turnover) and the rate of growth of market
liquidity seem to be important in supporting weak form efficiency (or movement
towards it). In addition, an automated (electronic) stock market trading system helps.
Macroeconomic instability and polices that inhibit the operations of markets more
generally are negative factors. While these results are not conclusive, they are consistent
with arguments that activity levels and market micro-structures are important factors
determining efficiency. For markets to be weak-form efficient, current prices must fully
reflect all historical information. This in turn requires that accurate information is
quickly made available to market participants; that market participants are sufficient in
number for there to be effective competition between them; and that there is sufficient
trading taking place for prices to adjust and reflect new information. Larger markets
may benefit from economies of scale, thus lowering transactions costs, hence
encouraging trading. High levels of turnover and liquidity mean that more transactions
are taking place, thus providing more opportunities for prices to change in response to
new information. Trading systems also help the price formation process, and are more
generally associated with more efficient, automated information dissemination. Finally,
an adverse macro-economic environment makes interpretation of information, and its
impact on corporate profitability, more complicated.
5. CONCLUSIONS
This paper classifies formal African stock markets into four categories: South Africa,
medium-sized markets, small new markets which have experienced rapid growth, and
© 2005 Economic Society of South Africa. 64
- 12. South African Journal of Economics Vol. 73:1 March 2005©
small new markets which have yet to take off. Using a GARCH approach with time-
varying parameters, a test of evolving efficiency is implemented for the seven markets
covered in this study: South Africa, Egypt, Morocco, Nigeria, Zimbabwe, Mauritius and
Kenya, for periods starting in the early 1990s and ending in June 2001. This test, which
can detect changes in weak form efficiency through time, finds that the Johannesburg
stock market is weak form efficient throughout the period, and three stock markets
become weak form efficient towards the end of the period: Egypt and Morocco from
1999 and Nigeria from early 2001. These contrast with the results for the Kenya and
Zimbabwe stock markets which show no tendency towards weak form efficiency, and
the Mauritius market which displays a very slow tendency to eliminate inefficiency.
Differences in stock market efficiency can be related to turnover, capitalisation and the
institutional characteristics of markets.
A number of policy implications can be drawn from this analysis. First, the results
show that the size of the market is important, in that the larger markets are efficient for
some or all of the period examined, while the smaller markets are not. While there is
nothing that can be done immediately to make markets larger, the results suggest that
policies to grow stock markets are important. Such policies can include encouraging
new listings by ensuring that listing requirements are prudent without being
unnecessarily onerous, and encouraging the development of pension funds and other
forms of institutional investors who will have a demand for listed equities. These will
help not just to enlarge the securities segment of capital markets but to make that
market more efficient, which would in turn encourage further listings and investment -
a virtuous circle.
For some countries, however, small size will always be a problem, bearing in mind
the small size of many African economies. This suggests that regional stock markets
may be a way forward, not just to benefit from economies of scale but also to improve
pricing efficiency. As examples of such developments, there is a already a regional stock
exchange in West Africa (based in Abidjan) and there have been discussions in
Southern Africa of the Johannesburg Stock Exchange acting as the hub of a regional
exchange.
In addition to policies aimed at increasing the size of stock markets, other
institutional reforms can help to improve efficiency. These include innovations such as
electronic trading systems, allowing free access to foreign investors (to improve
liquidity), improving the dissemination of information relating to listed companies,
improving the speed and efficiency of settlement, and changing the legal framework
where necessary to ensure adherence to the best international standards. All of these
developments will help to boost confidence in the market and encourage the additional
trading activity that will support market efficiency.
APPENDIX
Markets Examined in this Study
South Africa: the Johannesburg Stock Exchange dates back to the 19th century and although very
large in terms of capitalisation, liquidity was historically low due to the domination of share
ownership by a few large conglomerates linked either to mining companies or financial holding
companies. This concentration of ownership was partly a result of strict exchange controls on
the capital account, which restricted South African firms from exporting capital and left them
with little choice but to take over other domestic firms.
Extensive changes during the past decade have, however, led to a sharp rise in turnover and
© 2005 Economic Society of South Africa. 65
- 13. South African Journal of Economics Vol. 73:1 March 2005©
liquidity. These changes stem from both the broader political changes that have taken place in
South Africa, as well as considerable institutional reforms in the market itself. The JSE has
benefited from substantial inflows of foreign portfolio investment since the ending of apartheid
and the lifting of sanctions in 1994. There are no restrictions on the ownership of shares by
foreigners, although prior to March 1995 transactions had to be carried out using the financial
rand, the dual exchange rate applied to capital transactions. Since the abolition of the dual
exchange rate regime, foreign investors have not been subject to any exchange control
regulations, although domestic investors remain restricted in their ability to export capital. The
domination of the JSE by the conglomerates has declined since 1994, as a result of inflows of
foreign capital and moves towards unbundling the often complex ownership and control
structures of major companies.
There have also been considerable institutional reforms of the JSE. In 1995 membership
rules were changed to permit foreign owned members and limited liability corporate
membership for the first time. In 1996, fixed commissions were abolished in favour of fully
negotiated brokerage fees, the tax rate on securities trading was halved, and a fully automated
electronic trading system was introduced to replace the old open outcry trading floor. In 1997
the Stock Exchange News Service (SENS) was introduced, through which listed companies are
obliged to release price-sensitive information which is then disseminated on a real time basis to
market participants. Finally, starting in 1999, the transition to a fully dematerialised central
securities depository commenced, enabling faster and more secure settlement of trades. As a
result of these changes, the JSE is now one of the most technologically advanced emerging
markets. Furthermore, it operates as part of a relatively sophisticated financial sector
characterised by a wide range of financial institutions, markets, and information flows that in
many respects is more representative of a developed than a developing country.
Egypt: the Egyptian stock exchange is the second largest in Africa by both capitalisation and
turnover, and is also the oldest in the continent, pre-dating the JSE by four years. For much of
its existence however its role has been stifled by excessive bureaucracy and regulation, and a
large proportion of the listed shares have been illiquid. Nevertheless, recent moves towards
deregulation and privatisation have given the market a boost. Recent changes include revised
listing requirements and exchange membership rules; and the introduction of new systems for
information dissemination, settlement of transactions and automated trading.
Morocco: Like Egypt, Morocco has a relatively old stock exchange, established in 1929, although it
has been inactive for long periods. The exchange has been transformed by developments during
the 1990s, with an extensive series of reforms including a new legal framework, reduction of
commission rates, introduction of an electronic trading system, and the establishment of a
(paperless) central securities depository. The broader process of deregulation and privatisation
has also boosted the market in recent years. Although there are no restrictions on foreign
ownership, foreign participation in the market is low. This is partly a result of exchange control
restrictions on domestic investors who have few domestic or foreign investment alternatives to
the stock exchange.
Nigeria: established in 1960, the Nigerian Stock Exchange was, until the early 1990s, primarily a
forum for trading government bonds rather than equities, and trade was highly regulated.
Extensive deregulation took place in 1993 with the removal of price and other direct controls.
Restrictions on foreign participation were removed in 1995, since when foreign-owned
brokerages have been permitted and controls on foreign participation in the ownership of
Nigerian companies have been removed. An automated trading system was introduced in 1999.
Turnover and liquidity have increased significantly since 1995, although both remain relatively
low. Alongside these reforms, and despite the inconsistent implementation of economic reform
programmes, privatisation has been quite widespread and this has helped the stock market.
Zimbabwe: dating from 1946, the Zimbabwe Stock Exchange was characterised as “a dozy club
with two dozen members” (Cazenove, 1997 p. 44) prior to the advent of Zimbabwe’s IMF-
inspired Economic Structural Adjustment Programme (ESAP) in 1991. The most important
© 2005 Economic Society of South Africa. 66
- 14. South African Journal of Economics Vol. 73:1 March 2005©
boost to the market came with the opening of the exchange to foreign investors in May 1993,
along with a major relaxation of exchange controls. Nevertheless, foreign ownership is still
restricted, with individual foreign investors limited to 10 per cent of a company’s shares, and
foreign investors collectively to 40 per cent. Continued economic and political problems, and
inconsistent implementation of structural adjustment and economic reform policies have,
however, made the market highly volatile, especially for foreign investors, reflecting strict
exchange controls on residents and a highly unstable macroeconomic environment.
Mauritius: the Stock Exchange of Mauritius (SEM) has developed rapidly in since its
establishment 1989 In addition to 40 listed companies, another 80 companies are traded on the
Over-The-Counter (OTC) market. Although the market remains small and not all that liquid, it
is helped by the absence of restrictions on foreign ownership (since 1994) and foreign investors
play an active role in the market. Major reforms include the establishment of a Central
Depository System in 1997 and the introduction of a fully automated electronic trading system
in 2001.
Kenya: the Nairobi Stock Exchange was established in 1954. The Kenyan market has had a
similar history to that of Zimbabwe, with an upsurge in activity since 1993 due to economic
reform, privatisation, and relaxation of restrictions on foreign investors and of exchange
controls. More recently however, implementation of the economic reform programme has been
inconsistent and political problems remain, leading to market volatility, especially in dollar terms.
Liquidity has remained low throughout.
REFERENCES
CAMPBELL, J.Y., A.W. LO AND A.C. MACKINLAY (1997). The Econometrics of Financial Markets, Princeton, Princeton
University Press.
CAZENOVE (1997). Sub-Saharan Africa Stock Markets, London: Cazenove & Co.
CORNELIUS, P. K. (1993). “A note on the informational efficiency of emerging stock markets”, Weltwirtschaftliches Archiv,
129 820-828.
EMERSON, R., HALL S.G. AND ZALEWSKA-MITURA, A. (1997). “Evolving Market Efficiency with an application to
some Bulgarian shares”, Economics of Planning, Vol. 30, No. 1, pp. 75-90.
FLEMINGS RESEARCH (1997). Global Emerging Markets: Africa on Top, London: Robert Fleming.
JEFFERIS, K. AND OKEAHALAM C. (1999A). “International Stock Market Linkages in Southern Africa”, South African
Journal of Accounting Research, Vol. 13, No. 2, pp. 1-25.
JEFFERIS, K. AND OKEAHALAM C. (1999B). “An Event Study of the Botswana, Zimbabwe and Johannesburg Stock
Exchanges”, South African Journal of Business Management, Vol. 30, No. 4, pp. 131-140.
LO, A. AND MACKINLAY, A C. (1988). “Stock Market Prices Do Not Follow Random Walks. Evidence from a Simple
Specification Test”, Review of Financial Studies, Vol. 1, No. 1, pp. 41-66.
MAGNUSSON, M.A. AND B. WYDICK (2002). “How Efficient are Africa’s Emerging Stock Markets?”, The Journal of
Development Studies, Vol. 38, No.4, pp. 141-156.
SMITH, G., JEFFERIS, K. AND RYOO, H-J. (2002). “African stock markets: multiple variance ratio tests of random
walks”, Applied Financial Economics, Vol. 12, No. 7, pp. 475-484.
STANDARD AND POORS (2004). Global Stock Markets Factbook, New York. Standard & Poors.
THOMPSON, A. R. AND WARD, M.J.D. (1995). “The Johannesburg Stock Exchange as an Efficient Market: a Review”,
Studies in Economics and Econometrics, Vol. 19, No. 3, pp. 33-63.
ZALEWSKA-MITURA, A. AND HALL S.G. (1999). “Examining the first stages of market performance: a test for evolving
market efficiency”, Economics Letters, Vol. 64, No. 1, pp. 1-12.
© 2005 Economic Society of South Africa. 67