2008 Developing Financial Services and Improving the Efficiency of the Bank...
2010 Q1: Feature on the 2010 Monetary Policy Statement and Budget
1. Bifm Economic Review 1st Quarter 2010
Economic Review
Dr. Keith Jefferis
Chairman of Bifm Investment Committee
INTRODUCTION GLOBAL ECONOMY
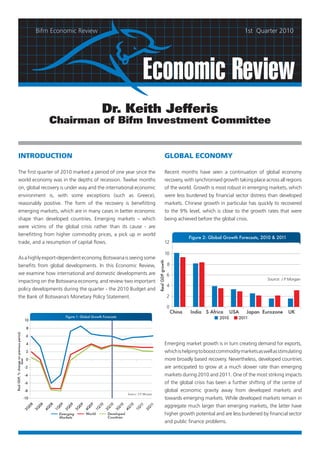
The first quarter of 2010 marked a period of one year since the Recent months have seen a continuation of global economy
world economy was in the depths of recession. Twelve months recovery, with synchronised growth taking place across all regions
on, global recovery is under way and the international economic of the world. Growth is most robust in emerging markets, which
environment is, with some exceptions (such as Greece), were less burdened by financial sector distress than developed
reasonably positive. The form of the recovery is benefitting markets. Chinese growth in particular has quickly to recovered
emerging markets, which are in many cases in better economic to the 9% level, which is close to the growth rates that were
shape than developed countries. Emerging markets – which being achieved before the global crisis.
were victims of the global crisis rather than its cause - are
benefitting from higher commodity prices, a pick up in world
Figure 2: Global Growth Forecasts, 2010 & 2011
trade, and a resumption of capital flows. 12
10
As a highly export-dependent economy, Botswana is seeing some
Real GDP growth
benefits from global developments. In this Economic Review, 8
we examine how international and domestic developments are 6
Source: J P Morgan
impacting on the Botswana economy, and review two important
4
policy developments during the quarter - the 2010 Budget and
the Bank of Botswana’s Monetary Policy Statement. 2
0
China India S Africa USA Japan Eurozone UK
Figure 1: Global Growth Forecasts 2010 2011
10
8
Real GDP, % change on previous period,
6
4 Emerging market growth is in turn creating demand for exports,
2 which is helping to boost commodity markets as well as stimulating
0 more broadly based recovery. Nevertheless, developed countries
saar
-2 are anticipated to grow at a much slower rate than emerging
-4 markets during 2010 and 2011. One of the most striking impacts
-6 of the global crisis has been a further shifting of the centre of
-8 global economic gravity away from developed markets and
Source: J P Morgan
-10 towards emerging markets. While developed markets remain in
aggregate much larger than emerging markets, the latter have
08
08
08
09
09
09
09
10
10
10
10
11
11
1Q
2Q
1Q
2Q
3Q
4Q
2Q
3Q
4Q
1Q
2Q
3Q
4Q
Emerging World Developed higher growth potential and are less burdened by financial sector
Markets Countries
and public finance problems.
2. 2 Economic Review
Although fears of a prolonged global recession have now Figure 4: DTC Diamond Sights
800
dissipated, the potential dangers of a “double dip” recession
700
have not. Many large countries are still grappling with the Source: Rapaport News
600
problems of when to withdraw the fiscal stimulus packages that
Sales value, US$ mn
500
have mitigated the impact of the global crisis, but at the cost
400
of sharp increases in public debt. Withdrawing fiscal stimulus
300
too early could undermine the growth recovery, while leaving
200
it too late stores up even larger debt problems for the future.
100
These debt problems are perhaps most apparent in the euro
0
zone, where Greece’s debt crisis has spooked the markets and
2007 2008 2009 2010
undermined the common currency, even though the Greek
economy is too small to be of any great significance in the euro
area. The real fears relate to whether the Greek crisis is simply a
BOTswANA ECONOMY
sign of things to come in other larger and more important euro
Economic Growth
zone economies, or indeed outside of the euro zone where the
UK and the US also have very large debt burdens.
The 2009 GDP figures released by the Central Statistics Office
(CSO) have been subject to a variety of different interpretations
The global recovery has had a dramatic impact on commodity
and some misunderstanding. The annual data confirm that 2009
prices, which have risen sharply. This is generally good for
was a year of recession for Botswana, with GDP contracting
Botswana, as a major commodity exporter, although this is
by 6%. This is the lowest GDP growth figure recorded since
partially offset by the country’s consumption of oil imports.
the current data series began in 1975, and the only period of
Copper prices have almost recovered to their peak level of
substantive recession over that period.
2008, and nickel prices have more than doubled over the past
year. Rough diamond prices have also surged on increased
demand, and this has helped to stimulate a sharp increase in Figure 5: Annual GDP Growth
diamond sales through the Diamond Trading Company (DTC) 15%
in the first quarter of 2010. The main concern now is that the 10%
pace of recovery has been too fast, and that we may be seeing 5%
the emergence of unsustainable bubbles in some commodity 0%
(and stock market) prices. -5%
Source: CSO
-10%
97
98
99
00
01
02
03
04
05
06
07
08
09
19
19
19
20
20
20
20
20
20
20
20
20
20
The GDP outturn for 2009 illustrates one dimension of the
Figure 3: Copper & Nickel prices dramatic impact that global downturn had on the Botswana
10 000 60 000
economy. This was mainly transmitted through the mining sector,
Copper price- per $/tonne
Nickel price- per $/tonne
8 000 50 000
which shrank by a massive 27%. Of the other economic sectors,
40 000
6 000 only manufacturing was also in recession, with a contraction of
30 000
4 000 5%. It was the export dependent sectors (including tourism)
20 000
that were badly hit, while other sectors experienced positive
2 000 10 000
Source: London Metal Exchange growth – particularly transport and communications, personal
0
and social services, construction and agriculture, all of which
2006 2007 2008 2009 2010 grew by more than 10% during 2009.
Copper Nickel
3. 3 Economic Review
The good performance of agriculture is particularly striking, given
Figure 7: Quarterly GDP
the sector’s dismal growth record over the past three decades.
Source: CSO, Econsult
Identifying the source of this growth is not straightforward, 20%
however. The cattle sub-sector grew by only 11%, while crop
Real GDP growth
0%
production – which is in any case very small – shrank by 14%.
Almost all of the growth came from “other agriculture”, which -20%
comprises poultry, pigs, small-stock, bee-keeping, forestry etc. -40%
-60%
Figure 6: GDP Growth by Sector, 2009
-80%
2006 2007 2008 2009
Agriculture
Mining Non-mining private sector GDP
Construction
Personal serv
Transp. & comms
Inflation and Monetary Policy
Fin & bus. Serv.
Government The sharp reduction in inflation from a peak of around 15%
Trade & tourism was one of the more positive economic developments in 2009,
Water & elec especially as it was accompanied by a large cut in interest rates.
Since the end of 2009, inflation has remained around the upper
Manufacturing
end of the Bank of Botswana’s 3%-6% objective range. However,
Total
the likelihood is that inflation will jump sharply in April and May
Mining Source: CSO once the impact of the 2% increase in VAT kicks in, along with
-30% -20% -10% 0 10% 20% 30% higher electricity prices, and we forecast an increase to around
7.5% to 8% in the coming months. There are some reports
Looking beyond the severe contraction of the economy in 2009, that retailers are using the increase in VAT to opportunistically
there are some positive developments. Quarterly GDP data, increase prices, but this would be unjustified and shortsighted
which are more sensitive to short-term changes in economic in the light of weak household spending power. Fortunately,
activity, show that output was picking up towards the end of international inflationary pressures remain very weak, and the
the year. For the first three quarters of 2009, output was lower only real inflationary threat on the horizon is the steady upward
than in the corresponding period in 2008; in the fourth quarter, movement in oil prices, which may well lead to an increase in
however, total GDP was 7% higher than a year earlier. Measured domestic fuel prices in the near future.
on this basis, GDP growth was at its highest since early 2007.
The return to positive growth was driven by recovery in the
Figure 8: Inflation & Forecast
mining sector. 16%
14%
However, it would be a mistake to read too much into this; 12%
the positive growth in 2009Q4 is relative to the previous year 10%
when the global recession was beginning to have a serious 8%
impact, and hence it represents growth from a depressed base. 6%
Second, while mining was recovering, the non-mining sector
4%
was slowing down, with output in the fourth quarter only 3%
2%
Source: CSO, Econsult
higher than a year earlier. So the economic growth picture is
0%
distinctly mixed – an improvement from a year ago, but with no 2003 2004 2005 2006 2007 2008 2009 2010 2011
broad-based recovery in sight.
4. 4 Economic Review
Box: Monetary Policy
Statement, 2010
The Bank of Botswana’s 2010 Monetary Policy Statement How feasible is it likely to be to bring inflation down to
(MPS) was presented on February 25. It included a detailed such levels, which would be the lowest for nearly 40
explanation of inflation and interest rate developments years? The MPS reports that the Bank’s forecasting models
during 2009 – one of the most difficult for policymakers indicate that inflation in the range of 4-5% is achievable.
in Botswana’s recent history – and noted that “the Bank Certainly there is good reason to believe that international
maintained a monetary policy loosening bias with a view to inflationary pressures will be minimal, and the anticipated
providing economic stimulus in an environment in which cutbacks in government spending in Botswana will reduce
the potential for sustained fiscal stimulus was constrained domestic inflationary pressures. All of this bodes well for
by the decline in government revenue”. the achievement of much lower inflation.
At the same time the MPS noted that even though interest However, one of the biggest challenges is achieving
rates had been reduced sharply during 2010 (by a total fundamental change in inflation expectations. As the
of 500 bps), inflation had fallen even more, and hence results of the most recent Business Expectations Survey
monetary policy had actually tightened during the year. show, expectations of inflation remain high – at around
As a result, real interest rates in Botswana at the end of 10% - and are adjusted downwards more slowly than the
2009 were higher than in comparator countries (the UK, rate at which inflation actually falls. This is a barrier to
the USA and South Africa), as well as being higher than achieving lower inflation, as it affects firms’ price-setting
at the end of 2008. behaviour.
Although the Bank acknowledged that inflation would rise The difficulties in changing expectations were well
in the short term due to VAT and potential cost pressures illustrated in the results of the March government bond
from utility charges and rising oil prices, it noted that auction, which for the first time offered a bond with 15
these would be offset to some extent by slower economic year maturity. Such a bond is quite risky, and valuations
growth and reduced demand pressures as a result of are particularly vulnerable to changes in inflation and
declining household incomes (due to the public sector interest rates over the period to maturity. The bond auction
wage freeze and increased VAT) and the slower growth of resulted in a yield of 9.1%, but with most of the issue
government spending. remaining unsold as many bids were above this level, and
were considered to be too high.
Looking further ahead, the Bank expects inflation to fall
within its 3% to 6% objective range early in 2011, and This outcome illustrated a gap in expectations between the
thereafter to be maintained between 4% and 5%. With Government and the market. The Government and Bank
the Bank expecting to maintain a neutral monetary policy of Botswana took the view that with inflation expected to
stance, this would indicate scope for further interest rate be structurally lower over the next 15 years than it has been
cuts when inflation is brought sustainably within the over the past 15, interest rates should continue to fall, and
objective range. an interest rate of 9% would yield an attractive real return.
5. 5 Economic Review
Box: Monetary Policy
Statement, 2010
However, the market view was that with short-term interest Furthermore, with inflation having averaged around
rates having come down by 5.5% since November 2008, 8.5% over the past 15 years, a yield of 9% did not seem
the economy was at a low point in the interest rate cycle, so attractive. Given that private sector expectations seem
which might not be a good time to buy a long-term bond. to be backward-looking and slow to adjust, it will take a
Other factors also contributed to the outcome, including prolonged period of low inflation for those expectations to
a lack of portfolio demand for long maturity bonds, and change.
limited interest from foreign investors.
Financial sector
The financial sector is recovering slowly from the credit Although lending to households continues to dominate
crunch, and activity has since been picking up since the total bank lending, this appears to be more risky than
fourth quarter of last year. In 2009, uncertainty amongst lending to businesses. The value of loans in arrears has risen
potential borrowers, an income squeeze on households, during 2009, but this deterioration has been almost entirely
and more cautious lending behaviour by banks had confined to lending to households, and this will constrain
caused credit growth to slow to zero by the middle of the future lending growth, especially while real incomes remain
year; for the private business sector, credit growth had under pressure from pay restraint in the public sector.
actually turned negative. In the second half of the year, While the overall level of arrears remains of concern, the
and particularly in the final quarter, conditions improved relatively low level of arrears on lending to businesses
and credit growth has turned positive. This suggests an should encourage banks to lend more in this area, which
improvement in business confidence and a willingness by will help to support diversification and growth.
banks to take on more risk.
Figure 9: Credit Growth Figure 10: Arrears on Bank Lending
70% 12%
60%
10%
50%
Growth (qoq, annualised)
% of loans outstanding
40% 8%
30%
6%
20%
10% 4%
0%
2%
-10%
Source: Bank of Botswana, Econsult
Source: Bank of Botswana, Econsult
-20% 0%
2005 2006 2007 2008 2009 2010 2004 2005 2006 2007 2008 2009
Total Households Private Business
Business Household Total
6. 6 Economic Review
Box: The 2010
Budget
The 2010 Budget, delivered in early February, had to address The global crisis has made this even more difficult. In 2009/10,
a very difficult economic and fiscal situation. A sharp increase spending rose to an estimated 46% of GDP – driven by both a
in government spending, planned before the global crisis sharp increase in spending as well as a decline in GDP. Estimated
took hold, helped to sustain the economy through the global revenues fell to 31% of GDP, resulting in a massive budget deficit
recession and the downturn in the mining sector. Even without of 15% of GDP.
the global crisis, this would have posed challenges for fiscal
sustainability. But the crisis led to a sharp drop in government Although the medium-term fiscal requirement is to cut spending
revenues from the mining sector, which was compounded by a considerably, judging the appropriate timing for this is very
decline in revenues from the Southern African Customs Union difficult. As in many other countries, one major concern is that
(SACU), leading to a dramatic escalation in the fiscal deficit. The premature spending cuts and withdrawal of fiscal stimulus will
deficit has been financed by a combination of drawing down of undermine economic recovery and growth during a difficult
accumulated savings and an increase in public debt, which, for period. But delaying fiscal adjustment will lead to the rapid
the first time, has risen to levels that need careful monitoring depletion of the savings that have been accumulated over many
and management. years of mineral-led growth, and/or the accumulation of high
and possibly unsustainable public debt.
The crux of Botswana’s fiscal problem is that the global crisis has
compounded adverse long-term fiscal trends. The economy had The 2010 Budget entails a modest containment of expenditure,
become accustomed to a high level of fiscal revenues, which had which is set to fall by around P2 billion in 2010/11 compared to
averaged 40% of GDP until 2006/7, and government spending the previous year. What is striking is that revenues are expected
was geared to this level of revenues. Indeed, the “Fiscal Rule” to continue at very weak levels, even with recovery in the global
adopted during the Mid-term Review of NDP 9 stated formally economy. For diamond revenues, the problem is that even with
that government spending would average 40% of GDP over the global market recovering, sales are projected to remain
the economic cycle. below recent peaks for some time. Furthermore, the capital
spending required for the Cut 8 Jwaneng expansion also has
While this may have been reasonable on a historical basis, it the effect of reducing government mineral receipts. In addition,
has become clear that it would not be sustainable in the future. SACU revenues are expected to fall sharply because of the need
Government revenues have been declining in relation to GDP to return past overpayments.
since 2006/7, a trend that the global crisis has accelerated. In
the medium-term, government revenues are likely to fall further For the first time, the Budget included medium-term fiscal
as the importance of diamonds declines. projections, giving revenue and expenditure forecasts for
three years ahead, in contrast to the normal one year. This is a
A typical middle-income country would expect government welcome development, although more detail is needed in the
revenues in the region of 25%-30% of GDP, or even less – for medium term forecasts to improve their usefulness. However,
instance revenues and spending in Mauritius fall between 20% these forecasts indicate that efforts will be made to restore
and 25% of GDP. For Botswana, the expectation is that revenues fiscal sustainability and achieve a balanced budget by 2012/13.
will decline to under 30% of GDP, and hence spending will While an improvement in revenues is expected in due course as
have to be cut substantially in order to achieve medium-term the diamond market recovers and SACU revenues normalise,
fiscal sustainability. This is a formidable challenge, as spending the main tool for achieving the planned balanced budget is the
has to be cut by around one-quarter, relative to the size of the curtailment of spending, as well as modest tax increases such as
economy, as compared to the NDP 9 Fiscal Rule. the 2% increase in VAT in April this year.
7. 7 Economic Review
Figure 11: Revenue & Spending For 2010/11, a second large budget deficit is projected, at
50% P12 billion or 12% of GDP. This also illustrates the need for
40% rapid fiscal adjustment. Going into the crisis, government’s net
30% financial position (assets at BoB less domestic and foreign debt)
amounted to P42 billion as at March 2008.
% of GDP
20%
Source: MFDP, Econsult
10%
0% The deficits projected for the four financial years 2008/9 –
-10%
2011/12 amount to P36 billion. In other words, four years of
deficits are projected to deplete 87% of government’s net
-20%
financial assets built up over years of budget surpluses.
4
1
3
5
6
7
8
9
0
/0
/1
/0
/0
/0
/0
/0
/0
/1
03
10
02
04
05
06
07
08
09
20
20
20
20
20
20
20
20
20
Balance Revenues Spending
Further large deficits would transform the government from
Spending is planned to be flat in nominal terms for the next being a net creditor into a net debtor. Given this rapid depletion
three years, indicating lower spending in real terms and as a of financial assets, it was perhaps inevitable that Botswana’s
share of GDP – indeed spending is set to fall from 46% of GDP credit rating has been downgraded, given that it was initially
in 2009/10 to 32% in 2012/13. The balance will shift back based to a large extent on the strength of the public sector
towards recurrent spending with a smaller share for development balance sheet. While the credit rating remains investment grade,
spending. The development budget, which ballooned from P4.0 maintaining this position depends on convincing the markets
billion in 2006/7 to P14.5 billion in 2009/10, is to be reduced to and ratings agencies that the country is on course to achieve
P9.1 billion in 2012/13. fiscal sustainability in the medium term.
OUTLOOK
The end of 2009 and the first quarter of 2010 has seen the Unemployment remains persistently high, putting a damper on
economy perform better than was perhaps anticipated a year consumer confidence. And the lack of clarity over how high
ago during the depths of the global financial and economic levels of public debt are going to be dealt with, raising the
crisis. Commodities markets have recovered strongly, including prospect of future tax increases, all suggest a weak recovery in
the international diamond market. This has helped to stimulate the main developed country markets.
activity in Botswana’s mining sector, which should contribute
to a strong GDP growth performance in 2010 after causing a The sectors of the economy that depend on domestic rather
sharp contraction and recession in 2009. than export demand are facing a difficult time in 2010. The main
sources of that demand – government spending and household
Relative to expectations a year ago, performance has been consumption – are under pressure and are unlikely to be leading
good. But the emphasis is on the word relative. The recovery growth over the next 18 months. So although the headline GDP
in exports has only been partial; at least up until the end of growth figure in 2010 is likely to look good, at between 5%
2009 the trade balance was still negative and the foreign and 10%, driven by recovery in the mining sector, conditions
exchange reserves were continuing to fall. The recovery in the in much of the economy will feel worse. The key policy tasks
diamond market is partly driven by restocking and rebuilding of remain improving the efficiency of government, enabling
inventories in the pipeline that were run down during the crisis, key priorities to be addressed but with fewer resources, and
assisted by the easing of credit conditions. Retail conditions in improving the business climate to support recovery and growth
the main developed country markets – the USA and Europe – in the non-mining private sector.
remain uncertain. The private sector is de-leveraging, which
means that expenditure will rise more slowly than income.
Bifm Botswana Limited
Asset Management, Property Management, Private Equity, Corporate Advisory Services.
Private Bag BR 185, Broadhurst, Botswana, Tel: +(267) 395 1564, Fax: +(267) 390 0358, www.bifm.co.bw
Dynamic Wealth Management Disclaimer: The views expressed in this publication are those of the author and do not necessarily reflect those of Bifm