SlideShare une entreprise Scribd logo
1  sur  12
Télécharger pour lire hors ligne
Librarysurvey hosted by OverDrive and American
  eBook eBook Survey hosted by OverDrive
and American Library Association (ALA)
  Library Association (ALA)


   1. State of residency:

                                                              Response    Response
                                                               Percent       Count

                                      Alabama                     0.8%             583


                                        Alaska                    0.5%             394


                                       Arizona                    1.4%           1,032


                                     Arkansas                     1.0%             737


                                    California                    7.2%           5,428


                                     Colorado                     2.7%           2,031


                                 Connecticut                      1.0%             761


                      District of Columbia                        0.1%               94


                                     Delaware                     0.3%             214


                                        Florida                   7.2%           5,422


                                       Georgia                    2.6%           1,977


                                        Hawaii                    0.5%             366


                                          Idaho                   0.5%             395


                                         Illinois                 3.0%           2,289


                                       Indiana                    2.8%           2,108


                                           Iowa                   1.5%           1,137


                                       Kansas                     0.3%             237


                                    Kentucky                      1.5%           1,130


                                     Louisiana                    1.8%           1,384


                                         Maine                    0.8%             581


                                                    1 of 12
Survey conducted online June 13 – July 31, 2012                     © 2012 OverDrive Inc.
 at U.S. public library websites.
Maryland                0.9%            684


                            Massachusetts                   2.6%          1,977


                                     Michigan               3.4%          2,578


                                   Minnesota                3.4%          2,590


                                  Mississippi               0.3%            203


                                      Missouri              2.4%          1,799


                                     Montana                0.6%            436


                                    Nebraska                1.2%            878


                                      Nevada                0.5%            392


                           New Hampshire                    1.2%            883


                                 New Jersey                 1.5%          1,165


                                 New Mexico                 0.6%            417


                                   New York                 8.0%          6,007


                             North Carolina                 0.9%            689


                               North Dakota                 0.1%              48


                                          Ohio              4.7%          3,545


                                   Oklahoma                 1.8%          1,378


                                       Oregon               2.7%          2,003


                              Pennsylvania                  4.0%          2,990


                               Rhode Island                 0.7%            556


                             South Carolina                 1.7%          1,257


                              South Dakota                  0.3%            256


                                  Tennessee                 2.6%          1,938


                                        Texas               5.6%          4,256


                                          Utah              0.8%            627


                                     Vermont                0.1%            104


                                                  2 of 12
Survey conducted online June 13 – July 31, 2012               © 2012 OverDrive Inc.
 at U.S. public library websites.
Virginia                         4.3%           3,204


                                 Washington                             5.2%           3,947


                                West Virginia                           0.2%             186


                                   Wisconsin                            0.0%               29


                                    Wyoming                             0.1%               62


                                                            answered question        75,384


                                                             skipped question               1


   2. Gender:

                                                                    Response    Response
                                                                     Percent       Count

                                       Female                          78.4%         59,109


                                           Male                        21.6%         16,275


                                                            answered question        75,384


                                                             skipped question               1


                                                  3 of 12
Survey conducted online June 13 – July 31, 2012                           © 2012 OverDrive Inc.
 at U.S. public library websites.
3. Age:

                                                                            Response    Response
                                                                             Percent       Count

                                          13-17                                 3.0%           2,255


                                          18-29                                 8.6%           6,517


                                          30-39                                16.7%         12,578


                                          40-49                                20.1%         15,136


                                          50-64                                34.9%         26,304


                                          65-70                                 9.8%           7,403


                                            71+                                 6.9%           5,191


                                                                    answered question        75,384


                                                                     skipped question               1


   4. OPTIONAL: What is your household income, including all earners in your household?

                                                                            Response    Response
                                                                             Percent       Count

                        $ 20,000 - $29,000                                      9.7%           5,460


                         $30,000 -$ 49,000                                     16.2%           9,121


                         $50,000 - $59,000                                     11.0%           6,185


                         $60,000 -$ 74,999                                     14.9%           8,419


                         $75,000 - $99,999                                     18.7%         10,561


                      $100,000 - $149,000                                      18.9%         10,649


                                  $150,000 +                                   10.7%           6,019


                                                                    answered question        56,414


                                                                     skipped question        18,971


                                                  4 of 12
Survey conducted online June 13 – July 31, 2012                                   © 2012 OverDrive Inc.
 at U.S. public library websites.
5. OPTIONAL: What is the highest level of education you have completed?

                                                                             Response    Response
                                                                              Percent       Count

                   Less than High School                                         1.9%           1,332


                        High School / GED                                        6.7%           4,759


                               Some College                                     17.4%         12,386


          2- or 4-Year College Degree                                           40.9%         29,133


       Postgraduate Degree (Master’s,
                                                                                33.1%         23,574
                         Professional, etc.)


                                                                   answered question          71,184


                                                                     skipped question           4,201


Survey conducted online June 13 – July 31, 2012
                                                  5 of 12                          © 2012 OverDrive Inc.
 at U.S. public library websites.
6. How did you learn about downloading eBooks from your library? Please check all that
   apply.

                                                                              Response      Response
                                                                               Percent         Count

          Link from library’s website                                             52.6%          34,206


                   Library’s online catalog                                       22.4%          14,603


   Promotional materials in the library                                           15.8%          10,260


                                      Librarian                                   18.3%          11,891


                        News article / Blog                                       10.8%            7,031


                                   TV / Radio                                       1.3%             871


                         Digital Bookmobile                                         0.8%             516


    Recommendation from a friend or
                                                                                  20.7%          13,470
                             family member


                                          Other                                     3.5%           2,290


                                                                   Other (please specify)
                                                                                                   5,465


                                                                    answered question            65,057


                                                                      skipped question           10,328


                                                  6 of 12
Survey conducted online June 13 – July 31, 2012                                       © 2012 OverDrive Inc.
 at U.S. public library websites.
7. What do you feel are the benefits of using the library's download service? Please check
   all that apply.

                                                                               Response      Response
                                                                                Percent         Count

                                Convenience                                        90.5%          58,883


                                           Free                                    91.8%          59,737


                                 24/7 access                                       85.8%          55,810


                          Selection of titles                                      23.7%          15,393


              Compatibility with devices                                           49.7%          32,352


                                 Ease of use                                       56.0%          36,440


           Accessibility for the visually
                                                                                     4.1%           2,697
                                      impaired


                                                                    Other (please specify)
                                                                                                    1,808


                                                                     answered question            65,057


                                                                       skipped question           10,328


   8. How long have you been downloading eBooks from your library?

                                                                               Response      Response
                                                                                Percent         Count

                      This is my first time                                          9.2%           6,004


                                    0-1 month                                        5.4%           3,519


                                  1-3 months                                       10.7%            6,940


                                  3-6 months                                       19.1%          12,458


                     More than 6 months                                            55.5%          36,136


                                                                     answered question            65,057


                                                                       skipped question           10,328


                                                  7 of 12
Survey conducted online June 13 – July 31, 2012                                        © 2012 OverDrive Inc.
 at U.S. public library websites.
9. What device(s) do you use to read eBooks from the library? Please check all that apply.

                                                                                Response      Response
                                                                                 Percent         Count

                     Desktop or laptop PC                                           20.2%          13,162


                   Desktop or laptop Mac                                              4.2%           2,753


       eBook Reader (e.g., Kindle®,
           Sony® Reader™, Barnes &                                                  83.5%          54,307
                            Noble nook™)

   Smartphone (e.g., iPhone, Android,
                                                                                    19.3%          12,531
                                 BlackBerry)


            Tablet (e.g., iPad®, Galaxy)                                            18.7%          12,182


                                          Other                                       1.7%           1,076


                                                                     Other (please specify)
                                                                                                     2,770


                                                                      answered question            65,057


                                                                        skipped question           10,328


   10. Has your digital borrowing (eBooks, audiobooks, etc.) from the library increased or
   decreased over the past 6 months?

                                                                                Response      Response
                                                                                 Percent         Count

                                   Increased                                        60.4%          39,267


                                   Decreased                                          6.8%           4,431


                          Stayed the same                                           32.8%          21,359


                                                                      answered question            65,057


                                                                        skipped question           10,328


Survey conducted online June 13 – July 31, 2012
                                                  8 of 12                               © 2012 OverDrive Inc.
 at U.S. public library websites.
11. Which statement best describes your average use of the library?

                                                                                                         Response     Response
                                                                                                          Percent       Count

      I visit the physical library but am
                                                                                                            11.1%           7,217
             new to downloading eBooks.


     I both visit the physical library
    and download eBooks from the                                                                            53.1%          34,577
                                       library.

    I rarely or never visit the physical
     library but download eBooks from                                                                       31.2%          20,323
                                   the library.


    I rarely or never visit the physical
    library and am new to downloading                                                                        4.5%           2,940
                                       eBooks.


                                                                                                 answered question         65,057


                                                                                                  skipped question         10,328


    12. OPTIONAL: In a typical month, how often do you visit the library (# of visits)?

                                                                                                         Response     Response
                                                                                                          Percent       Count

                            Physical branch
                                                                                                            94.6%          53,846


                             Virtual branch
                                                                                                            95.4%          54,303


                                                                                                 answered question         56,913


                                                                                                  skipped question         18,472

                                                  Average # of visits: Physical - 2.4, Digital - 6.9


Survey conducted online June 13 – July 31, 2012
                                                                      9 of 12                                  © 2012 OverDrive Inc.
 at U.S. public library websites.
13. OPTIONAL: In a typical month, how many books (digital and physical) do you purchase at
   13. OPTIONAL: In a typical month, how many books (digital and physical) do you purchase at
   retail (includingIn a typical month, how many books (digital and physical) do you purchase at
   13. OPTIONAL: audiobooks)?
   retail (including audiobooks)?
   retail (including audiobooks)?
                                                                                                    Response     Response
                                                                                                    Response     Response
                                                                                                    Response
                                                                                                     Percent     Response
                                                                                                                  Count
                                                                                                     Percent      Count
                                                                                                     Percent      Count
    Physical books from physical and
    Physical books from physical and
    Physical books from physical and
                    online booksellers                                                                 93.8%          52,011
                    online booksellers                                                                 93.8%          52,011
                    online booksellers                                                                 93.8%          52,011


               Digital books (eBooks,
               Digital books (eBooks,
               Digital books (eBooks,
             audiobooks) from online
             audiobooks) from online                                                                   97.8%          54,216
             audiobooks) booksellers
                          from online                                                                  97.8%          54,216
                          booksellers                                                                  97.8%          54,216
                          booksellers


                                                                                            answered question         55,461
                                                                                            answered question         55,461
                                                                                            answered question         55,461
                                                                                             skipped question         19,924
                                                                                             skipped question         19,924
                                                                                             skipped question         19,924
                             Average # of books purchased: Physical - 1.0, Digital - 2.2

   14. OPTIONAL: Have your book purchases increased or decreased over the past 6 months?
   14. OPTIONAL: Have your book purchases increased or decreased over the past 6 months?
   14. OPTIONAL: Have your book purchases increased or decreased over the past 6 months?

                                                    Increased               Decreased                 Stayed the same
                                                    Increased               Decreased                 Stayed the same
                                                    Increased               Decreased                 Stayed the same

                             Physical books        4.1% (2,228)            43.4% (23,614)              52.5% (28,517)
                             Physical books        4.1% (2,228)            43.4% (23,614)              52.5% (28,517)
                             Physical books        4.1% (2,228)            43.4% (23,614)              52.5% (28,517)
                                Digital books     43.5% (23,828)           12.7% (6,962)               43.7% (23,938)
                                Digital books     43.5% (23,828)           12.7% (6,962)               43.7% (23,938)
                                Digital books     43.5% (23,828)           12.7% (6,962)               43.7% (23,938)
                                                                                                        answered question
                                                                                                        answered question
                                                                                                        answered question
                                                                                                         skipped question
                                                                                                         skipped question
                                                                                                         skipped question


   15. If a digital audiobook or eBook is unavailable in the library's digital collection or there is
   15. If a digital audiobook or eBook is unavailable in the library's digital collection or there is
   a wait time, would you consider purchasing it from theonline retailer? collection or there is
   15. If a digital audiobook or eBook is unavailable in an library's digital
   a wait time, would you consider purchasing it from an online retailer?
   a wait time, would you consider purchasing it from an online retailer?
                                                                                                    Response     Response
                                                                                                    Response     Response
                                                                                                    Response
                                                                                                     Percent     Response
                                                                                                                  Count
                                                                                                     Percent      Count
                                                                                                     Percent      Count
                                            Yes                                                        53.1%          34,516
                                            Yes                                                        53.1%          34,516
                                            Yes                                                        53.1%          34,516
                                             No                                                        46.9%          30,541
                                             No                                                        46.9%          30,541
                                             No                                                        46.9%          30,541
                                                                                            answered question         65,057
                                                                                            answered question         65,057
                                                                                            answered question         65,057
                                                                                             skipped question         10,328
                                                                                             skipped question         10,328
                                                                                             skipped question         10,328

                                                                10 of 12
Survey conducted online June 13 – July 31, 2012                 10 of 12                                   © 2012 OverDrive Inc.
 at U.S. public library websites.                               10 of 12
16. Have you ever purchased a book (physical or digital) after borrowing that title from the
   library?

                                                                                 Response      Response
                                                                                  Percent         Count

                                            Yes                                      35.3%          22,941


                                             No                                      64.7%          42,116


                                                                       answered question            65,057


                                                                         skipped question           10,328


   17. How do you find or discover books to read? Please check all that apply.

                                                                                 Response      Response
                                                                                  Percent         Count

    Recommendations from family /
                                                                                     75.5%          49,086
                                       friends

                               Public Library                                        57.5%          37,387


     Reviews (newspaper, magazines,
                                                                                     74.3%          48,332
                                        online)


                  Store recommendations                                              21.2%          13,767


                                          Other                                        8.0%           5,186


                                                                      Other (please specify)
                                                                                                    13,999


                                                                       answered question            65,057


                                                                         skipped question           10,328


                                                  11 of 12
Survey conducted online June 13 – July 31, 2012                                          © 2012 OverDrive Inc.
 at U.S. public library websites.
18. Please rank your preferred source for books (1 = most preferred, 6 = least preferred):

                                                                                                                       Response
                                                     1          2              3       4          5          6
                                                                                                                          Count

                                                   5.8%      11.4%        21.6%     19.7%      20.1%      21.4%
                        Physical bookstore                                                                                  65,055
                                                  (3,775)    (7,396)     (14,046)   (12,845)   (13,092)   (13,901)


                                                  19.7%      29.0%        17.2%     14.0%      13.1%       7.0%
                           Online bookstore                                                                                 65,055
                                                  (12,791)   (18,837)    (11,216)   (9,113)    (8,525)    (4,573)


                                                  60.0%      17.3%         8.5%      4.7%       3.8%       5.7%
                               Public Library                                                                               65,055
                                                  (39,009)   (11,261)     (5,537)   (3,084)    (2,487)    (3,677)


  General store with books (e.g., Wal-             3.6%       6.0%        12.8%     23.5%      24.2%      30.0%
                                                                                                                            65,055
                                Mart, Target)     (2,341)    (3,897)      (8,315)   (15,270)   (15,726)   (19,506)

                                                   4.6%      13.5%        21.0%     21.0%      20.3%      19.6%
                  Second-hand bookstore                                                                                     65,055
                                                  (2,968)    (8,789)     (13,650)   (13,663)   (13,203)   (12,782)


                                                   6.4%      22.9%        18.9%     17.0%      18.5%      16.3%
           Borrow from family / friends                                                                                     65,055
                                                  (4,171)    (14,875)    (12,291)   (11,080)   (12,022)   (10,616)


                                                                                               answered question            65,055


                                                                                                 skipped question           10,330


Survey Methodology
The survey, sponsored by OverDrive with the American Library Association Office for Information
Technology Policy, was conducted from June 13 to July 31, 2012 at thousands of US public library websites
powered by OverDrive. 75,384 visitors to the libraries’ eBook catalog pages completed all or part of
the survey. The survey was intended to provide insights into borrowing and buying behaviors of library eBook
readers and is not representative of the US population as a whole. For more information about the survey,
please visit the OverDrive Digital Library Blog or contact info@overdrive.com.

For more information about OverDrive, please visit www.overdrive.com. For more information about the
ALA Office for Information Technology Policy, please visit www.ala.org/offices/oitp.


Survey conducted online June 13 – July 31, 2012
                                                                    12 of 12                                     © 2012 OverDrive Inc.
 at U.S. public library websites.

Contenu connexe

En vedette

Product Design Trends in 2024 | Teenage Engineerings
Product Design Trends in 2024 | Teenage EngineeringsProduct Design Trends in 2024 | Teenage Engineerings
Product Design Trends in 2024 | Teenage EngineeringsPixeldarts
 
How Race, Age and Gender Shape Attitudes Towards Mental Health
How Race, Age and Gender Shape Attitudes Towards Mental HealthHow Race, Age and Gender Shape Attitudes Towards Mental Health
How Race, Age and Gender Shape Attitudes Towards Mental HealthThinkNow
 
AI Trends in Creative Operations 2024 by Artwork Flow.pdf
AI Trends in Creative Operations 2024 by Artwork Flow.pdfAI Trends in Creative Operations 2024 by Artwork Flow.pdf
AI Trends in Creative Operations 2024 by Artwork Flow.pdfmarketingartwork
 
PEPSICO Presentation to CAGNY Conference Feb 2024
PEPSICO Presentation to CAGNY Conference Feb 2024PEPSICO Presentation to CAGNY Conference Feb 2024
PEPSICO Presentation to CAGNY Conference Feb 2024Neil Kimberley
 
Content Methodology: A Best Practices Report (Webinar)
Content Methodology: A Best Practices Report (Webinar)Content Methodology: A Best Practices Report (Webinar)
Content Methodology: A Best Practices Report (Webinar)contently
 
How to Prepare For a Successful Job Search for 2024
How to Prepare For a Successful Job Search for 2024How to Prepare For a Successful Job Search for 2024
How to Prepare For a Successful Job Search for 2024Albert Qian
 
Social Media Marketing Trends 2024 // The Global Indie Insights
Social Media Marketing Trends 2024 // The Global Indie InsightsSocial Media Marketing Trends 2024 // The Global Indie Insights
Social Media Marketing Trends 2024 // The Global Indie InsightsKurio // The Social Media Age(ncy)
 
Trends In Paid Search: Navigating The Digital Landscape In 2024
Trends In Paid Search: Navigating The Digital Landscape In 2024Trends In Paid Search: Navigating The Digital Landscape In 2024
Trends In Paid Search: Navigating The Digital Landscape In 2024Search Engine Journal
 
5 Public speaking tips from TED - Visualized summary
5 Public speaking tips from TED - Visualized summary5 Public speaking tips from TED - Visualized summary
5 Public speaking tips from TED - Visualized summarySpeakerHub
 
ChatGPT and the Future of Work - Clark Boyd
ChatGPT and the Future of Work - Clark Boyd ChatGPT and the Future of Work - Clark Boyd
ChatGPT and the Future of Work - Clark Boyd Clark Boyd
 
Getting into the tech field. what next
Getting into the tech field. what next Getting into the tech field. what next
Getting into the tech field. what next Tessa Mero
 
Google's Just Not That Into You: Understanding Core Updates & Search Intent
Google's Just Not That Into You: Understanding Core Updates & Search IntentGoogle's Just Not That Into You: Understanding Core Updates & Search Intent
Google's Just Not That Into You: Understanding Core Updates & Search IntentLily Ray
 
Time Management & Productivity - Best Practices
Time Management & Productivity -  Best PracticesTime Management & Productivity -  Best Practices
Time Management & Productivity - Best PracticesVit Horky
 
The six step guide to practical project management
The six step guide to practical project managementThe six step guide to practical project management
The six step guide to practical project managementMindGenius
 
Beginners Guide to TikTok for Search - Rachel Pearson - We are Tilt __ Bright...
Beginners Guide to TikTok for Search - Rachel Pearson - We are Tilt __ Bright...Beginners Guide to TikTok for Search - Rachel Pearson - We are Tilt __ Bright...
Beginners Guide to TikTok for Search - Rachel Pearson - We are Tilt __ Bright...RachelPearson36
 
Unlocking the Power of ChatGPT and AI in Testing - A Real-World Look, present...
Unlocking the Power of ChatGPT and AI in Testing - A Real-World Look, present...Unlocking the Power of ChatGPT and AI in Testing - A Real-World Look, present...
Unlocking the Power of ChatGPT and AI in Testing - A Real-World Look, present...Applitools
 
12 Ways to Increase Your Influence at Work
12 Ways to Increase Your Influence at Work12 Ways to Increase Your Influence at Work
12 Ways to Increase Your Influence at WorkGetSmarter
 

En vedette (20)

Product Design Trends in 2024 | Teenage Engineerings
Product Design Trends in 2024 | Teenage EngineeringsProduct Design Trends in 2024 | Teenage Engineerings
Product Design Trends in 2024 | Teenage Engineerings
 
How Race, Age and Gender Shape Attitudes Towards Mental Health
How Race, Age and Gender Shape Attitudes Towards Mental HealthHow Race, Age and Gender Shape Attitudes Towards Mental Health
How Race, Age and Gender Shape Attitudes Towards Mental Health
 
AI Trends in Creative Operations 2024 by Artwork Flow.pdf
AI Trends in Creative Operations 2024 by Artwork Flow.pdfAI Trends in Creative Operations 2024 by Artwork Flow.pdf
AI Trends in Creative Operations 2024 by Artwork Flow.pdf
 
Skeleton Culture Code
Skeleton Culture CodeSkeleton Culture Code
Skeleton Culture Code
 
PEPSICO Presentation to CAGNY Conference Feb 2024
PEPSICO Presentation to CAGNY Conference Feb 2024PEPSICO Presentation to CAGNY Conference Feb 2024
PEPSICO Presentation to CAGNY Conference Feb 2024
 
Content Methodology: A Best Practices Report (Webinar)
Content Methodology: A Best Practices Report (Webinar)Content Methodology: A Best Practices Report (Webinar)
Content Methodology: A Best Practices Report (Webinar)
 
How to Prepare For a Successful Job Search for 2024
How to Prepare For a Successful Job Search for 2024How to Prepare For a Successful Job Search for 2024
How to Prepare For a Successful Job Search for 2024
 
Social Media Marketing Trends 2024 // The Global Indie Insights
Social Media Marketing Trends 2024 // The Global Indie InsightsSocial Media Marketing Trends 2024 // The Global Indie Insights
Social Media Marketing Trends 2024 // The Global Indie Insights
 
Trends In Paid Search: Navigating The Digital Landscape In 2024
Trends In Paid Search: Navigating The Digital Landscape In 2024Trends In Paid Search: Navigating The Digital Landscape In 2024
Trends In Paid Search: Navigating The Digital Landscape In 2024
 
5 Public speaking tips from TED - Visualized summary
5 Public speaking tips from TED - Visualized summary5 Public speaking tips from TED - Visualized summary
5 Public speaking tips from TED - Visualized summary
 
ChatGPT and the Future of Work - Clark Boyd
ChatGPT and the Future of Work - Clark Boyd ChatGPT and the Future of Work - Clark Boyd
ChatGPT and the Future of Work - Clark Boyd
 
Getting into the tech field. what next
Getting into the tech field. what next Getting into the tech field. what next
Getting into the tech field. what next
 
Google's Just Not That Into You: Understanding Core Updates & Search Intent
Google's Just Not That Into You: Understanding Core Updates & Search IntentGoogle's Just Not That Into You: Understanding Core Updates & Search Intent
Google's Just Not That Into You: Understanding Core Updates & Search Intent
 
How to have difficult conversations
How to have difficult conversations How to have difficult conversations
How to have difficult conversations
 
Introduction to Data Science
Introduction to Data ScienceIntroduction to Data Science
Introduction to Data Science
 
Time Management & Productivity - Best Practices
Time Management & Productivity -  Best PracticesTime Management & Productivity -  Best Practices
Time Management & Productivity - Best Practices
 
The six step guide to practical project management
The six step guide to practical project managementThe six step guide to practical project management
The six step guide to practical project management
 
Beginners Guide to TikTok for Search - Rachel Pearson - We are Tilt __ Bright...
Beginners Guide to TikTok for Search - Rachel Pearson - We are Tilt __ Bright...Beginners Guide to TikTok for Search - Rachel Pearson - We are Tilt __ Bright...
Beginners Guide to TikTok for Search - Rachel Pearson - We are Tilt __ Bright...
 
Unlocking the Power of ChatGPT and AI in Testing - A Real-World Look, present...
Unlocking the Power of ChatGPT and AI in Testing - A Real-World Look, present...Unlocking the Power of ChatGPT and AI in Testing - A Real-World Look, present...
Unlocking the Power of ChatGPT and AI in Testing - A Real-World Look, present...
 
12 Ways to Increase Your Influence at Work
12 Ways to Increase Your Influence at Work12 Ways to Increase Your Influence at Work
12 Ways to Increase Your Influence at Work
 

Ala od survey

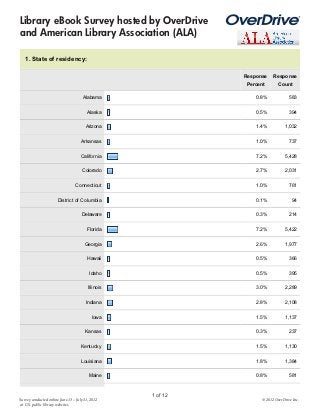
  • 1. Librarysurvey hosted by OverDrive and American eBook eBook Survey hosted by OverDrive and American Library Association (ALA) Library Association (ALA) 1. State of residency: Response Response Percent Count Alabama 0.8% 583 Alaska 0.5% 394 Arizona 1.4% 1,032 Arkansas 1.0% 737 California 7.2% 5,428 Colorado 2.7% 2,031 Connecticut 1.0% 761 District of Columbia 0.1% 94 Delaware 0.3% 214 Florida 7.2% 5,422 Georgia 2.6% 1,977 Hawaii 0.5% 366 Idaho 0.5% 395 Illinois 3.0% 2,289 Indiana 2.8% 2,108 Iowa 1.5% 1,137 Kansas 0.3% 237 Kentucky 1.5% 1,130 Louisiana 1.8% 1,384 Maine 0.8% 581 1 of 12 Survey conducted online June 13 – July 31, 2012 © 2012 OverDrive Inc. at U.S. public library websites.
  • 2. Maryland 0.9% 684 Massachusetts 2.6% 1,977 Michigan 3.4% 2,578 Minnesota 3.4% 2,590 Mississippi 0.3% 203 Missouri 2.4% 1,799 Montana 0.6% 436 Nebraska 1.2% 878 Nevada 0.5% 392 New Hampshire 1.2% 883 New Jersey 1.5% 1,165 New Mexico 0.6% 417 New York 8.0% 6,007 North Carolina 0.9% 689 North Dakota 0.1% 48 Ohio 4.7% 3,545 Oklahoma 1.8% 1,378 Oregon 2.7% 2,003 Pennsylvania 4.0% 2,990 Rhode Island 0.7% 556 South Carolina 1.7% 1,257 South Dakota 0.3% 256 Tennessee 2.6% 1,938 Texas 5.6% 4,256 Utah 0.8% 627 Vermont 0.1% 104 2 of 12 Survey conducted online June 13 – July 31, 2012 © 2012 OverDrive Inc. at U.S. public library websites.
  • 3. Virginia 4.3% 3,204 Washington 5.2% 3,947 West Virginia 0.2% 186 Wisconsin 0.0% 29 Wyoming 0.1% 62 answered question 75,384 skipped question 1 2. Gender: Response Response Percent Count Female 78.4% 59,109 Male 21.6% 16,275 answered question 75,384 skipped question 1 3 of 12 Survey conducted online June 13 – July 31, 2012 © 2012 OverDrive Inc. at U.S. public library websites.
  • 4. 3. Age: Response Response Percent Count 13-17 3.0% 2,255 18-29 8.6% 6,517 30-39 16.7% 12,578 40-49 20.1% 15,136 50-64 34.9% 26,304 65-70 9.8% 7,403 71+ 6.9% 5,191 answered question 75,384 skipped question 1 4. OPTIONAL: What is your household income, including all earners in your household? Response Response Percent Count $ 20,000 - $29,000 9.7% 5,460 $30,000 -$ 49,000 16.2% 9,121 $50,000 - $59,000 11.0% 6,185 $60,000 -$ 74,999 14.9% 8,419 $75,000 - $99,999 18.7% 10,561 $100,000 - $149,000 18.9% 10,649 $150,000 + 10.7% 6,019 answered question 56,414 skipped question 18,971 4 of 12 Survey conducted online June 13 – July 31, 2012 © 2012 OverDrive Inc. at U.S. public library websites.
  • 5. 5. OPTIONAL: What is the highest level of education you have completed? Response Response Percent Count Less than High School 1.9% 1,332 High School / GED 6.7% 4,759 Some College 17.4% 12,386 2- or 4-Year College Degree 40.9% 29,133 Postgraduate Degree (Master’s, 33.1% 23,574 Professional, etc.) answered question 71,184 skipped question 4,201 Survey conducted online June 13 – July 31, 2012 5 of 12 © 2012 OverDrive Inc. at U.S. public library websites.
  • 6. 6. How did you learn about downloading eBooks from your library? Please check all that apply. Response Response Percent Count Link from library’s website 52.6% 34,206 Library’s online catalog 22.4% 14,603 Promotional materials in the library 15.8% 10,260 Librarian 18.3% 11,891 News article / Blog 10.8% 7,031 TV / Radio 1.3% 871 Digital Bookmobile 0.8% 516 Recommendation from a friend or 20.7% 13,470 family member Other 3.5% 2,290 Other (please specify) 5,465 answered question 65,057 skipped question 10,328 6 of 12 Survey conducted online June 13 – July 31, 2012 © 2012 OverDrive Inc. at U.S. public library websites.
  • 7. 7. What do you feel are the benefits of using the library's download service? Please check all that apply. Response Response Percent Count Convenience 90.5% 58,883 Free 91.8% 59,737 24/7 access 85.8% 55,810 Selection of titles 23.7% 15,393 Compatibility with devices 49.7% 32,352 Ease of use 56.0% 36,440 Accessibility for the visually 4.1% 2,697 impaired Other (please specify) 1,808 answered question 65,057 skipped question 10,328 8. How long have you been downloading eBooks from your library? Response Response Percent Count This is my first time 9.2% 6,004 0-1 month 5.4% 3,519 1-3 months 10.7% 6,940 3-6 months 19.1% 12,458 More than 6 months 55.5% 36,136 answered question 65,057 skipped question 10,328 7 of 12 Survey conducted online June 13 – July 31, 2012 © 2012 OverDrive Inc. at U.S. public library websites.
  • 8. 9. What device(s) do you use to read eBooks from the library? Please check all that apply. Response Response Percent Count Desktop or laptop PC 20.2% 13,162 Desktop or laptop Mac 4.2% 2,753 eBook Reader (e.g., Kindle®, Sony® Reader™, Barnes & 83.5% 54,307 Noble nook™) Smartphone (e.g., iPhone, Android, 19.3% 12,531 BlackBerry) Tablet (e.g., iPad®, Galaxy) 18.7% 12,182 Other 1.7% 1,076 Other (please specify) 2,770 answered question 65,057 skipped question 10,328 10. Has your digital borrowing (eBooks, audiobooks, etc.) from the library increased or decreased over the past 6 months? Response Response Percent Count Increased 60.4% 39,267 Decreased 6.8% 4,431 Stayed the same 32.8% 21,359 answered question 65,057 skipped question 10,328 Survey conducted online June 13 – July 31, 2012 8 of 12 © 2012 OverDrive Inc. at U.S. public library websites.
  • 9. 11. Which statement best describes your average use of the library? Response Response Percent Count I visit the physical library but am 11.1% 7,217 new to downloading eBooks. I both visit the physical library and download eBooks from the 53.1% 34,577 library. I rarely or never visit the physical library but download eBooks from 31.2% 20,323 the library. I rarely or never visit the physical library and am new to downloading 4.5% 2,940 eBooks. answered question 65,057 skipped question 10,328 12. OPTIONAL: In a typical month, how often do you visit the library (# of visits)? Response Response Percent Count Physical branch 94.6% 53,846 Virtual branch 95.4% 54,303 answered question 56,913 skipped question 18,472 Average # of visits: Physical - 2.4, Digital - 6.9 Survey conducted online June 13 – July 31, 2012 9 of 12 © 2012 OverDrive Inc. at U.S. public library websites.
  • 10. 13. OPTIONAL: In a typical month, how many books (digital and physical) do you purchase at 13. OPTIONAL: In a typical month, how many books (digital and physical) do you purchase at retail (includingIn a typical month, how many books (digital and physical) do you purchase at 13. OPTIONAL: audiobooks)? retail (including audiobooks)? retail (including audiobooks)? Response Response Response Response Response Percent Response Count Percent Count Percent Count Physical books from physical and Physical books from physical and Physical books from physical and online booksellers 93.8% 52,011 online booksellers 93.8% 52,011 online booksellers 93.8% 52,011 Digital books (eBooks, Digital books (eBooks, Digital books (eBooks, audiobooks) from online audiobooks) from online 97.8% 54,216 audiobooks) booksellers from online 97.8% 54,216 booksellers 97.8% 54,216 booksellers answered question 55,461 answered question 55,461 answered question 55,461 skipped question 19,924 skipped question 19,924 skipped question 19,924 Average # of books purchased: Physical - 1.0, Digital - 2.2 14. OPTIONAL: Have your book purchases increased or decreased over the past 6 months? 14. OPTIONAL: Have your book purchases increased or decreased over the past 6 months? 14. OPTIONAL: Have your book purchases increased or decreased over the past 6 months? Increased Decreased Stayed the same Increased Decreased Stayed the same Increased Decreased Stayed the same Physical books 4.1% (2,228) 43.4% (23,614) 52.5% (28,517) Physical books 4.1% (2,228) 43.4% (23,614) 52.5% (28,517) Physical books 4.1% (2,228) 43.4% (23,614) 52.5% (28,517) Digital books 43.5% (23,828) 12.7% (6,962) 43.7% (23,938) Digital books 43.5% (23,828) 12.7% (6,962) 43.7% (23,938) Digital books 43.5% (23,828) 12.7% (6,962) 43.7% (23,938) answered question answered question answered question skipped question skipped question skipped question 15. If a digital audiobook or eBook is unavailable in the library's digital collection or there is 15. If a digital audiobook or eBook is unavailable in the library's digital collection or there is a wait time, would you consider purchasing it from theonline retailer? collection or there is 15. If a digital audiobook or eBook is unavailable in an library's digital a wait time, would you consider purchasing it from an online retailer? a wait time, would you consider purchasing it from an online retailer? Response Response Response Response Response Percent Response Count Percent Count Percent Count Yes 53.1% 34,516 Yes 53.1% 34,516 Yes 53.1% 34,516 No 46.9% 30,541 No 46.9% 30,541 No 46.9% 30,541 answered question 65,057 answered question 65,057 answered question 65,057 skipped question 10,328 skipped question 10,328 skipped question 10,328 10 of 12 Survey conducted online June 13 – July 31, 2012 10 of 12 © 2012 OverDrive Inc. at U.S. public library websites. 10 of 12
  • 11. 16. Have you ever purchased a book (physical or digital) after borrowing that title from the library? Response Response Percent Count Yes 35.3% 22,941 No 64.7% 42,116 answered question 65,057 skipped question 10,328 17. How do you find or discover books to read? Please check all that apply. Response Response Percent Count Recommendations from family / 75.5% 49,086 friends Public Library 57.5% 37,387 Reviews (newspaper, magazines, 74.3% 48,332 online) Store recommendations 21.2% 13,767 Other 8.0% 5,186 Other (please specify) 13,999 answered question 65,057 skipped question 10,328 11 of 12 Survey conducted online June 13 – July 31, 2012 © 2012 OverDrive Inc. at U.S. public library websites.
  • 12. 18. Please rank your preferred source for books (1 = most preferred, 6 = least preferred): Response 1 2 3 4 5 6 Count 5.8% 11.4% 21.6% 19.7% 20.1% 21.4% Physical bookstore 65,055 (3,775) (7,396) (14,046) (12,845) (13,092) (13,901) 19.7% 29.0% 17.2% 14.0% 13.1% 7.0% Online bookstore 65,055 (12,791) (18,837) (11,216) (9,113) (8,525) (4,573) 60.0% 17.3% 8.5% 4.7% 3.8% 5.7% Public Library 65,055 (39,009) (11,261) (5,537) (3,084) (2,487) (3,677) General store with books (e.g., Wal- 3.6% 6.0% 12.8% 23.5% 24.2% 30.0% 65,055 Mart, Target) (2,341) (3,897) (8,315) (15,270) (15,726) (19,506) 4.6% 13.5% 21.0% 21.0% 20.3% 19.6% Second-hand bookstore 65,055 (2,968) (8,789) (13,650) (13,663) (13,203) (12,782) 6.4% 22.9% 18.9% 17.0% 18.5% 16.3% Borrow from family / friends 65,055 (4,171) (14,875) (12,291) (11,080) (12,022) (10,616) answered question 65,055 skipped question 10,330 Survey Methodology The survey, sponsored by OverDrive with the American Library Association Office for Information Technology Policy, was conducted from June 13 to July 31, 2012 at thousands of US public library websites powered by OverDrive. 75,384 visitors to the libraries’ eBook catalog pages completed all or part of the survey. The survey was intended to provide insights into borrowing and buying behaviors of library eBook readers and is not representative of the US population as a whole. For more information about the survey, please visit the OverDrive Digital Library Blog or contact info@overdrive.com. For more information about OverDrive, please visit www.overdrive.com. For more information about the ALA Office for Information Technology Policy, please visit www.ala.org/offices/oitp. Survey conducted online June 13 – July 31, 2012 12 of 12 © 2012 OverDrive Inc. at U.S. public library websites.