SlideShare a Scribd company logo
1 of 18
ABU CAPITAL LTD

                                                        Projection   Projection   Projection
INPUTS / YEARS               2000     2001      2002         2003         2004         2005              GUIDE ON USAGE
INCOME STATEMENT
Revenues                    825.0    900.0    1,000.0                                          All cells in gray shade are input cells
Percent growth %       na            9.1%      11.1%        10.0%        10.0%        10.0%    and can be modified
Revenues                    825.0    900.0    1,000.0      1,100.0      1,210.0      1,331.0
                                                                                               Cells in white will be automatically
COGS                         450.0    490.0     550.0                                          calculated from the input data you enter
As % revenues               54.5%    54.4%     55.0%        55.0%        55.0%        55.0%    Coloured sheets are calculated automati
COGS                         450.0    490.0     550.0        605.0        665.5        732.1   Thanks
Gross Profit                 375.0    410.0     450.0        495.0        544.5        599.0   Contact
Gross Margin                45.5%    45.6%     45.0%        45.0%        45.0%        45.0%    Abungong Elisha Abungong(Financial M
                                                                                               eabungong@yahoo.com
SGA                          125.0    135.0     150.0                                          Tel: (+237)97333187/77238818
As % revenues               15.2%    15.0%     15.0%        15.0%        15.0%        15.0%    P.O.Box 15744 Douala,
SGA                          125.0    135.0     150.0        165.0        181.5        199.7   Cameroon

Operating expenses            25.0     28.0      30.0
As % revenues                3.0%     3.1%      3.0%         3.0%         3.0%         3.0%
Operating expenses            25.0     28.0      30.0         33.0         36.3         39.9
EBITDA                       225.0    247.0     270.0        297.0        326.7        359.4
EBITDA margin               27.3%    27.4%     27.0%        27.0%        27.0%        27.0%

Depreciation                 60.0      75.0      80.0
As % prior Net PPE     na             8.6%      8.4%         8.5%         8.5%         8.5%
As % revenues               19.5%    18.7%     18.6%
Depreciation                  60.0     75.0      80.0        85.0          91.8       102.5

Amort of intangibles           4.0      4.0       4.0          4.0          4.0          4.0
Amort of intangibles      4.0      4.0      4.0      4.0      4.0      4.0
EBIT                    161.0    168.0    186.0    208.0    230.9    252.9
EBIT margin            19.5%    18.7%    18.6%    18.9%    19.1%    19.0%

Non-oper expenses        10.0     10.0      8.0    10.0     11.0     12.0
As % revenues           1.2%     1.1%     0.8%
Non-oper expenses        10.0     10.0      8.0    10.0     11.0     12.0

Interest income           3.0      5.0      6.0
Surplus fund                                         0.8      0.8      0.0
Cash                                                 4.0      4.0      4.0
ST investments                                       1.7      1.7      1.8
Interest income           3.0      5.0      6.0      6.4      6.5      5.8

Interest Expense        50.0     50.0     50.0
Necessary to Finance                                 0.0      0.7      5.4
ST Notes                                             1.4      1.4      1.4
Debt 1                                              15.0     15.0     15.0
Debt 2                                              22.5     22.5     22.5
Debt 3                                               8.8      8.8      8.8
Interest Expense         50.0     50.0     50.0     47.7     47.7     47.7
EBT                     104.0    113.0    134.0    156.7    178.7    198.9
EBT Margin             12.6%    12.6%    13.4%    14.2%    14.8%    14.9%

Provision for Taxes      36.0     40.0     47.0
Tax Rate %             34.6%    35.4%    35.1%    35.0%    35.0%    35.0%
Provision for Taxes      36.0     40.0     47.0     54.9     62.5     69.6
Net Income               68.0     73.0     87.0    101.9    116.2    129.3
Net Margin              8.2%     8.1%     8.7%     9.3%     9.6%     9.7%

Dividends               10.0     12.0     11.0
Payout Ratio%              14.7%    16.4%    12.6%     10.0%     10.0%     10.0%
Dividends                    10.0     12.0     11.0      10.2      11.6      12.9
Net to Retained Earnings     58.0     61.0     76.0      91.7     104.5     116.4

BALANCE SHEET
CURRENT ASSET INPUT

BALANCE SHEET               2000     2001     2002      2003      2004      2005
ASSETS
Surplus fund                  0.0      0.0      0.0      30.8       0.0       0.0
Interest rate %                                       5.000%    5.000%    5.000%
Interest Income                                           0.8       0.8       0.0

Cash                         60.0     75.0     80.0     80.0      80.0      80.0
% of Revenue                7.3%     8.3%     8.0%
Cash                         60.0     75.0     80.0      80.0      80.0      80.0
Interest rate                                         5.000%    5.000%    5.000%
Interest income                                             4         4         4

ST investments               30.0     32.0     33.0     34.0      35.0      36.1
% growth                    3.6%     3.6%     3.3%
ST investments               30.0     32.0     33.0      34.0      35.0      36.1
Interest rate                                         5.000%    5.000%    5.000%
Interest Income                                           1.7       1.7       1.8

Account Receivable           60.0     75.0     90.0
% of revenues               7.3%     8.3%     9.0%
Days of revenues             26.5     30.4     32.9     30.0      30.0      30.0
Account Receivable           60.0     75.0     90.0     49.7      54.7      60.2

Inventory                  120.0    135.0    150.0
% of revenues                14.5%     15.0%     15.0%
Days of COGS                   53.1      54.8      54.8     98.0      95.0      95.0
Inventory                     120.0     135.0     150.0    162.4     173.2     190.5

Other Current Assets          10.0      10.0      12.0
% of revenues                1.2%      1.1%      1.2%       10%       10%       10%
Other Current Assets          10.0      10.0      12.0     110.0     121.0     133.1
Current Assets               280.0     327.0     365.0     467.0     463.9     499.9

Net PPE                       870.0     950.0   1,000.0
CapEx                         130.0     155.0     130.0
% of revenues                15.8%     17.2%     13.0%     15.0%     18.0%     20.0%
CapEx                         130.0     155.0     130.0     165.0     217.8     266.2
Depreciation                   60.0      75.0      80.0      85.0      91.8     102.5
Net PPE                       870.0     950.0   1,000.0   1,080.0   1,206.0   1,369.7

Intangibles                   58.0      54.0      50.0
Amortization                                                 4.0       4.0       4.0
Intangibles                   58.0      54.0      50.0      46.0      42.0      38.0

Long-term Assets               92.0     116.0     150.0
% of revenues                11.2%     12.9%     15.0%     14.0%     14.0%     14.0%
% growth               na              26.1%     29.3%
Long-term Assets               92.0     116.0     150.0     154.0     169.4     186.3
Total Assets                1,300.0   1,447.0   1,565.0   1,747.0   1,881.3   2,093.9

LIABILITIES
Short-term notes              10.0      12.0      14.0      14.0      14.0      14.0
Interest rate                                              10.0%     10.0%     10.0%
interest expense                                              1.4       1.4       1.4
Account payable              60.0    70.0    80.0
% of revenues               7.3%    7.8%    8.0%
days of COGS                 48.7    52.1    53.1    55.0     55.0     55.0
Account payable              60.0    70.0    80.0    91.2    100.3    110.3

Other Current liabilities    10.0    20.0    20.0
% of revenues               1.2%    2.2%    2.0%    2.0%     2.0%     2.0%
Other Current liabilities    10.0    20.0    20.0    22.0     24.2     26.6
Current Liabilities          80.0   102.0   114.0   127.2    138.5    150.9

Necessary to Finance                                   0.0     14.1     93.2
Interest rate                                       10.0%    10.0%    10.0%
Interest Expense                                       0.0      0.7      5.4

Debt 1                      200.0   225.0   150.0
Debt 1                      200.0   225.0   150.0    150.0    150.0    150.0
Interest Rate                                       10.0%    10.0%    10.0%
Interest expense                                      15.0     15.0     15.0

Debt 2                      200.0   200.0   225.0
Debt 2                      200.0   200.0   225.0    225.0    225.0    225.0
Interest rate                                       10.0%    10.0%    10.0%
Interest expense                                      22.5     22.5     22.5

Debt 3                      110.0   110.0   110.0
Debt 3                      110.0   110.0   110.0   110.0    110.0    110.0
Interest Rate                                       8.0%     8.0%     8.0%
Interest expense                                      8.8      8.8      8.8

Long-term Liabilities         40      38      37
% of Revenues                        4.8%           4.2%           3.7%           4.0%          4.0%       4.0%
% growth                    N/A                    -5.0%          -2.6%
Long-term Liabilities                 40.0           38.0           37.0          44.0           48.4      53.2
Total Liabilities                    630.0         675.0          636.0          656.2          686.0     782.3

SHAREHOLDERS EQUITY
Common stock                         460.0         500.0          580.0          650.0          650.0     650.0

Retained Earnings                    200.0         261.0          337.0
Net to Retained earnings                                                          91.7          104.5     116.4
Retained Earnings                    200.0         261.0          337.0          428.7          533.2     649.6

Other Equity account                  10.0           11.0          12.0
% of revenues                        1.2%           1.2%          1.2%           1.1%           1.0%       0.9%
Other Equity account                  10.0           11.0          12.0           12.1           12.1       12.0
Total SH Equity                      670.0          772.0         929.0        1,090.8        1,195.3    1,311.6
Total Liab & SH Equity             1,300.0        1,447.0       1,565.0        1,747.0        1,881.3    2,093.9

N.B Do not Change the Formulas in this Section. If you Alter your Balance sheet will not Balance
Assets Without SF                   1300            1447           1565        1,716.2         1,881.3   2,093.9
Liab, Equity without NTF            1300            1447           1565        1,747.0         1,867.2   2,000.8


Surplus Funds                          0.0            0.0            0.0          30.8            0.0       0.0
Necessary to Finance                   0.0            0.0            0.0           0.0           14.1      93.2
GUIDE ON USAGE

 gray shade are input cells


hite will be automatically
 from the input data you enter
sheets are calculated automatically


g Elisha Abungong(Financial Modeler)
 g@yahoo.com
 )97333187/77238818
15744 Douala,
ABU CAPITAL LTD

                                                       Projection    Projection    Projection
INPUTS / YEARS              2000     2001      2002             2003          2004          2005
INCOME STATEMENT
Revenues                    825.0    900.0   1,000.0         1,100.0       1,210.0      1,331.0
COGS                        450.0    490.0     550.0           605.0         665.5        732.1
Gross Profit                375.0    410.0     450.0           495.0         544.5        599.0
Gross Margin               45.5%    45.6%     45.0%           45.0%         45.0%        45.0%

SGA                         125.0    135.0     150.0           165.0         181.5         199.7
Operating expenses           25.0     28.0      30.0            33.0          36.3          39.9
EBITDA                      225.0    247.0     270.0           297.0         326.7         359.4
EBITDA margin              27.3%    27.4%     27.0%           27.0%         27.0%         27.0%

Depreciation                 60.0     75.0      80.0            85.0          91.8         102.5
Amort of intangibles          4.0      4.0       4.0             4.0           4.0           4.0
EBIT                        161.0    168.0     186.0           208.0         230.9         252.9
EBIT margin                19.5%    18.7%     18.6%           18.9%         19.1%         19.0%

Non-oper expenses            10.0     10.0       8.0            10.0          11.0          12.0
Interest income               3.0      5.0       6.0             6.4           6.5           5.8
Interest Expense             50.0     50.0      50.0            47.7          47.7          47.7
EBT                         104.0    113.0     134.0           156.7         178.7         198.9
EBT Margin                 12.6%    12.6%     13.4%           14.2%         14.8%         14.9%

Provision for Taxes          36.0     40.0      47.0           54.9           62.5         69.6
Net Income                   68.0     73.0      87.0          101.9          116.2        129.3
Net Margin                  8.2%     8.1%      8.7%           9.3%           9.6%         9.7%

Dividends                   10.0     12.0      11.0             10.2          11.6         12.9
Net to Retained Earnings    58.0     61.0      76.0             91.7         104.5        116.4
ABU CAPITAL LTD

BALANCE SHEET                 2000      2001      2002      2003      2004      2005
ASSETS
Surplus fund                   0.0       0.0       0.0      30.8       0.0       0.0
Cash                          60.0      75.0      80.0      80.0      80.0      80.0
ST investments                30.0      32.0      33.0      34.0      35.0      36.1
Account Receivable            60.0      75.0      90.0      49.7      54.7      60.2
Inventory                    120.0     135.0     150.0     162.4     173.2     190.5
Other Current Assets          10.0      10.0      12.0     110.0     121.0     133.1
Current Assets               280.0     327.0     365.0     467.0     463.9     499.9

Net PPE                       870.0     950.0   1,000.0   1,080.0   1,206.0   1,369.7
Intangibles                    58.0      54.0      50.0      46.0      42.0      38.0
Long-term Assets               92.0     116.0     150.0     154.0     169.4     186.3
Total Assets                1,300.0   1,447.0   1,565.0   1,747.0   1,881.3   2,093.9

LIABILITIES
Short-term notes              10.0      12.0      14.0      14.0      14.0      14.0
Account payable               60.0      70.0      80.0      91.2     100.3     110.3
Other Current liabilities     10.0      20.0      20.0      22.0      24.2      26.6
Current Liabilities           80.0     102.0     114.0     127.2     138.5     150.9

Necessary to Finance           0.0       0.0       0.0       0.0      14.1      93.2
Debt 1                       200.0     225.0     150.0     150.0     150.0     150.0
Debt 2                       200.0     200.0     225.0     225.0     225.0     225.0
Debt 3                       110.0     110.0     110.0     110.0     110.0     110.0
Long-term Liabilities         40.0      38.0      37.0      44.0      48.4      53.2
Total Liabilities            630.0     675.0     636.0     656.2     686.0     782.3

SHAREHOLDERS EQUITY
Common stock                  460.0     500.0     580.0     650.0     650.0     650.0
Retained Earnings             200.0     261.0     337.0     428.7     533.2     649.6
Other Equity account           10.0      11.0      12.0      12.1      12.1      12.0
Total SH Equity               670.0     772.0     929.0   1,090.8   1,195.3   1,311.6
Total Liab & SH Equity      1,300.0   1,447.0   1,565.0   1,747.0   1,881.3   2,093.9
ABU CAPITAL LTD


CASH FLOW STATEMENT                  2000     2001      2002      2003      2004      2005

Net Income                                    73.0      87.0    101.9     116.2     129.3

Add Back:
Depreciation                                 75.0      80.0      85.0      91.8     102.5
Amort. of Intangibles                         4.0       4.0       4.0       4.0       4.0
Operating Cash Flow                         152.0     171.0     190.9     212.0     235.8

(Inc) in Acct Receivable                    (15.0)    (15.0)     40.3      (5.0)     (5.5)
(Inc) in Inventory                          (15.0)    (15.0)    (12.4)    (10.8)    (17.3)
(Inc) other Current Assets                    0.0      (2.0)    (98.0)    (11.0)    (12.1)
Inc in Account Payable                       10.0      10.0      11.2       9.1      10.0
Inc in Other Current Liabs                   10.0       0.0       2.0       2.2       2.4
(Inc) in Oper. Working Capital              (10.0)    (22.0)    (57.0)    (15.4)    (22.4)
Cash from Operations                        142.0     149.0     133.9     196.5     213.4

CapEx                                       (155.0)   (130.0)   (165.0)   (217.8)   (266.2)
Other (Inc) dec in net PPE                     0.0       0.0       0.0       0.0       0.0
Other (Inc) dec in intangibles                 0.0       0.0       0.0       0.0       0.0
(Inc) dec in long-term Assets                (24.0)    (34.0)     (4.0)    (15.4)    (16.9)
Cash from Investments                       (179.0)   (164.0)   (169.0)   (233.2)   (283.1)

Inc (dec) in ST Notes                          2.0       2.0       0.0       0.0       0.0
Inc (dec) in Nec. To finance                   0.0       0.0       0.0      14.1      79.1
Inc (dec) in Debt 1                           25.0     (75.0)      0.0       0.0       0.0
Inc (dec) in Debt 2                            0.0      25.0       0.0       0.0       0.0
Inc (dec) in Debt 3                            0.0       0.0       0.0       0.0       0.0
Dividends                                    (12.0)    (11.0)    (10.2)    (11.6)    (12.9)
Inc (dec) in Long Term Liabs.                 (2.0)     (1.0)      7.0       4.4       4.8
Inc (dec) in Common Stock                     40.0      80.0      70.0       0.0       0.0
Other inc (dec) retained earnings              0.0       0.0       0.0       0.0       0.0
Inc (dec) in other equity accounts             1.0       1.0       0.1       0.0      (0.1)
Cash from Financing                           54.0      21.0      66.9       6.9      70.9

Change in cash and Equity                    17.0       6.0      31.8     (29.8)      1.1
Cash and Equivalents                 90.0   107.0     113.0     144.8     115.0     116.1

Cash and Equiv in B/S                90.0   107.0     113.0     144.8     115.0     116.1
Parity Check                          0.0     0.0       0.0       0.0       0.0       0.0
RECONCILIATION                     2000   2001      2002      2003      2004      2005

Net PPE
Beginning Amount                          870.0     950.0   1,000.0   1,080.0   1,206.0
CapEx                                     155.0     130.0     165.0     217.8     266.2
Depreciation                               75.0      80.0      85.0      91.8     102.5
Expected ending Amount                    950.0   1,000.0   1,080.0   1,206.0   1,369.7
B/S Amount                                950.0   1,000.0   1,080.0   1,206.0   1,369.7
Other (Inc) dec Net PPE                     0.0       0.0       0.0       0.0       0.0

Intangibles
Beginning Amount                           58.0     54.0      50.0      46.0      42.0
Amortization                                4.0      4.0       4.0       4.0       4.0
Expected ending Amount                     54.0     50.0      46.0      42.0      38.0
B/S Amount                                 54.0     50.0      46.0      42.0      38.0
Other (Inc) dec intangibles                 0.0      0.0       0.0       0.0       0.0

Retained Earnings
Beginning Amount                          200.0    261.0     337.0     428.7     533.2
Net to Retained Earnings                   61.0     76.0      91.7     104.5     116.4
Expected ending Amount                    261.0    337.0     428.7     533.2     649.6
B/S Amount                                261.0    337.0     428.7     533.2     649.6
Other inc(dec) Retained earnings            0.0      0.0       0.0       0.0       0.0
ABU CAPITAL LTD

Common Size Income Statement
                                                         Projection Projection Projection
INPUTS / YEARS                  2000     2001     2002          2003       2004       2005
INCOME STATEMENT
Revenues                   100.0%      100.0%   100.0%       100.0%     100.0%     100.0%
COGS                        54.5%       54.4%    55.0%        55.0%      55.0%      55.0%
Gross Profit                45.5%       45.6%    45.0%        45.0%      45.0%      45.0%

SGA                            15.2%   15.0%    15.0%         15.0%      15.0%      15.0%
Operating expenses              3.0%    3.1%     3.0%          3.0%       3.0%       3.0%
EBITDA                         27.3%   27.4%    27.0%         27.0%      27.0%      27.0%

Depreciation                    7.3%    8.3%     8.0%          7.7%       7.6%       7.7%
Amort of intangibles            0.5%    0.4%     0.4%          0.4%       0.3%       0.3%
EBIT                           19.5%   18.7%    18.6%         18.9%      19.1%      19.0%

Non-oper expenses              1.2%     1.1%     0.8%          0.9%       0.9%       0.9%

Interest income                 0.4%    0.6%     0.6%          0.6%       0.5%       0.4%
Interest Expense                6.1%    5.6%     5.0%          4.3%       3.9%       3.6%
EBT                            12.6%   12.6%    13.4%         14.2%      14.8%      14.9%

Provision for Taxes            4.4%     4.4%     4.7%          5.0%       5.2%       5.2%
Net Income                     8.2%     8.1%     8.7%          9.3%       9.6%       9.7%

Dividends                      1.2%     1.3%     1.1%          0.9%       1.0%       1.0%
Net to Retained Earnings       7.0%     6.8%     7.6%          8.3%       8.6%       8.7%
ABU CAPITAL LTD

Common Size Statement

BALANCE SHEET                 2000     2001     2002     2003     2004     2005
ASSETS
Surplus fund                  0.0%    0.0%     0.0%     1.8%     0.0%     0.0%
Cash                          4.6%    5.2%     5.1%     4.6%     4.3%     3.8%
ST investments                2.3%    2.2%     2.1%     1.9%     1.9%     1.7%
Account Receivable            4.6%    5.2%     5.8%     2.8%     2.9%     2.9%
Inventory                     9.2%    9.3%     9.6%     9.3%     9.2%     9.1%
Other Current Assets          0.8%    0.7%     0.8%     6.3%     6.4%     6.4%
Current Assets               21.5%   22.6%    23.3%    26.7%    24.7%    23.9%

Net PPE                      66.9%    65.7%    63.9%    61.8%    64.1%    65.4%
Intangibles                   4.5%     3.7%     3.2%     2.6%     2.2%     1.8%
Long-term Assets              7.1%     8.0%     9.6%     8.8%     9.0%     8.9%
Total Assets                100.0%   100.0%   100.0%   100.0%   100.0%   100.0%

LIABILITIES
Short-term notes             0.8%     0.8%     0.9%     0.8%     0.7%     0.7%
Account payable              4.6%     4.8%     5.1%     5.2%     5.3%     5.3%
Other Current liabilities    0.8%     1.4%     1.3%     1.3%     1.3%     1.3%
Current Liabilities          6.2%     7.0%     7.3%     7.3%     7.4%     7.2%

Necessary to Finance          0.0%    0.0%     0.0%     0.0%     0.7%     4.4%
Debt 1                       15.4%   15.5%     9.6%     8.6%     8.0%     7.2%
Debt 2                       15.4%   13.8%    14.4%    12.9%    12.0%    10.7%
Debt 3                        8.5%    7.6%     7.0%     6.3%     5.8%     5.3%
Long-term Liabilities         3.1%    2.6%     2.4%     2.5%     2.6%     2.5%
Total Liabilities            48.5%   46.6%    40.6%    37.6%    36.5%    37.4%

SHAREHOLDERS EQUITY
Common stock                 35.4%    34.6%    37.1%    37.2%    34.6%    31.0%
Retained Earnings            15.4%    18.0%    21.5%    24.5%    28.3%    31.0%
Other Equity account          0.8%     0.8%     0.8%     0.7%     0.6%     0.6%
Total SH Equity              51.5%    53.4%    59.4%    62.4%    63.5%    62.6%
Total Liab & SH Equity      100.0%   100.0%   100.0%   100.0%   100.0%   100.0%

More Related Content

What's hot

dover 4Q_2005_Trend_Analysis
dover 4Q_2005_Trend_Analysisdover 4Q_2005_Trend_Analysis
dover 4Q_2005_Trend_Analysis
finance30
 
national oilwell varco Fourth Quarter 2008 Segmented Financial Data
national oilwell varco Fourth Quarter 2008 Segmented Financial Datanational oilwell varco Fourth Quarter 2008 Segmented Financial Data
national oilwell varco Fourth Quarter 2008 Segmented Financial Data
finance40
 
Resumen Ejecutivo Presupuestario UASD
Resumen Ejecutivo  Presupuestario UASDResumen Ejecutivo  Presupuestario UASD
Resumen Ejecutivo Presupuestario UASD
Alexander Perdomo
 
atmos enerrgy 120705pres
atmos enerrgy 120705presatmos enerrgy 120705pres
atmos enerrgy 120705pres
finance35
 
Ppp slideshow 8-12-12
Ppp   slideshow 8-12-12Ppp   slideshow 8-12-12
Ppp slideshow 8-12-12
lizjen
 
Westheimer mobil station
Westheimer mobil stationWestheimer mobil station
Westheimer mobil station
nateshow
 
MSU IIT MPC Ato Kini!
MSU IIT MPC
Ato Kini!MSU IIT MPC
Ato Kini!
MSU IIT MPC Ato Kini!
VisualBee.com
 
Bnm analisis financiero comparativo - bnm vs sistema bca comercial nov 2000
Bnm   analisis financiero comparativo - bnm vs sistema bca comercial nov 2000Bnm   analisis financiero comparativo - bnm vs sistema bca comercial nov 2000
Bnm analisis financiero comparativo - bnm vs sistema bca comercial nov 2000
gonzaloromani
 
Apres call 2_q10_v2
Apres call 2_q10_v2Apres call 2_q10_v2
Apres call 2_q10_v2
Arteris S.A.
 
itw confrence call-Q32005O riginal
itw confrence call-Q32005O riginalitw confrence call-Q32005O riginal
itw confrence call-Q32005O riginal
finance16
 

What's hot (20)

dover 4Q_2005_Trend_Analysis
dover 4Q_2005_Trend_Analysisdover 4Q_2005_Trend_Analysis
dover 4Q_2005_Trend_Analysis
 
IFF 2016 DCF
IFF 2016 DCFIFF 2016 DCF
IFF 2016 DCF
 
Results tracker 18th August 2011
Results tracker 18th August 2011Results tracker 18th August 2011
Results tracker 18th August 2011
 
Gta office market statistics q3 2011
Gta office market statistics q3 2011Gta office market statistics q3 2011
Gta office market statistics q3 2011
 
Venture Capitalist Competition
Venture Capitalist CompetitionVenture Capitalist Competition
Venture Capitalist Competition
 
national oilwell varco Fourth Quarter 2008 Segmented Financial Data
national oilwell varco Fourth Quarter 2008 Segmented Financial Datanational oilwell varco Fourth Quarter 2008 Segmented Financial Data
national oilwell varco Fourth Quarter 2008 Segmented Financial Data
 
4Q12 Presentation
4Q12 Presentation4Q12 Presentation
4Q12 Presentation
 
Wmt Model Template
Wmt Model TemplateWmt Model Template
Wmt Model Template
 
Pantaloon 2008 2009
Pantaloon 2008 2009Pantaloon 2008 2009
Pantaloon 2008 2009
 
Resumen Ejecutivo Presupuestario UASD
Resumen Ejecutivo  Presupuestario UASDResumen Ejecutivo  Presupuestario UASD
Resumen Ejecutivo Presupuestario UASD
 
Results Tracker 11.07.2012,
Results Tracker 11.07.2012,Results Tracker 11.07.2012,
Results Tracker 11.07.2012,
 
atmos enerrgy 120705pres
atmos enerrgy 120705presatmos enerrgy 120705pres
atmos enerrgy 120705pres
 
Ppp slideshow 8-12-12
Ppp   slideshow 8-12-12Ppp   slideshow 8-12-12
Ppp slideshow 8-12-12
 
Westheimer mobil station
Westheimer mobil stationWestheimer mobil station
Westheimer mobil station
 
MSU IIT MPC Ato Kini!
MSU IIT MPC
Ato Kini!MSU IIT MPC
Ato Kini!
MSU IIT MPC Ato Kini!
 
Bnm analisis financiero comparativo - bnm vs sistema bca comercial nov 2000
Bnm   analisis financiero comparativo - bnm vs sistema bca comercial nov 2000Bnm   analisis financiero comparativo - bnm vs sistema bca comercial nov 2000
Bnm analisis financiero comparativo - bnm vs sistema bca comercial nov 2000
 
Anu Pinkerton
Anu PinkertonAnu Pinkerton
Anu Pinkerton
 
Company Report of Infosys - Q3FY12 Result Update
Company Report of Infosys - Q3FY12 Result UpdateCompany Report of Infosys - Q3FY12 Result Update
Company Report of Infosys - Q3FY12 Result Update
 
Apres call 2_q10_v2
Apres call 2_q10_v2Apres call 2_q10_v2
Apres call 2_q10_v2
 
itw confrence call-Q32005O riginal
itw confrence call-Q32005O riginalitw confrence call-Q32005O riginal
itw confrence call-Q32005O riginal
 

Viewers also liked

SME Manufacturing Credit Risk Model Forecast Correctness and Result of Model
SME Manufacturing Credit Risk Model Forecast Correctness and Result of ModelSME Manufacturing Credit Risk Model Forecast Correctness and Result of Model
SME Manufacturing Credit Risk Model Forecast Correctness and Result of Model
IOSR Journals
 

Viewers also liked (13)

Bamboo toothpicks
Bamboo toothpicksBamboo toothpicks
Bamboo toothpicks
 
SME Manufacturing Credit Risk Model Forecast Correctness and Result of Model
SME Manufacturing Credit Risk Model Forecast Correctness and Result of ModelSME Manufacturing Credit Risk Model Forecast Correctness and Result of Model
SME Manufacturing Credit Risk Model Forecast Correctness and Result of Model
 
20131127 Supply Chain Finance Forum
20131127 Supply Chain Finance Forum20131127 Supply Chain Finance Forum
20131127 Supply Chain Finance Forum
 
Berkshire Hathaway New Strategy (McKinsey Case Championship)
Berkshire Hathaway New Strategy (McKinsey Case Championship)Berkshire Hathaway New Strategy (McKinsey Case Championship)
Berkshire Hathaway New Strategy (McKinsey Case Championship)
 
Workshop Supply Chain Finance (SCF)
 Workshop Supply Chain Finance (SCF) Workshop Supply Chain Finance (SCF)
Workshop Supply Chain Finance (SCF)
 
New Practices and Opportunities in Supply Chain Finance
New Practices and Opportunities in Supply Chain FinanceNew Practices and Opportunities in Supply Chain Finance
New Practices and Opportunities in Supply Chain Finance
 
Supply Chain Finance: Win-Win Working Capital Benefits for Buyers and Suppliers
Supply Chain Finance: Win-Win Working Capital Benefits for Buyers and SuppliersSupply Chain Finance: Win-Win Working Capital Benefits for Buyers and Suppliers
Supply Chain Finance: Win-Win Working Capital Benefits for Buyers and Suppliers
 
Business Model Innovation in the manufacturing sector
Business Model Innovation in the manufacturing sectorBusiness Model Innovation in the manufacturing sector
Business Model Innovation in the manufacturing sector
 
Application of supply chain management in banking industry
Application of supply chain management in banking industryApplication of supply chain management in banking industry
Application of supply chain management in banking industry
 
PORTER’s five forces model for MARUTI SUZUKI
PORTER’s five forces model for MARUTI SUZUKIPORTER’s five forces model for MARUTI SUZUKI
PORTER’s five forces model for MARUTI SUZUKI
 
Toyota SCM
Toyota SCMToyota SCM
Toyota SCM
 
Introduction to Supply Chain Finance
Introduction to Supply Chain FinanceIntroduction to Supply Chain Finance
Introduction to Supply Chain Finance
 
Business Model for Startups
Business Model for StartupsBusiness Model for Startups
Business Model for Startups
 

Similar to Financial Model Manufacturing And Retail Businesses

Mtm ix business analysis project work_easyjet
Mtm ix business analysis project work_easyjetMtm ix business analysis project work_easyjet
Mtm ix business analysis project work_easyjet
MTM IULM
 
MTM IX - Accounting Management Project Work
MTM IX - Accounting Management Project Work MTM IX - Accounting Management Project Work
MTM IX - Accounting Management Project Work
MTM IULM
 
omnicom group Q3 2006 Investor Presentation
omnicom group  Q3 2006 Investor Presentationomnicom group  Q3 2006 Investor Presentation
omnicom group Q3 2006 Investor Presentation
finance22
 

Similar to Financial Model Manufacturing And Retail Businesses (20)

Sinteza bgc dec2009
Sinteza bgc dec2009Sinteza bgc dec2009
Sinteza bgc dec2009
 
Ppt ideko spx_team
Ppt ideko spx_teamPpt ideko spx_team
Ppt ideko spx_team
 
Hansson
HanssonHansson
Hansson
 
KENYA AIRWAYS STATEMENT ANALYSIS- CIFA LUDENYO
KENYA AIRWAYS STATEMENT ANALYSIS- CIFA LUDENYOKENYA AIRWAYS STATEMENT ANALYSIS- CIFA LUDENYO
KENYA AIRWAYS STATEMENT ANALYSIS- CIFA LUDENYO
 
Infosys
InfosysInfosys
Infosys
 
Mtm ix business analysis project work_easyjet
Mtm ix business analysis project work_easyjetMtm ix business analysis project work_easyjet
Mtm ix business analysis project work_easyjet
 
MTM IX - Accounting Management Project Work
MTM IX - Accounting Management Project Work MTM IX - Accounting Management Project Work
MTM IX - Accounting Management Project Work
 
Excel Model of Trading Firm
Excel Model of Trading FirmExcel Model of Trading Firm
Excel Model of Trading Firm
 
Zappos Financials
Zappos FinancialsZappos Financials
Zappos Financials
 
2 q11
2 q112 q11
2 q11
 
Sample LBO Model Template
Sample LBO Model TemplateSample LBO Model Template
Sample LBO Model Template
 
Venture Capitalist competition Analysis Team Lollapalooza
Venture Capitalist competition Analysis Team LollapaloozaVenture Capitalist competition Analysis Team Lollapalooza
Venture Capitalist competition Analysis Team Lollapalooza
 
omnicom group Q3 2006 Investor Presentation
omnicom group  Q3 2006 Investor Presentationomnicom group  Q3 2006 Investor Presentation
omnicom group Q3 2006 Investor Presentation
 
itw_041019
itw_041019itw_041019
itw_041019
 
Q2 2011 financial_highlights
Q2 2011 financial_highlightsQ2 2011 financial_highlights
Q2 2011 financial_highlights
 
ITW_Q405
ITW_Q405ITW_Q405
ITW_Q405
 
Tom Russo VIF 2009.
Tom Russo VIF 2009.Tom Russo VIF 2009.
Tom Russo VIF 2009.
 
Senario Analysis for Risk management in Corporate Finance
Senario Analysis for Risk management in Corporate FinanceSenario Analysis for Risk management in Corporate Finance
Senario Analysis for Risk management in Corporate Finance
 
ITW_041905
ITW_041905ITW_041905
ITW_041905
 
Analysis of Revenue guidance - Infosys
Analysis of Revenue guidance - InfosysAnalysis of Revenue guidance - Infosys
Analysis of Revenue guidance - Infosys
 

Recently uploaded

Call Girls in Tilak Nagar (delhi) call me [🔝9953056974🔝] escort service 24X7
Call Girls in Tilak Nagar (delhi) call me [🔝9953056974🔝] escort service 24X7Call Girls in Tilak Nagar (delhi) call me [🔝9953056974🔝] escort service 24X7
Call Girls in Tilak Nagar (delhi) call me [🔝9953056974🔝] escort service 24X7
9953056974 Low Rate Call Girls In Saket, Delhi NCR
 

Recently uploaded (20)

Female Escorts Service in Hyderabad Starting with 5000/- for Savita Escorts S...
Female Escorts Service in Hyderabad Starting with 5000/- for Savita Escorts S...Female Escorts Service in Hyderabad Starting with 5000/- for Savita Escorts S...
Female Escorts Service in Hyderabad Starting with 5000/- for Savita Escorts S...
 
20240419-SMC-submission-Annual-Superannuation-Performance-Test-–-design-optio...
20240419-SMC-submission-Annual-Superannuation-Performance-Test-–-design-optio...20240419-SMC-submission-Annual-Superannuation-Performance-Test-–-design-optio...
20240419-SMC-submission-Annual-Superannuation-Performance-Test-–-design-optio...
 
cost-volume-profit analysis.ppt(managerial accounting).pptx
cost-volume-profit analysis.ppt(managerial accounting).pptxcost-volume-profit analysis.ppt(managerial accounting).pptx
cost-volume-profit analysis.ppt(managerial accounting).pptx
 
Kopar Khairane Cheapest Call Girls✔✔✔9833754194 Nerul Premium Call Girls-Navi...
Kopar Khairane Cheapest Call Girls✔✔✔9833754194 Nerul Premium Call Girls-Navi...Kopar Khairane Cheapest Call Girls✔✔✔9833754194 Nerul Premium Call Girls-Navi...
Kopar Khairane Cheapest Call Girls✔✔✔9833754194 Nerul Premium Call Girls-Navi...
 
Call Girls in Tilak Nagar (delhi) call me [🔝9953056974🔝] escort service 24X7
Call Girls in Tilak Nagar (delhi) call me [🔝9953056974🔝] escort service 24X7Call Girls in Tilak Nagar (delhi) call me [🔝9953056974🔝] escort service 24X7
Call Girls in Tilak Nagar (delhi) call me [🔝9953056974🔝] escort service 24X7
 
GIFT City Overview India's Gateway to Global Finance
GIFT City Overview  India's Gateway to Global FinanceGIFT City Overview  India's Gateway to Global Finance
GIFT City Overview India's Gateway to Global Finance
 
Solution Manual For Financial Statement Analysis, 13th Edition By Charles H. ...
Solution Manual For Financial Statement Analysis, 13th Edition By Charles H. ...Solution Manual For Financial Statement Analysis, 13th Edition By Charles H. ...
Solution Manual For Financial Statement Analysis, 13th Edition By Charles H. ...
 
Benefits & Risk Of Stock Loans
Benefits & Risk Of Stock LoansBenefits & Risk Of Stock Loans
Benefits & Risk Of Stock Loans
 
Significant AI Trends for the Financial Industry in 2024 and How to Utilize Them
Significant AI Trends for the Financial Industry in 2024 and How to Utilize ThemSignificant AI Trends for the Financial Industry in 2024 and How to Utilize Them
Significant AI Trends for the Financial Industry in 2024 and How to Utilize Them
 
Kurla Capable Call Girls ,07506202331, Sion Affordable Call Girls
Kurla Capable Call Girls ,07506202331, Sion Affordable Call GirlsKurla Capable Call Girls ,07506202331, Sion Affordable Call Girls
Kurla Capable Call Girls ,07506202331, Sion Affordable Call Girls
 
Business Principles, Tools, and Techniques in Participating in Various Types...
Business Principles, Tools, and Techniques  in Participating in Various Types...Business Principles, Tools, and Techniques  in Participating in Various Types...
Business Principles, Tools, and Techniques in Participating in Various Types...
 
W.D. Gann Theory Complete Information.pdf
W.D. Gann Theory Complete Information.pdfW.D. Gann Theory Complete Information.pdf
W.D. Gann Theory Complete Information.pdf
 
Virar Best Sex Call Girls Number-📞📞9833754194-Poorbi Nalasopara Housewife Cal...
Virar Best Sex Call Girls Number-📞📞9833754194-Poorbi Nalasopara Housewife Cal...Virar Best Sex Call Girls Number-📞📞9833754194-Poorbi Nalasopara Housewife Cal...
Virar Best Sex Call Girls Number-📞📞9833754194-Poorbi Nalasopara Housewife Cal...
 
Escorts Indore Call Girls-9155612368-Vijay Nagar Decent Fantastic Call Girls ...
Escorts Indore Call Girls-9155612368-Vijay Nagar Decent Fantastic Call Girls ...Escorts Indore Call Girls-9155612368-Vijay Nagar Decent Fantastic Call Girls ...
Escorts Indore Call Girls-9155612368-Vijay Nagar Decent Fantastic Call Girls ...
 
Collecting banker, Capacity of collecting Banker, conditions under section 13...
Collecting banker, Capacity of collecting Banker, conditions under section 13...Collecting banker, Capacity of collecting Banker, conditions under section 13...
Collecting banker, Capacity of collecting Banker, conditions under section 13...
 
Famous Kala Jadu, Black magic expert in Faisalabad and Kala ilam specialist i...
Famous Kala Jadu, Black magic expert in Faisalabad and Kala ilam specialist i...Famous Kala Jadu, Black magic expert in Faisalabad and Kala ilam specialist i...
Famous Kala Jadu, Black magic expert in Faisalabad and Kala ilam specialist i...
 
Lion One Corporate Presentation May 2024
Lion One Corporate Presentation May 2024Lion One Corporate Presentation May 2024
Lion One Corporate Presentation May 2024
 
2999,Vashi Fantastic Ellete Call Girls📞📞9833754194 CBD Belapur Genuine Call G...
2999,Vashi Fantastic Ellete Call Girls📞📞9833754194 CBD Belapur Genuine Call G...2999,Vashi Fantastic Ellete Call Girls📞📞9833754194 CBD Belapur Genuine Call G...
2999,Vashi Fantastic Ellete Call Girls📞📞9833754194 CBD Belapur Genuine Call G...
 
Pension dashboards forum 1 May 2024 (1).pdf
Pension dashboards forum 1 May 2024 (1).pdfPension dashboards forum 1 May 2024 (1).pdf
Pension dashboards forum 1 May 2024 (1).pdf
 
Call Girls in Benson Town / 8250092165 Genuine Call girls with real Photos an...
Call Girls in Benson Town / 8250092165 Genuine Call girls with real Photos an...Call Girls in Benson Town / 8250092165 Genuine Call girls with real Photos an...
Call Girls in Benson Town / 8250092165 Genuine Call girls with real Photos an...
 

Financial Model Manufacturing And Retail Businesses

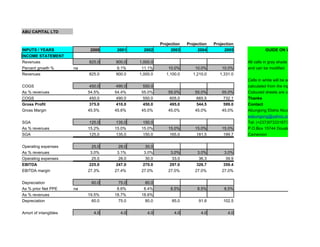
  • 1. ABU CAPITAL LTD Projection Projection Projection INPUTS / YEARS 2000 2001 2002 2003 2004 2005 GUIDE ON USAGE INCOME STATEMENT Revenues 825.0 900.0 1,000.0 All cells in gray shade are input cells Percent growth % na 9.1% 11.1% 10.0% 10.0% 10.0% and can be modified Revenues 825.0 900.0 1,000.0 1,100.0 1,210.0 1,331.0 Cells in white will be automatically COGS 450.0 490.0 550.0 calculated from the input data you enter As % revenues 54.5% 54.4% 55.0% 55.0% 55.0% 55.0% Coloured sheets are calculated automati COGS 450.0 490.0 550.0 605.0 665.5 732.1 Thanks Gross Profit 375.0 410.0 450.0 495.0 544.5 599.0 Contact Gross Margin 45.5% 45.6% 45.0% 45.0% 45.0% 45.0% Abungong Elisha Abungong(Financial M eabungong@yahoo.com SGA 125.0 135.0 150.0 Tel: (+237)97333187/77238818 As % revenues 15.2% 15.0% 15.0% 15.0% 15.0% 15.0% P.O.Box 15744 Douala, SGA 125.0 135.0 150.0 165.0 181.5 199.7 Cameroon Operating expenses 25.0 28.0 30.0 As % revenues 3.0% 3.1% 3.0% 3.0% 3.0% 3.0% Operating expenses 25.0 28.0 30.0 33.0 36.3 39.9 EBITDA 225.0 247.0 270.0 297.0 326.7 359.4 EBITDA margin 27.3% 27.4% 27.0% 27.0% 27.0% 27.0% Depreciation 60.0 75.0 80.0 As % prior Net PPE na 8.6% 8.4% 8.5% 8.5% 8.5% As % revenues 19.5% 18.7% 18.6% Depreciation 60.0 75.0 80.0 85.0 91.8 102.5 Amort of intangibles 4.0 4.0 4.0 4.0 4.0 4.0
  • 2. Amort of intangibles 4.0 4.0 4.0 4.0 4.0 4.0 EBIT 161.0 168.0 186.0 208.0 230.9 252.9 EBIT margin 19.5% 18.7% 18.6% 18.9% 19.1% 19.0% Non-oper expenses 10.0 10.0 8.0 10.0 11.0 12.0 As % revenues 1.2% 1.1% 0.8% Non-oper expenses 10.0 10.0 8.0 10.0 11.0 12.0 Interest income 3.0 5.0 6.0 Surplus fund 0.8 0.8 0.0 Cash 4.0 4.0 4.0 ST investments 1.7 1.7 1.8 Interest income 3.0 5.0 6.0 6.4 6.5 5.8 Interest Expense 50.0 50.0 50.0 Necessary to Finance 0.0 0.7 5.4 ST Notes 1.4 1.4 1.4 Debt 1 15.0 15.0 15.0 Debt 2 22.5 22.5 22.5 Debt 3 8.8 8.8 8.8 Interest Expense 50.0 50.0 50.0 47.7 47.7 47.7 EBT 104.0 113.0 134.0 156.7 178.7 198.9 EBT Margin 12.6% 12.6% 13.4% 14.2% 14.8% 14.9% Provision for Taxes 36.0 40.0 47.0 Tax Rate % 34.6% 35.4% 35.1% 35.0% 35.0% 35.0% Provision for Taxes 36.0 40.0 47.0 54.9 62.5 69.6 Net Income 68.0 73.0 87.0 101.9 116.2 129.3 Net Margin 8.2% 8.1% 8.7% 9.3% 9.6% 9.7% Dividends 10.0 12.0 11.0
  • 3. Payout Ratio% 14.7% 16.4% 12.6% 10.0% 10.0% 10.0% Dividends 10.0 12.0 11.0 10.2 11.6 12.9 Net to Retained Earnings 58.0 61.0 76.0 91.7 104.5 116.4 BALANCE SHEET CURRENT ASSET INPUT BALANCE SHEET 2000 2001 2002 2003 2004 2005 ASSETS Surplus fund 0.0 0.0 0.0 30.8 0.0 0.0 Interest rate % 5.000% 5.000% 5.000% Interest Income 0.8 0.8 0.0 Cash 60.0 75.0 80.0 80.0 80.0 80.0 % of Revenue 7.3% 8.3% 8.0% Cash 60.0 75.0 80.0 80.0 80.0 80.0 Interest rate 5.000% 5.000% 5.000% Interest income 4 4 4 ST investments 30.0 32.0 33.0 34.0 35.0 36.1 % growth 3.6% 3.6% 3.3% ST investments 30.0 32.0 33.0 34.0 35.0 36.1 Interest rate 5.000% 5.000% 5.000% Interest Income 1.7 1.7 1.8 Account Receivable 60.0 75.0 90.0 % of revenues 7.3% 8.3% 9.0% Days of revenues 26.5 30.4 32.9 30.0 30.0 30.0 Account Receivable 60.0 75.0 90.0 49.7 54.7 60.2 Inventory 120.0 135.0 150.0
  • 4. % of revenues 14.5% 15.0% 15.0% Days of COGS 53.1 54.8 54.8 98.0 95.0 95.0 Inventory 120.0 135.0 150.0 162.4 173.2 190.5 Other Current Assets 10.0 10.0 12.0 % of revenues 1.2% 1.1% 1.2% 10% 10% 10% Other Current Assets 10.0 10.0 12.0 110.0 121.0 133.1 Current Assets 280.0 327.0 365.0 467.0 463.9 499.9 Net PPE 870.0 950.0 1,000.0 CapEx 130.0 155.0 130.0 % of revenues 15.8% 17.2% 13.0% 15.0% 18.0% 20.0% CapEx 130.0 155.0 130.0 165.0 217.8 266.2 Depreciation 60.0 75.0 80.0 85.0 91.8 102.5 Net PPE 870.0 950.0 1,000.0 1,080.0 1,206.0 1,369.7 Intangibles 58.0 54.0 50.0 Amortization 4.0 4.0 4.0 Intangibles 58.0 54.0 50.0 46.0 42.0 38.0 Long-term Assets 92.0 116.0 150.0 % of revenues 11.2% 12.9% 15.0% 14.0% 14.0% 14.0% % growth na 26.1% 29.3% Long-term Assets 92.0 116.0 150.0 154.0 169.4 186.3 Total Assets 1,300.0 1,447.0 1,565.0 1,747.0 1,881.3 2,093.9 LIABILITIES Short-term notes 10.0 12.0 14.0 14.0 14.0 14.0 Short-term notes 10.0 12.0 14.0 14.0 14.0 14.0 Interest rate 10.0% 10.0% 10.0% interest expense 1.4 1.4 1.4
  • 5. Account payable 60.0 70.0 80.0 % of revenues 7.3% 7.8% 8.0% days of COGS 48.7 52.1 53.1 55.0 55.0 55.0 Account payable 60.0 70.0 80.0 91.2 100.3 110.3 Other Current liabilities 10.0 20.0 20.0 % of revenues 1.2% 2.2% 2.0% 2.0% 2.0% 2.0% Other Current liabilities 10.0 20.0 20.0 22.0 24.2 26.6 Current Liabilities 80.0 102.0 114.0 127.2 138.5 150.9 Necessary to Finance 0.0 14.1 93.2 Interest rate 10.0% 10.0% 10.0% Interest Expense 0.0 0.7 5.4 Debt 1 200.0 225.0 150.0 Debt 1 200.0 225.0 150.0 150.0 150.0 150.0 Interest Rate 10.0% 10.0% 10.0% Interest expense 15.0 15.0 15.0 Debt 2 200.0 200.0 225.0 Debt 2 200.0 200.0 225.0 225.0 225.0 225.0 Interest rate 10.0% 10.0% 10.0% Interest expense 22.5 22.5 22.5 Debt 3 110.0 110.0 110.0 Debt 3 110.0 110.0 110.0 110.0 110.0 110.0 Interest Rate 8.0% 8.0% 8.0% Interest expense 8.8 8.8 8.8 Long-term Liabilities 40 38 37
  • 6. % of Revenues 4.8% 4.2% 3.7% 4.0% 4.0% 4.0% % growth N/A -5.0% -2.6% Long-term Liabilities 40.0 38.0 37.0 44.0 48.4 53.2 Total Liabilities 630.0 675.0 636.0 656.2 686.0 782.3 SHAREHOLDERS EQUITY Common stock 460.0 500.0 580.0 650.0 650.0 650.0 Common stock 460.0 500.0 580.0 650.0 650.0 650.0 Retained Earnings 200.0 261.0 337.0 Net to Retained earnings 91.7 104.5 116.4 Retained Earnings 200.0 261.0 337.0 428.7 533.2 649.6 Other Equity account 10.0 11.0 12.0 % of revenues 1.2% 1.2% 1.2% 1.1% 1.0% 0.9% Other Equity account 10.0 11.0 12.0 12.1 12.1 12.0 Total SH Equity 670.0 772.0 929.0 1,090.8 1,195.3 1,311.6 Total Liab & SH Equity 1,300.0 1,447.0 1,565.0 1,747.0 1,881.3 2,093.9 N.B Do not Change the Formulas in this Section. If you Alter your Balance sheet will not Balance Assets Without SF 1300 1447 1565 1,716.2 1,881.3 2,093.9 Liab, Equity without NTF 1300 1447 1565 1,747.0 1,867.2 2,000.8 Surplus Funds 0.0 0.0 0.0 30.8 0.0 0.0 Necessary to Finance 0.0 0.0 0.0 0.0 14.1 93.2
  • 7. GUIDE ON USAGE gray shade are input cells hite will be automatically from the input data you enter sheets are calculated automatically g Elisha Abungong(Financial Modeler) g@yahoo.com )97333187/77238818 15744 Douala,
  • 8.
  • 9.
  • 10.
  • 11.
  • 12.
  • 13. ABU CAPITAL LTD Projection Projection Projection INPUTS / YEARS 2000 2001 2002 2003 2004 2005 INCOME STATEMENT Revenues 825.0 900.0 1,000.0 1,100.0 1,210.0 1,331.0 COGS 450.0 490.0 550.0 605.0 665.5 732.1 Gross Profit 375.0 410.0 450.0 495.0 544.5 599.0 Gross Margin 45.5% 45.6% 45.0% 45.0% 45.0% 45.0% SGA 125.0 135.0 150.0 165.0 181.5 199.7 Operating expenses 25.0 28.0 30.0 33.0 36.3 39.9 EBITDA 225.0 247.0 270.0 297.0 326.7 359.4 EBITDA margin 27.3% 27.4% 27.0% 27.0% 27.0% 27.0% Depreciation 60.0 75.0 80.0 85.0 91.8 102.5 Amort of intangibles 4.0 4.0 4.0 4.0 4.0 4.0 EBIT 161.0 168.0 186.0 208.0 230.9 252.9 EBIT margin 19.5% 18.7% 18.6% 18.9% 19.1% 19.0% Non-oper expenses 10.0 10.0 8.0 10.0 11.0 12.0 Interest income 3.0 5.0 6.0 6.4 6.5 5.8 Interest Expense 50.0 50.0 50.0 47.7 47.7 47.7 EBT 104.0 113.0 134.0 156.7 178.7 198.9 EBT Margin 12.6% 12.6% 13.4% 14.2% 14.8% 14.9% Provision for Taxes 36.0 40.0 47.0 54.9 62.5 69.6 Net Income 68.0 73.0 87.0 101.9 116.2 129.3 Net Margin 8.2% 8.1% 8.7% 9.3% 9.6% 9.7% Dividends 10.0 12.0 11.0 10.2 11.6 12.9 Net to Retained Earnings 58.0 61.0 76.0 91.7 104.5 116.4
  • 14. ABU CAPITAL LTD BALANCE SHEET 2000 2001 2002 2003 2004 2005 ASSETS Surplus fund 0.0 0.0 0.0 30.8 0.0 0.0 Cash 60.0 75.0 80.0 80.0 80.0 80.0 ST investments 30.0 32.0 33.0 34.0 35.0 36.1 Account Receivable 60.0 75.0 90.0 49.7 54.7 60.2 Inventory 120.0 135.0 150.0 162.4 173.2 190.5 Other Current Assets 10.0 10.0 12.0 110.0 121.0 133.1 Current Assets 280.0 327.0 365.0 467.0 463.9 499.9 Net PPE 870.0 950.0 1,000.0 1,080.0 1,206.0 1,369.7 Intangibles 58.0 54.0 50.0 46.0 42.0 38.0 Long-term Assets 92.0 116.0 150.0 154.0 169.4 186.3 Total Assets 1,300.0 1,447.0 1,565.0 1,747.0 1,881.3 2,093.9 LIABILITIES Short-term notes 10.0 12.0 14.0 14.0 14.0 14.0 Account payable 60.0 70.0 80.0 91.2 100.3 110.3 Other Current liabilities 10.0 20.0 20.0 22.0 24.2 26.6 Current Liabilities 80.0 102.0 114.0 127.2 138.5 150.9 Necessary to Finance 0.0 0.0 0.0 0.0 14.1 93.2 Debt 1 200.0 225.0 150.0 150.0 150.0 150.0 Debt 2 200.0 200.0 225.0 225.0 225.0 225.0 Debt 3 110.0 110.0 110.0 110.0 110.0 110.0 Long-term Liabilities 40.0 38.0 37.0 44.0 48.4 53.2 Total Liabilities 630.0 675.0 636.0 656.2 686.0 782.3 SHAREHOLDERS EQUITY Common stock 460.0 500.0 580.0 650.0 650.0 650.0 Retained Earnings 200.0 261.0 337.0 428.7 533.2 649.6 Other Equity account 10.0 11.0 12.0 12.1 12.1 12.0 Total SH Equity 670.0 772.0 929.0 1,090.8 1,195.3 1,311.6 Total Liab & SH Equity 1,300.0 1,447.0 1,565.0 1,747.0 1,881.3 2,093.9
  • 15. ABU CAPITAL LTD CASH FLOW STATEMENT 2000 2001 2002 2003 2004 2005 Net Income 73.0 87.0 101.9 116.2 129.3 Add Back: Depreciation 75.0 80.0 85.0 91.8 102.5 Amort. of Intangibles 4.0 4.0 4.0 4.0 4.0 Operating Cash Flow 152.0 171.0 190.9 212.0 235.8 (Inc) in Acct Receivable (15.0) (15.0) 40.3 (5.0) (5.5) (Inc) in Inventory (15.0) (15.0) (12.4) (10.8) (17.3) (Inc) other Current Assets 0.0 (2.0) (98.0) (11.0) (12.1) Inc in Account Payable 10.0 10.0 11.2 9.1 10.0 Inc in Other Current Liabs 10.0 0.0 2.0 2.2 2.4 (Inc) in Oper. Working Capital (10.0) (22.0) (57.0) (15.4) (22.4) Cash from Operations 142.0 149.0 133.9 196.5 213.4 CapEx (155.0) (130.0) (165.0) (217.8) (266.2) Other (Inc) dec in net PPE 0.0 0.0 0.0 0.0 0.0 Other (Inc) dec in intangibles 0.0 0.0 0.0 0.0 0.0 (Inc) dec in long-term Assets (24.0) (34.0) (4.0) (15.4) (16.9) Cash from Investments (179.0) (164.0) (169.0) (233.2) (283.1) Inc (dec) in ST Notes 2.0 2.0 0.0 0.0 0.0 Inc (dec) in Nec. To finance 0.0 0.0 0.0 14.1 79.1 Inc (dec) in Debt 1 25.0 (75.0) 0.0 0.0 0.0 Inc (dec) in Debt 2 0.0 25.0 0.0 0.0 0.0 Inc (dec) in Debt 3 0.0 0.0 0.0 0.0 0.0 Dividends (12.0) (11.0) (10.2) (11.6) (12.9) Inc (dec) in Long Term Liabs. (2.0) (1.0) 7.0 4.4 4.8 Inc (dec) in Common Stock 40.0 80.0 70.0 0.0 0.0 Other inc (dec) retained earnings 0.0 0.0 0.0 0.0 0.0 Inc (dec) in other equity accounts 1.0 1.0 0.1 0.0 (0.1) Cash from Financing 54.0 21.0 66.9 6.9 70.9 Change in cash and Equity 17.0 6.0 31.8 (29.8) 1.1 Cash and Equivalents 90.0 107.0 113.0 144.8 115.0 116.1 Cash and Equiv in B/S 90.0 107.0 113.0 144.8 115.0 116.1 Parity Check 0.0 0.0 0.0 0.0 0.0 0.0
  • 16. RECONCILIATION 2000 2001 2002 2003 2004 2005 Net PPE Beginning Amount 870.0 950.0 1,000.0 1,080.0 1,206.0 CapEx 155.0 130.0 165.0 217.8 266.2 Depreciation 75.0 80.0 85.0 91.8 102.5 Expected ending Amount 950.0 1,000.0 1,080.0 1,206.0 1,369.7 B/S Amount 950.0 1,000.0 1,080.0 1,206.0 1,369.7 Other (Inc) dec Net PPE 0.0 0.0 0.0 0.0 0.0 Intangibles Beginning Amount 58.0 54.0 50.0 46.0 42.0 Amortization 4.0 4.0 4.0 4.0 4.0 Expected ending Amount 54.0 50.0 46.0 42.0 38.0 B/S Amount 54.0 50.0 46.0 42.0 38.0 Other (Inc) dec intangibles 0.0 0.0 0.0 0.0 0.0 Retained Earnings Beginning Amount 200.0 261.0 337.0 428.7 533.2 Net to Retained Earnings 61.0 76.0 91.7 104.5 116.4 Expected ending Amount 261.0 337.0 428.7 533.2 649.6 B/S Amount 261.0 337.0 428.7 533.2 649.6 Other inc(dec) Retained earnings 0.0 0.0 0.0 0.0 0.0
  • 17. ABU CAPITAL LTD Common Size Income Statement Projection Projection Projection INPUTS / YEARS 2000 2001 2002 2003 2004 2005 INCOME STATEMENT Revenues 100.0% 100.0% 100.0% 100.0% 100.0% 100.0% COGS 54.5% 54.4% 55.0% 55.0% 55.0% 55.0% Gross Profit 45.5% 45.6% 45.0% 45.0% 45.0% 45.0% SGA 15.2% 15.0% 15.0% 15.0% 15.0% 15.0% Operating expenses 3.0% 3.1% 3.0% 3.0% 3.0% 3.0% EBITDA 27.3% 27.4% 27.0% 27.0% 27.0% 27.0% Depreciation 7.3% 8.3% 8.0% 7.7% 7.6% 7.7% Amort of intangibles 0.5% 0.4% 0.4% 0.4% 0.3% 0.3% EBIT 19.5% 18.7% 18.6% 18.9% 19.1% 19.0% Non-oper expenses 1.2% 1.1% 0.8% 0.9% 0.9% 0.9% Interest income 0.4% 0.6% 0.6% 0.6% 0.5% 0.4% Interest Expense 6.1% 5.6% 5.0% 4.3% 3.9% 3.6% EBT 12.6% 12.6% 13.4% 14.2% 14.8% 14.9% Provision for Taxes 4.4% 4.4% 4.7% 5.0% 5.2% 5.2% Net Income 8.2% 8.1% 8.7% 9.3% 9.6% 9.7% Dividends 1.2% 1.3% 1.1% 0.9% 1.0% 1.0% Net to Retained Earnings 7.0% 6.8% 7.6% 8.3% 8.6% 8.7%
  • 18. ABU CAPITAL LTD Common Size Statement BALANCE SHEET 2000 2001 2002 2003 2004 2005 ASSETS Surplus fund 0.0% 0.0% 0.0% 1.8% 0.0% 0.0% Cash 4.6% 5.2% 5.1% 4.6% 4.3% 3.8% ST investments 2.3% 2.2% 2.1% 1.9% 1.9% 1.7% Account Receivable 4.6% 5.2% 5.8% 2.8% 2.9% 2.9% Inventory 9.2% 9.3% 9.6% 9.3% 9.2% 9.1% Other Current Assets 0.8% 0.7% 0.8% 6.3% 6.4% 6.4% Current Assets 21.5% 22.6% 23.3% 26.7% 24.7% 23.9% Net PPE 66.9% 65.7% 63.9% 61.8% 64.1% 65.4% Intangibles 4.5% 3.7% 3.2% 2.6% 2.2% 1.8% Long-term Assets 7.1% 8.0% 9.6% 8.8% 9.0% 8.9% Total Assets 100.0% 100.0% 100.0% 100.0% 100.0% 100.0% LIABILITIES Short-term notes 0.8% 0.8% 0.9% 0.8% 0.7% 0.7% Account payable 4.6% 4.8% 5.1% 5.2% 5.3% 5.3% Other Current liabilities 0.8% 1.4% 1.3% 1.3% 1.3% 1.3% Current Liabilities 6.2% 7.0% 7.3% 7.3% 7.4% 7.2% Necessary to Finance 0.0% 0.0% 0.0% 0.0% 0.7% 4.4% Debt 1 15.4% 15.5% 9.6% 8.6% 8.0% 7.2% Debt 2 15.4% 13.8% 14.4% 12.9% 12.0% 10.7% Debt 3 8.5% 7.6% 7.0% 6.3% 5.8% 5.3% Long-term Liabilities 3.1% 2.6% 2.4% 2.5% 2.6% 2.5% Total Liabilities 48.5% 46.6% 40.6% 37.6% 36.5% 37.4% SHAREHOLDERS EQUITY Common stock 35.4% 34.6% 37.1% 37.2% 34.6% 31.0% Retained Earnings 15.4% 18.0% 21.5% 24.5% 28.3% 31.0% Other Equity account 0.8% 0.8% 0.8% 0.7% 0.6% 0.6% Total SH Equity 51.5% 53.4% 59.4% 62.4% 63.5% 62.6% Total Liab & SH Equity 100.0% 100.0% 100.0% 100.0% 100.0% 100.0%