Contenu connexe
Similaire à 2Q2011 Miami Marketview Report
Similaire à 2Q2011 Miami Marketview Report (20)
2Q2011 Miami Marketview Report
- 1. CB RICHARD ELLIS
Miami Office
www.cbre.com/research
www cbre com/research Second Quarter 2011
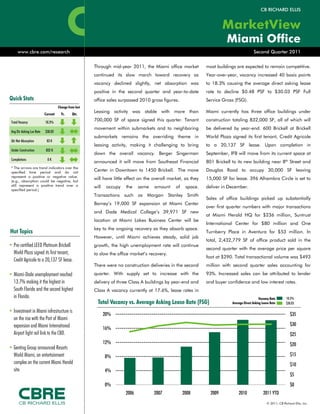
Through mid-year 2011, the Miami office market most buildings are expected to remain competitive.
continued its slow march toward recovery as Year-over-year, vacancy increased 40 basis points
vacancy declined slightly, net absorption was to 18.3% causing the average direct asking lease
positive in the second quarter and year-to-date rate to decline $0.48 PSF to $30.03 PSF Full
Quick Stats office sales surpassed 2010 gross figures. Service Gross (FSG).
Change from last
Leasing activity was stable with more than Miami currently has three office buildings under
Current Yr. Qtr.
Total Vacancy 18.3%
700,000 SF of space signed this quarter. Tenant construction totaling 832,000 SF, all of which will
movement within submarkets and to neighboring be delivered by year-end. 600 Brickell at Brickell
Avg Dir Asking Lse Rate $30.03
submarkets remains the overriding theme in World Plaza signed its first tenant, Credit Agricole
Qtr Net Absorption 83 K
leasing activity, making it challenging to bring to a 20,137 SF lease. Upon completion in
Under Construction 832 K
down the overall vacancy. Berger Singerman
y g g September, IFB will move from its current space at
p , p
Completions 0K
announced it will move from Southeast Financial 801 Brickell to its new building near 8th Street and
* The arrows are trend indicators over the
specified time period and do not
Center in Downtown to 1450 Brickell. The move Douglas Road to occupy 30,000 SF leaving
represent a positive or negative value.
will have little effect on the overall market, as they 15,000 SF for lease. 396 Alhambra Circle is set to
(e.g., absorption could be negative, but
still represent a positive trend over a will occupy the same amount of space. deliver in December.
specified period.)
Transactions such as Morgan Stanley Smith
Sales of office buildings picked up substantially
Barney’s 19,000 SF expansion at Miami Center
over first quarter numbers with major transactions
and Dade Medical College’s 39,971 SF new
at Miami Herald HQ for $236 million, Suntrust
location at Miami Lakes Business Center will be
International Center for $80 million and One
key to the ongoing recovery as they absorb space.
Hot Topics Turnberry Place in Aventura for $53 million. In
However, until Miami achieves steady, solid job
total, 2,432,779 SF of office product sold in the
• Pre-certified LEED Platinum Brickell growth, the high unemployment rate will continue
second quarter with the average price per square
World Plaza signed its first tenant, to slow the office market’s recovery.
foot at $290. Total transactional volume was $493
$ $
Credit Agricole to a 20,137 SF lease
20 137 lease.
There were no construction deliveries in the second million with second quarter sales accounting for
• Miami-Dade unemployment reached quarter. With supply set to increase with the 93%. Increased sales can be attributed to lender
13.7% making it the highest in delivery of three Class A buildings by year-end and and buyer confidence and low interest rates.
South Florida and the second highest Class A vacancy currently at 17.6%, lease rates in
in Florida. Vacancy Rate 18.3%
Total Vacancy vs. Average Asking Lease Rate (FSG) Average Direct Asking Lease Rate $30.03
• Investment in Miami infrastructure is
20% $35
on the rise with the Port of Miami
expansion and Miami International $30
16%
Airport light rail link to the CBD. $25
12% $20
• Genting Group announced Resorts
World Miami, an entertainment 8% $15
complex on the current Miami Herald $10
$
site. 4%
$5
0% $0
2006 2007 2008 2009 2010 2011 YTD
© 2011, CB Richard Ellis, Inc.
- 2. MarketView Mia
Market Statistics
Direct Total YTD Net Under Avg Dir Asking
Submarket Building SF Vacancy % Vacancy % Absorption Construction Lse Rate (FSG)
ami Office
Airport W
A West 9,714,426
9 714 426 17.9
17 9 18.5
18 5 (24,712)
(24 712) 0 $25.29
$25 29
Aventura 1,269,746 11.9 12.6 26,809 0 $33.19
Biscayne Blvd. 1,214,469 42.6 42.6 (16,157) 0 $26.14
Brickell 6,536,894 17.0 17.5 99,179 614,908 $35.25
Coconut Grove 1,073,406 11.4 11.4 (8,369) 0 $30.30
Coral Gables 6,119,932 15.0 16.3 16,498 217,276 $33.69
Downtown Miami 7,442,092 20.9 21.7 (118,465) 0 $34.04
Kendall 3,444,388 11.6 12.0 30,161 0 $27.42
Miami Beach 1,903,532 10.0 11.3 (41,473) 0 $29.68
Miami Lakes 1,509,462 27.7 28.3 (18,333) 0 $23.58
North Miami 1,337,635 18.2 20.2 9,688 0 $23.76
Residual 1,502,668 13.5 13.5 (18,063 ) 0 $20.75
South Dade 499,756 18.6 18.6 (36,112) 0 $22.18
CBD Total t 13,978,986 19.1 19.7 (19,286) 614,908 $34.57
Suburban Total 29,589,420 16.9 17.6 (80,063) 217,276 $27.36
Overall Total 43,568,406 17.6 18.3 (99,349) 832,184 $30.03
Class A Total 19,456,767 16.5 17.3 13,054 832,184 $36.31
Class B Total 18,316,532 19.3 20.0 (135,915) 0 $26.56
Class C Total 5,795,107 15.7 15.8 23,512 0 $22.34
t The Miami Central Business District is a combination of the Brickell and Downtown Miami submarkets.
Miami-Dade 13.7%
Florida 10.5% The national unemployment rate decreased from 9.3% recorded last
Unemployment Rate United States 8.7% year at this time to the current rate of 8.7%. The state of Florida’s
unemployment rate decreased 0.4 percentage points to 10.5% from
14% second quarter 2010 after reaching a three decade high of 12.2%
12% during that timeframe. The statewide figure is the lowest reported
number since August 2009. Miami-Dade County was the only South
g y y
10%
Florida market to report a net increase in unemployment over the past
8% year with an increase of 1.6 percentage points. At 13.7%, Miami's
6% unemployment rate is the highest in South Florida and remains
significantly higher than the national average, but Moody's forecasters
4%
have predicted a drop of 330 basis points through 2012 to 10.4%.
2%
Since the same time last year the unemployment rate in Broward
y p y
Sec
0%
cond Quarter 2011
2006 2007 2008 2009 2010 2011 YTD County fell 0.5 percentage points to 9.0% while Palm Beach County’s
jobless rate of 10.2% was a decrease of 0.8 percentage points over
Source: Bureau of Labor Statistics (non-seasonally adjusted) the same period.
Page 2
© 2011, CB Richard Ellis, Inc.
- 3. MarketView Mia
Class A $36.31
Class B $26.56
Direct Asking Lease Rate (FSG) Class C $22.34
$40
$35 With vacancy seeing little change since first quarter, overall average
ami Office
asking lease rates predictably remained constant. While the Miami-
$30
Dade Class A rate did not change from the previous quarter, year-over-
$25 year the asking lease rate declined $0.97 PSF to $36.31. Class B and
$20 C lease rates saw minimal changes year-over-year. Stabilized
$15 buildings with high occupancy are offering fewer concessions and
sticking to asking lease rates. Over the last year, landlords focused on
$10
blend and extend deals to try to keep occupancy high and reduce cash
$5
$ outlay for TIs, however this strategy is now less common.
$0
2006 2007 2008 2009 2010 2011 YTD
Net Absorption 2011 YTD (99) K
Thousands of SF
Th d f
1,600
Miami posted a positive net absorption with 83,230 SF in the second
1,100 quarter, although YTD net absorption remains negative. Brickell,
Downtown and Airport West each posted positive net absorption
600 upwards of 30,000 SF. Most of the smaller submarkets accounted for
much of the negative absorption due to tenants taking advantage of
100
aggressive lease rates in other submarkets. After signing in January,
(400) Progressive Insurance moved into their 16,000 SF space at Flagler
Station in Airport West and Apex USA moved into its 10,000 SF space
(900) at Miami Center in Downtown.
2006 2007 2008 2009 2010 2011 YTD
Under Construction 832 K
Under Construction and Completions YTD Delivered 0 Plans for new office development were announced for the first time in
Thousands of SF several quarters. Swire Properties plans to develop Brickell CitiCentre,
4,000 a 4.6 MSF mixed use proposal that includes 900,000 SF of office.
3,500 Procacci Development is in the planning stages for its next 85,000 SF,
3,000 hurricane-resistant building at Crossroads at Dolphin Commerce
Center. In Coconut Grove, Pointe Group Advisors announced plans to
2,500
develop a 750 000 SF mixed use development that will include
750,000
2,000 225,500 SF of office to be built in phase II. Construction will take five
1,500 to seven years.
1,000
Notable Under Construction Projects:
500 Building Submarket SF
0 600 Brickell Ave. Brickell 614,908
Sec
2006 2007 2008 2009 2010 2011 YTD 396 Alhambra Circle North Coral Gables 172,276
172 276
cond Quarter 2011
IFB Headquarters Coral Gables 45,000
Page 3
© 2011, CB Richard Ellis, Inc.
- 4. MarketView Miami Office Available Square Feet
Available building area which is either physically
Top Transactions vacant or occupied.
Size (SF) Tenant Address Average Direct Asking Lease Rate
Rate determined by multiplying the asking net lease
41,892 Morgan Stanley Smith Barney 201 South Biscayne Boulevard
rate ffor each building by its available space,
h b ildi b i il bl
*39,000 Dade Medical College 5875 Northwest 163rd Street summing the products, then dividing by the sum of
the available space with net leases for all buildings in
35,000 IATA 703 Waterford Way the summary.
Size (SF) Buyer Address Sales Price Building SF
The gross building square footage minus the elevator
750,000 Genting Group 1 Herald Plaza $236 million core, flues, pipe shafts, vertical ducts, balconies, and
stairwell areas.
424,767 Crocker Partners 1 Southeast 3rd Avenue $80 million
Direct Vacancy %
Di t V
*135,000 Triarch Capital Group 19495 Biscayne Boulevard $53 million Vacant building area excluding sublease space
* Denotes a CB Richard Ellis transaction divided by the Building SF.
Miami Submarket Map Full Service Lease
A lease in which the stated rent includes the
operating expenses and taxes for the building.
Market Coverage
Includes all competitive office buildings 30,000
square ffeet and greater in size in Miami-Dade
t d t i i i Mi i D d
County, excluding single tenant, government and
medical office buildings.
Net Absorption
The change in occupied square feet from one period
to the next.
Net Leases
Includes all lease types whereby the tenant pays an
agreed rent plus most or all, of the operating
most, all
expenses and taxes for the property, including
utilities, insurance and/or maintenance expenses.
Normalization
Due to a reclassification of the market, the base,
number and square footage of buildings of previous
quarters have been adjusted to match the current
base. Availability and Vacancy figures for those
buildings have been adjusted in previous quarters.
Total Availability %
Available Square Feet divided by the Net Rentable
Area.
Total Vacancy %
Vacant building area including sublease space
divided by the Building SF.
Under Construction
Buildings which have begun construction as
evidenced by site excavation or foundation work.
Vacant Square Feet
Existing building area which is physically vacant or
immediately available.
For more information regarding the
© Copyright 2011. CB Richard Ellis (CBRE) Statistics contained herein may represent a different data set than that used MarketView, please contact:
to generate National Vacancy and Availability Index statistics published by CB Richard Ellis’ Corporate Communications Alex Vargas Vila, Researcher
Department or CB Richard Ellis’ research and Econometric Forecasting unit, Torto Wheaton Research. Information
herein has been obtained from sources believed reliable. While we do not doubt its accuracy, we have not verified it CB Richard Ellis
and make no guarantee, warranty or representation about it. It is your responsibility to independently confirm its 777 Brickell Ave, #900
accuracy and completeness. Any projections, opinions, assumptions or estimates used are for example only and do not
represent the current or future performance of the market. This information is designed exclusively for use by CB Richard T. 305.428.6345
Ellis clients, and cannot be reproduced without prior written permission of CB Richard Ellis. alex.vargasvila@cbre.com