2. INTERNATIONAL MONETARY FUND
ALBANIA
Staff Report for the 2010 Article IV Consultation
Prepared by European Department
Approved by Adam Bennett and Dominique Desruelle
April 23, 2010
Executive Summary
Context: The impact of the global crisis was buffered through the use of previously accumulated fiscal
and monetary policy space. This policy space is now depleted and needs to be rebuilt urgently to mitigate
risks to macroeconomic stability. The task is to recalibrate policies following the authorities’ counter-
cyclical response to the crisis in a setting where domestic vulnerabilities and regional risks remain
substantial.
Outlook: The baseline is for a V-shaped recovery, albeit to a lower potential growth than before the
crisis, with low inflation and external imbalances narrowing. However, downside risks are significant
and elevated budget financing requirements under unchanged policies will crowd out private investment,
thereby undermining potential growth over the medium term.
Policy Discussions: A tighter fiscal stance with improvements in productivity and competitiveness is a
superior adjustment strategy, and consolidation could serve to enhance, rather than damage, growth
prospects. The authorities’ fiscal adjustment strategy is based on over-optimistic revenue and growth
expectations. There was agreement of the benefits of a clear, credible, and monitorable fiscal rule to
safeguard fiscal sustainability. Monetary policy should remain cautious and supervisors remain vigilant,
given heightened regional uncertainty. Improvements in the business environment are critical to harvest
the benefits from closer EU integration.
Albania follows (de facto) a floating exchange rate regime with occasional interventions. Albania
maintains exchange rate restrictions under the transitional arrangements of Article XIV, but maintains no
restrictions subject to Fund jurisdiction under Article VIII.
Team: Mr. Bell (head), Ms. Chen, Mr. Steinlein (all EUR), Mr. Christofides (SPR), and Ms. Pereira
(FAD) visited Tirana from February 25 to March 9, 2010 and met with the Prime Minister, the Ministers
of Finance and of Economy, the Governor of the Central Bank, senior officials of the administration,
parliamentarians, the private sector, and academics. An outreach conference was held on March 4, 2010
with staff presentations on fiscal rules, euroization, market access conditions, and competitiveness.
3. 2
Contents Page
I. Context and Recent Developments ........................................................................................4
A. Albania’s Strengths and Weaknesses at the Onset of the Global Crisis...................4
B. The Crisis Response—Use of Built-Up Policy Buffers............................................5
C. The Post-Crisis Context—A Depleted Arsenal.........................................................7
II. Outlook: Improving, but Weighed Down by Regional Risk and Fiscal Imbalances............9
III. Policy Discussions .............................................................................................................12
A. Rebuilding Fiscal Space and Aligning the Budget with Sustainable Financing.....12
B. Conducting Effective Monetary Policy and Preserving Financial Stability ...........16
C. Enhancing Competitiveness for Better European Integration.................................20
IV. Staff Appraisal...................................................................................................................21
Boxes
1. Albania: A Case of Effective Macro-Prudential Measures ...................................................6
2. Exchange Rate Assessment..................................................................................................11
3. Euroization and Banking Sector Risks ................................................................................17
Figures
1. Comparative Economic Performance Before the Onset of the Global Crisis......................24
2. Characteristics of Albanian Banking Sector Prior to the Crisis ..........................................25
3. External Sector Developments, 2009...................................................................................26
Tables
1. Basic Indicators and Macroeconomic Framework, 2007–15 ..............................................27
2a. General Government Operations, 2007–15 (in percent of GDP).......................................28
2b. General Government Operations, 2007–15, (in billions of leks).......................................29
3. IMF Core Indicators of Financial Soundness, 2005–2009 ..................................................30
4a. Monetary Aggregates, 2007–15 (in percent of GDP)........................................................31
4b. Monetary Aggregates, 2007–15 (in billions of leks).........................................................32
5a. Balance of Payments, 2007 (in percent of GDP)...............................................................33
5b. Balance of Payments, 2007–15 (in millions of euros).......................................................34
Appendix
I. Public and External Debt Sustainability Analysis (DSA)....................................................35
4. 3
GLOSSARY
ARMO State-Owned Oil Company
BoA Bank of Albania
CEE Central and Eastern Europe
INSTAT The State Statistical Agency
NMS New Member States
PPP Purchasing Power Parity
PRG Partial Risk Guarantee
Main Sources of Economic Data for Albania
Data in the staff report reflect information received by April 9, 2010 from the following organizations:
Ministry of Finance
http://www.minfin.gov.al/index.php?lang=en&option=com_frontpage&Itemid=1
Bank of Albania
http://www.bankofalbania.org/
Ministry of Economy, Trade, and Energy
http://www.mete.gov.al/index.php?l=e
Albanian Institute of Statistics (INSTAT)
http://www.instat.gov.al/
5. 4
I. CONTEXT AND RECENT DEVELOPMENTS
A. Albania’s Strengths and Weaknesses at the Onset of the Global Crisis
1. Before the crisis, Albania enjoyed strong growth with comparatively benign
external vulnerabilities (Figure 1, Table 1). Sustained macroeconomic stability, a simplification
of the tax system, and structural reforms—in the context of subsequent Fund-supported programs
and generally good implementation of past Fund advice—helped boost investment and
productivity. As a result, growth averaged some 6¼ percent during 2005–08, largely based on
advancements in total factor productivity, while inflation was kept in check. Although current
account deficits had crept up over time, they mainly reflected an ambitious public investment
program and transition-driven productivity gains.
2. At the onset of the crisis, Albania benefited from a flexible monetary policy
framework, sound banks, and substantial foreign exchange reserve buffers, while its
weaknesses were mainly structural and elevated public debt. Inflation expectations were low,
the exchange rate stable, and the financial system entered the crisis well capitalized and
relatively solvent, liquid, and profitable (Figure 2). To a large extent this was due to the Bank of
Albania’s (BoA) early and successful adoption of macroprudential measures that, inter alia,
slowed credit growth and limited the balance sheet effects of unhedged foreign currency lending
(Box 1). External debt was low (17 percent of GDP) and reserves coverage stood above six
months of imports. In addition, the impact of the crisis was mitigated through the limited
importance of the export channel in Albania and its smaller reliance on market financing.
However, total public debt levels were sizable. Other weaknesses were concentrated in the
structural area, especially a comparatively underdeveloped business environment.
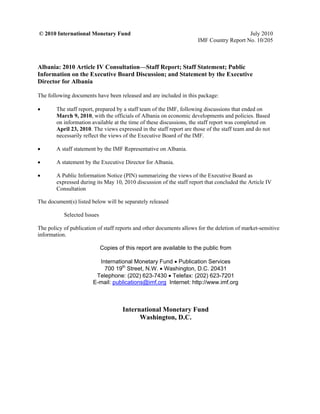
3. Despite Albania’s limited integration into global financial markets, the crisis was
transmitted to its economy via a number of channels. As elsewhere in the region, Albanian
banks witnessed substantial panic deposit withdrawals on the heels of the dislocation in US
financial markets and amplified concerns about the health of the Greek banking system in the fall
of 2008 (text chart). Deposits did not start to recover until the second half of 2009. In
February 2009, pressures mounted on the lek, and only subsided after intervention from the BoA
and substantial new inflows through privatization receipts and a syndicated loan. The recession
in trading partners—particularly Greece and Italy—led to falling exports. Finally, remittances
and nonclassified inflows, while imprecisely measured—are estimated to have fallen drastically.
6. 5
110
115
120
125
130
135
140
145
150
500
520
540
560
580
600
620
640
660
680
700
Aug-08 Oct-08 Dec-08 Feb-09 Apr-09 Jun-09 Aug-09 Oct-09 Dec-09
Deposits and Exchange Rate Movements
August 2008 to January 2010
Total deposit (constant exchange rate, billion of leks, LHS)
Exchange rate, lek/euro, RHS
May 4, 2009:
Received a
syndicated loan
September 15, 2008:
Lehman Brothers
filed for bankruptcy
September 21,
2008: Initial
TARP plan
was proposed
October 18, 2008:
Greece increased
deposit insurance
March 30, 2009:
Albania increased
deposit insurance
September 17, 2009:
Prime Minister's
reference to possible
Euro adoption
June 28, 2009:
Albania Parliamentary
elections
Sources: Bank of Albania; and IMF staff
B. The Crisis Response—Use of Built-Up Policy Buffers
4. Building on these strengths, the authorities were able to use accumulated policy
space to soften the immediate blow from the crisis, and Albania has performed better than
most other regional and European economies.
Ample liquidity buffers were utilized to meet deposit withdrawals. Throughout, foreign
banks increased exposure, inter alia complying with a BoA ban on distributing
dividends, and continued to extend credit. To further boost confidence, deposit insurance
limits were raised fivefold.
Monetary loosening, initially by quantitative easing in late 2008 via BoA direct liquidity
injections, was followed by interest rate cuts by 50 bps each in January and October
2009. Meanwhile the lek depreciated by a cumulative 14 percent.
Considerable fiscal stimulus was also provided, in part financed from the privatization
of the electricity distribution system. In the first place, automatic stabilizers on the
revenue side were given full play (1 percent of GDP). In addition, social security
contributions were cut and a large infrastructure project was in train. Moreover, there was
a strong fiscal relaxation prior to the mid-2009 elections. Together these created another
1 percent of GDP fiscal impulse.
Growth continued at an estimated 2.8 percent, in contrast to most of Europe that
witnessed declines. Inflation has mostly been in line with the target of 3±1 percent,
though depreciation pass through and higher electricity prices have recently lifted
inflation above 4 percent.
7. 6
Box 1. Albania: A Case of Effective Macro-Prudential Measures
Using powers under the new Banking Act of 2006, the BoA undertook decisive measures to restrain high
credit growth.
To improve credit risk management, stricter requirements were placed on individual banks based on
their: (i) rate of credit growth, and (ii) levels of nonperforming loans. For example,
the BoA imposed higher capital adequacy ratios (12½–13 percent) on two banks than the
minimum of 12 percent;
non-euro denominated foreign currency lending was banned;
the maximum risk weights were raised to 150 percent and banks were required to slow their
credit growth by reducing acceptable levels of customers’ debt service to income ratios to below
25 percent;
maintenance of foreign bank exposure was helped by strong moral suasion, and if needed, by
suspending dividends distribution;
in few cases, managers of banks were also removed or banks were asked to suspend expansion
of branch networks.
The BoA took a proactive approach to increase awareness on loan quality through open forums, meetings
and official letters. This approach included:
requiring prudent loan-to-value ratios;
encouraging tighter internal loan classification rules;
promoting prudence in foreign currency lending; and,
establishing a credit registry (banks submit daily (i) detailed information on the borrower and
terms of all new loans; (ii) information on related persons; and (iii) information on collateral
(banks report the status and internal classification for each loan quarterly). Banks are required to
obtain a credit report from the registry for each new credit. During on-site examinations, BoA
inspectors check the files to assure adherence to this requirement.
8. 7
-15
-10
-5
0
5
10
15
-10
-5
0
5
10
15
2008Q1 2008Q2 2008Q3 2008Q4 2009Q1 2009Q2 2009Q3
ALB BGR
HRV MKD
ROM SRB
Sources: WEO; Haver; Albanian authorities; and IMF staff estimates.
Comparative Quarterly Growth, 2008–09
(Year-on-year, in percent)
C. The Post-Crisis Context—A Depleted Arsenal
5. Policy space is now exhausted with vulnerabilities up sharply, especially given a
more challenging regional and political environment.
The fiscal position deteriorated significantly and reestablishing control over
expenditure has proved a challenge. In 2009, the fiscal deficit increased to 7.4 percent
of GDP (Table 2). Consequently, public debt shot to close to 60 percent of GDP,
40 percent of it short-term with substantial rollover risks. Moreover, a late-year attempt
at pulling back was not successful and resulted in arrears of 0.5 percent of GDP.
The banking system is only slowly recovering. Slow remonetization, rising NPLs and
only creeping credit growth have lowered profitability significantly (Tables 3 and 4).
Meanwhile, there has been some concern about the financial health of some parent banks.
Country
2008: Q3 2009: Q3 2008: Q3 2009: Q3 2008: Q3 2009: Q3
Albania 17.5 16.4 4.1 8.6 16.3 4.3
SEE average 17.2 17.4 4.6 7.9 12.8 5.1
NMS average 13.3 14.2 3.0 9.0 20.6 -5.4
Sources: IMF, Global Financial Stability Report April 2010.
Regulatory Capital to Risk-
weighted Assets
NPL to total loans Return on Equity
Financial Soundness Indicators, 2008: Q3 and 2009: Q3
9. 8
90
95
100
105
110
90
95
100
105
110
Aug-08
Sep-08
Oct-08
Nov-08
Dec-08
Jan-09
Feb-09
Mar-09
Apr-09
May-09
Jun-09
Jul-09
Aug-09
Sep-09
Oct-09
Nov-09
Dec-09
Deposits Developments,August 2008 to December 2009
(IndexAugust 2008=100)
Albania
Median 1/
Sources: International Financial Statistics;and IMF staff estimates.
1/ The countries include Albania,Bosnia and Herzegovina,Bulgaria,Croatia,Czech,Estonia,
Hungary,Kosovo,Latvia,Lithuania,FYR Macedonia,Montenegro,Poland,Romania,and Serbia.
External imbalances rose. In contrast to the region, imports declined only modestly,
leaving the current account deficit at
some 15 percent of GDP (Figure 3,
Table 5). In the past, private sector
imbalances were the key factor. While
they have begun to adjust—in line
with the drought of available
financing—more recently the
runaway fiscal deficit has driven the
current account.
Regional and political developments
add to these challenges. While the
country made important progress on EU integration, submitting its membership
application in 2009, Albania is exposed to the Mediterranean euro-periphery via
significant trade, remittances, and financial sector links to Greece and Italy. Greek bank
subsidiaries and branches account for one quarter of the banking system and have the
lowest capital and liquidity buffers in the system. Meanwhile, political uncertainty
continues as the opposition has not accepted the outcome of the mid-2009 elections.1
1
International observers endorsed the election result.
0
2
4
6
8
10
12
14
16
18
0
2
4
6
8
10
12
14
16
18
2004 2005 2006 2007 2008 2009
Current Account and Fiscal Deficits
(Percent of GDP)
Current account deficit
Fiscal deficit
Sources: WEO; and IMF staff estimates.
10. 9
II.OUTLOOK: IMPROVING, BUT WEIGHED DOWN BY REGIONAL RISK AND FISCAL
IMBALANCES
6. While there was agreement that the recovery would likely be v-shaped, staff saw it
as considerably more gradual than the authorities. In the near term, domestic demand
continued to be weighed down by weakened confidence on the back of the fiscal deterioration,
political uncertainty, sluggish
remittances, and more selective
credit extension. These drags are
only partly compensated by
improving export performance that
has been observed in the first months
of 2010 and is expected to continue.
Growth is therefore projected to
resume in the first quarter of 2010,
after an estimated GDP contraction
in the fourth quarter of 2009, and
then gradually gain strength, with
annual GDP growth in the range of
2–2½ percent in 2010. The
authorities were more optimistic, expecting activity to bounce back more quickly.
7. Substantial differences of view emerged over medium-term growth prospects. In
contrast to some other regional economies, Albania experienced only mild capital-inflow-
supported overheating, thereby limiting the buildup of output gaps. This background comforted
the authorities in their view that pre-crisis growth rates would quickly re-emerge as Albania,
compared to other countries, would see less of a need to recalibrate its growth model. Staff, on
the other hand, saw future potential growth increasingly pulled down by high fiscal financing
requirements.
Sources: Albanian authorities and IMF staff estimates.
-2
0
2
4
6
8
10
12
14
-2
0
2
4
6
8
10
12
14
2008:Q1
2008:Q2
2008:Q3
2008:Q4
2009:Q1
2009:Q2
2009:Q3
2009:Q4
2010:Q1
2010:Q2
2010:Q3
2010:Q4
2011:Q1
2011:Q2
2011:Q3
2011:Q4
Recovery Profile: Staff vs. Authorities
(quarterly growth rates (yoy))
Staff Projections
Authorities (as implied by their annual
growth projections)
Projections
(p , )
Albania
Bosnia
Croatia
Macedonia
Montenegro
Serbia
-8
-6
-4
-2
0
2
4
6
8
10
12
-8
-6
-4
-2
0
2
4
6
8
10
12
2007 2008 2009 2010 2011 2012 2013 2014 2015
Projections
Albania and SEE Real GDP Growth
(percent, annual)
Sources: WEO; and IMF staff estimates.
Projections
-4
-2
0
2
4
6
-4
-2
0
2
4
6
2007 2008 2009 2010
Source: IMF desk estimates.
2007=11.8
2008=14.9
Projections
Albania and SEE Output Gaps
(Percent of potential output)
Albania
Bosnia
Croatia
Serbia
Montenegro
Macedonia
11. 10
8. The baseline inflation outlook remains
benign. Administrative price increases may drive
headline inflation temporarily above the
3±1 percent target band in the near term. However,
underlying inflation is expected to remain under
control, and annual inflation is projected at
3.5 percent in 2010 and 3 percent in the medium
term, benefitting from the well entrenched
credibility of the monetary policy framework (see
background paper).
9. External imbalances are expected to
significantly narrow, though partly through an
undesirable compression of investment. Helped by the recent depreciation of the real exchange
rate, which eliminated the overvaluation depicted in GGER-type analysis, the current account
deficit can narrow from 14 to 13 percent this year, and should decline further over the medium
term to reach a sustainable level. The real exchange rate appears competitive and not to pose a
risk to external stability (Box 2). However, high budget deficits are severely crowding out the
private sector. Owing to the projected increased interest rates from high levels of government
borrowing, private savings are projected to pick up sharply. While companies will partially
compensate for reduced bank financing by own-funding capital expenditure, private investment
will not be able to recover to past levels, thus undermining potential growth. A tighter fiscal
stance with improvements in productivity and competitiveness would be a superior adjustment
strategy, a topic that framed the policy discussions.
10. Downward risks to the baseline are significant. Both staff and the authorities agreed
that, apart from risks stemming from the external environment, domestic vulnerabilities remain.
The relatively high presence of Greek banks amplifies trade-related contagion risk. Rollover
risks have increased—as a large part of
domestic public debt matures every
month—while the remaining privatization
program is unlikely to generate significant
proceeds. Banks will also need to keep
pace with the new outlook given weaker
credit demand, worsening loan portfolios,
and resulting lower profitability. Faltering
confidence of households and enterprises
may decrease consumption and investment
more than anticipated.
Contributions to Inflation
(Percentage points)
Source: Albania authorities.
-1
0
1
2
3
4
5
6
-1
0
1
2
3
4
5
6
2006M12
2007M3
2007M6
2007M9
2007M12
2008M3
2008M6
2008M9
2008M12
2009M3
2009M6
2009M9
2009M12
2010M03
Energy Food Other (core items)
0
0.5
1
1.5
2
2.5
3
3.5
4
4.5
Jan. Feb. Mar. Apr. May Jun. Jul. Aug. Sep. Oct. Nov. Dec.
Albania: 2010 Monthly Domestic Public Debt Rollover Requirements
(In percent of GDP)
Sources:Ministry of Finance,and IMF staff estimates.
12. 11
Box 2. Exchange Rate Assessment
The exchange rate does not appear to pose a risk to external stability. While various measures point to
some overvaluation at the end of 2008, the real effective exchange rate (REER) has since moved towards
equilibrium with depreciation of about 10 percent over 2009. However, a large deviation of the current
account from its medium-term norm remains to be corrected. On current policies, the latter correction is
projected to be driven by a substantial crowding out of the private sector.
A long-run PPP-based assessment of the exchange rate does not suggest disequilibrium. Under this
approach the equilibrium real exchange rate is expected to reflect productivity differentials between
countries. When comparing productivities (approximated by GDP per capita in PPP prices) with their
real exchange rates per PPP dollar, Albania appears in line with other countries—within one standard
deviation from the trend line.
0
20
40
60
80
100
120
140
160
0 20 40 60 80 100 120 140 160
RealPPP-basedexchangerate(Index,EuroArea=100)
Per capita GDP in PPP (Index, Euro Area=100)
PPP-based real exchange rate
Sources: WEO
Albania
CGER-type analysis suggests the REER moving towards equilibrium in 2009.
The equilibrium real exchange rate (ERER) approach, which links the equilibrium exchange
rate to a set of fundamentals, suggests neither under- nor over-valuation at end-2009. This result
is obtained using CEE panel-based regression models estimating a long-run co-integrating
relationship between the REER and fundamentals, such as relative productivity, terms of trade,
and government consumption.
An assessment based on the macroeconomic balance (MB) approach using panel estimates
which incorporate new EU-member states (see WP/08/92) shows that the underlying current
account balance, i.e., stripped of temporary factors, is below the norm at end-2008. However,
the gap is narrowing in the medium term, albeit with the exchange rate remaining somewhat
overvalued (by about 8 percent). Explanatory variables for the current account norm include the
fiscal balance, the oil balance, net foreign assets, old age dependency, FDI, population and
output growth, and a remittances dummy.
The external sustainability (ES) approach indicates that a real depreciation of about 20 percent
would be required to stabilize the NFA to GDP ratio at its estimated end-2008 level.
Est. underlying CA MB norm ES norm
2008 -12.1 -4.9 -1.5
2015 -5.2 -4.3 -1.7
Source: IMF staff projections and calculations.
Current Account: Estimated/Projected vs. Norms
(In percent of GDP)
13. 12
III. POLICY DISCUSSIONS
A. Rebuilding Fiscal Space and Aligning the Budget with Sustainable Financing
11. Fiscal consolidation was jointly seen as the key near- and medium-term policy
challenge. There was agreement that after the large fiscal stimulus in 2009, there was no further
scope for countercyclical policy and that the budget now needed to adjust.
Source:IMF.
1/For the top chart, improvements in fundamentals are indicated by a move away from the axis.
2/In percentof GDP multiplied by -1/10.
-20
-10
0
10
20
30
40
50
60
70
-20
-10
0
10
20
30
40
50
60
70
Primary balance Overall balance Current account
balance
Debt
(In percent of GDP)
Albania
Countries with market access
Countries with no market access
Debut issuers
Albania
Countries with market
access in 2009
Countries with no
market access in
2009
-20
-15
-10
-5
0
Primary balance (% of GDP)
Overall fiscal balance (% of
GDP)
Current account deficit (% of
GDP)
Debt 2/
Albania: Comparative Fundamentals
Emerging market
debut issuers
(1996 to 2009)
Notwithstanding a still fragile economic recovery, fiscal consolidation is a priority. The
government’s large financing requirement and rollover needs threaten not only its chances to
access markets but macroeconomic stability in general. Moreover, the fiscal deficit has begun to
14. 13
crowd out investment and fiscal consolidation could therefore serve to enhance, rather than
damage, growth prospects.
12. Staff cautioned against using optimistic revenue forecasts as a basis for the
authorities’ strategy. The government has targeted a reduction in the deficit to 3 percent of
GDP over the medium term. However, much of this derives from revenue growth which is not
consistent with staff’s macroeconomic projections. Little progress has been made in adapting the
2010 budget to a more challenging economic environment, and a deficit of 5.2 percent of GDP is
expected.2
Under current policies, this would be followed by deficits in excess of 6 percent
throughout the medium term, pushing debt to close to 70 percent of GDP. The authorities
proposed to link certain expenditures to revenue performance, although they acknowledged that
this tactic had not worked in 2009 (when their attempts to cut contingent expenditures were not
successful despite significant revenue shortfalls).3
Staff Auth. Staff Auth. Staff Auth. Staff Auth.
(Growth rate in percent)
Real GDP 2.3 5.5 3.2 6.5 3.6 7.1 4.2 6.7
Retail prices (avg.) 3.5 3.0 2.9 3.0 3.0 3.0 2.9 3.0
(Percent of GDP, unless otherwise indicated)
Fiscal sector 1/
Revenues and grants 25.2 26.6 25.0 26.8 25.4 26.9 25.7 27.1
Expenditures 30.3 30.6 31.1 29.9 31.6 29.9 31.9 30.0
Overall balance (including grants) -5.2 -4.0 -6.1 -3.2 -6.1 -3.0 -6.1 -3.0
Public Debt 62.8 59.5 65.1 58.2 66.9 55.7 68.1 54.0
Monetary indicators
Private credit (change in percent) 8.6 8.1 7.6 6.9
External sector
Trade balance (goods and services) -22.7 -22.4 -20.9 -19.2
Current account balance (including official trans -12.6 -11.3 -9.4 -7.5
Memorandum items
Nominal GDP (in billions of lek) 1,216.8 1,242.8 1,295.0 1,363.5 1,383.6 1,503.4 1,486.8 1,654.6
Sources: Albanian authorities; and IMF staff estimates and projections.
1/ Defined in accrual basis
Projections
Staff Baseline 2010–13 and Authorities' Views
2010 2011 2012 2013
2
This assumes planned significant one-off cuts to the 2010 budget of some 30 billion lek or 2.5 percent of GDP.
3
In December 2009, attempts to withhold the usual year-end bonus payment to civil servants and pensioners were
not successful, though payments were reduced from the levels in previous years and customary pre-payments of
January salaries were not implemented.
15. 14
0%
5%
10%
15%
20%
25%
0%
5%
10%
15%
20%
25%
2003 2004 2005 2006 2007 2008 2009
Tax Revenue Growth: Budget Forecast and Actuals
(Year-on-year percent change)
Budgeted TaxRevenue
Actual Tax Revenue
Sources: Albanian authorities; and IMF staff estimates.
13. A clear, credible, and monitorable fiscal rule could help safeguard medium-term
fiscal sustainability. Such a rule could put an end to the recent upward drift in deficits.
Moreover, a successful rule could give financial markets greater confidence into the
government’s efforts to cut debt over time, thereby boosting chances for market access. For the
rule to work, it would need to be binding on the authorities. Staff recommended anchoring the
rule to the objective of cutting public debt below 50 percent of GDP by the end of the current
government’s mandate in 2013 (Background paper). Two particular options were discussed.
Expenditure rule: this would be consistent with the authorities’ stated preference for a
small government. Keeping real expenditure constant, or limiting its increases to
2 percent could achieve debt reduction to 50 or 54 percent of GDP, respectively, by 2013.
This rule would preferably be augmented by a mechanism that would trigger lower
spending growth in the event of an unexpected revenue shortfall, while, in contrast,
positive surprises should translate into fiscal savings, reducing the risk of ever exceeding
the debt ceiling. In this way, the rule would allow for substantial play of automatic
stabilizers.
Deficit rule: this rule was favored by the authorities, as it places greater emphasis on
protecting recent gains in tax administration and the overall fiscal balance. However,
staff stressed that these gains notwithstanding, lower post-boom revenue would call into
question the current system of low income tax rates—flat at 10 percent—if the
authorities’ goal was to accommodate higher expenditure growth under a deficit rule.
16. 15
14. Staff pressed for upfront progress on fiscal consolidation. Targeting a cut in the 2010
deficit to around 3 percent of GDP, would lower the financing requirement, and mark a first step
toward credible public debt reduction. This should allow more credit to go toward private
investment, support the current account adjustment, and possibly improve the terms (and
availability) of market borrowing. To achieve such a target in 2010 requires a considerable share
of one-off measures that would need to be followed up by more structural measures over the
following years. Throughout, such adjustments can take place while protecting the most
vulnerable sections of the population.
Baseline Adjust. Baseline Adjust. Baseline Adjust. Baseline Adjust.
Revenue & Grants 25.2 25.7 25.0 25.8 25.4 26.8 25.7 27.1
Total expenditure 30.3 28.5 31.1 27.8 31.5 27.1 31.8 26.2
Primary 27.0 25.2 27.3 24.5 27.7 23.9 28.0 23.4
Current 21.9 20.2 22.1 19.6 22.5 19.0 22.8 18.4
Capital 5.1 5.0 5.2 5.0 5.2 5.0 5.2 5.0
Interest 3.3 3.3 3.8 3.3 3.8 3.1 3.8 2.9
Contingencies 0.4 0.0 0.6 0.0 0.6 0.0 0.6 0.0
Overall balance -5.2 -2.8 -6.1 -2.0 -6.1 -0.3 -6.1 0.9
Primary balance -1.8 0.5 -2.3 1.3 -2.3 2.9 -2.3 3.8
Public debt 62.3 60.4 64.6 58.8 66.4 55.2 67.7 50.1
Policy-adjusted variables:
Social Security Contributions 4.2 4.7 4.2 5.1 4.3 5.7 4.5 5.9
Wage and Personel Costs 1/ 6.3 6.0 6.3 5.6 6.3 5.3 6.3 4.9
Social Insurance Outlays 2/ 8.5 7.9 8.5 7.7 8.5 7.5 8.5 7.2
Operations and Maintenance 2.3 2.0 2.2 2.0 2.4 2.0 2.6 2.0
Local Government Expenditure 2.4 2.4 2.5 2.4 2.7 2.4 2.7 2.4
Public Investment 5.1 5.0 5.2 5.0 5.2 5.0 5.2 5.0
Contingencies 3/ 0.4 0.0 0.6 0.0 0.6 0.0 0.6 0.0
Sources: Albanian authorities; and IMF staff estimates and projections.
1/ Nominal freeze in 2010, followed by public employment rationalization.
2/ Nominal freeze in 2010, followed by CPI indexation.
3/ In the adjustment scenarion, contingencies would not be spent.
Albania: Impact of Consolidation Measures on the 2010–13 Budget Accounts
(percent of GDP)
2010 2011 2012 2013
Past tax and contribution cuts should be reconsidered. Staff saw little evidence that
last year’s cut in social security contributions was delivering the expected improved
compliance; on the contrary, it aggravated the pension deficit to 2.5 percent of GDP,
which is high in view of Albania’s fairly young population. Staff advised against a
planned tax amnesty, as it could undermine future tax compliance.
Significant expenditure adjustments could be effected in 2010. The remaining
contingency allowance (0.4 percent of GDP) in the 2010 budget could be reduced. Public
investment should be scaled back from still historically high levels to more financeable
and administratively manageable levels after the completion of the Reshen-Kalimash
17. 16
road. Looking forward, civil service employment levels should be rationalized, while
keeping wages and pensions in check. This could be helped by indexing the latter to only
inflation.
15. Staff and the authorities agreed on the need to continue structural fiscal reforms.
Capital expenditure execution remains a challenge. In past years, before the large road project,
spending lagged well behind budgeted amounts (see table) and was only boosted through late-
year reallocations. A fall-back to past implementation problems is likely unless planning and
implementation capacities are significantly enhanced. Regarding tax administration, an effective
compliance strategy is especially urgent, including by addressing the under-reporting of taxable
income by high-wealth individuals and by capturing a greater share of informal economic
activity.
Budget Actual Budget* Actual Budget Actual Budget Actual Budget Actual
Total Expenditure 30.4 28.6 27.5 28.6 30.1 29.6 33.9 32.3 33.4 33.4
Current Expenditure 23.8 23.7 23.3 22.9 23.7 23.3 23.3 23.2 24.6 24.5
Capital Expenditure 6.2 4.7 4.3 5.6 6.2 5.9 9.7 8.6 7.8 8.8
of which: RK road … … 1.0 1.0 1.5 1.8 3.1 3.6 2.3 3.6
of which: other 6.2 4.7 3.3 4.6 4.7 4.1 6.6 5.0 5.6 5.2
Overall Balance -5.2 -3.7 -1.6 -3.2 -3.8 -3.9 -7.9 -5.5 -4.3 -7.4
Sources: Albanian Ministry of Finance.
* Includes supplementary budget.
2009
Albania: Comparison of Budget and Outcome, 2005–09
(In percent of actual GDP)
2005 2006 2007 2008
16. The authorities are seeking to place a Eurobond, to lessen the heavy reliance on short-
term domestic financing, reduce near-term rollover risk and lower crowding out. However,
heightened uncertainty in international markets may have an impact on the size and pricing of
the issue, and the authorities are keeping other options on the table, including a Fund-supported
program.
B. Conducting Effective Monetary Policy and Preserving Financial Stability
17. All agreed that the prevailing monetary policy framework—an inflation target
range combined with a flexible exchange rate—is an asset in the current uncertain
environment. It has endowed the economy with considerable resilience, as evidenced by the
limited impact of the energy and food price shock on Albania in 2007–08. Recently the moderate
depreciation eased the adjustment to the global crisis while keeping inflation expectations well
anchored. This is an important achievement especially within the context of still significant
euroization, and its attendant limits on monetary policy (Box 3).
18. 17
Box 3. Euroization and Banking Sector Risks
Euroization increases banking sector risks and requires high capital and reserves buffer. Currency
mismatches could increase solvency risks of the banking sector directly through unfavorable exchange
rate movements or indirectly through credit risks of nonhedged portfolios. The central bank’s lender-of-
last-resort facilities may only have limited funding in foreign currencies in case of bank runs, which
could aggravate creditors’ fears and trigger a run. Without any implications on the direction of causality,
empirical analysis on data in some South and Eastern European countries shows that a higher degree of
Euroization is associated with higher default probabilities and higher nonperforming loan levels. These
higher risks reduce the banking sector’s capacity to provide credit by requiring higher capital or reserves.
0
20
40
60
80
100
0
20
40
60
80
100
2003 2004 2005 2006 2007 2008 2009
FX deposits/Total deposits
FX loans / Total loans
Private secotr credit/GDP
Sources: Bank of Albania; and IMF staff estimates.
0
20
40
60
80
100
0
20
40
60
80
100
HRV BIH MKD SRB BGR ALB ROM
Average credit growth 02-09
FX deposit/Total deposit
FX loans / Total loans
Sources: IMF staff estimates.
Dependent Variable
Constant 1.59*** 4.38*** 1.91*** 6.27*** -0.28 5.68* -2.18*** 0.85
Euroization 0.02*** 0.03*** 0.02*** 0.02*** 0.04*** 0.05*** 0.06*** 0.06***
GDP per capita -0.21*** -0.20*** -0.36 -0.42**
Inflation 0.00 -0.01 0.02 0.04
REER -0.27 -0.55** -0.74 -0.10
Market concentration -0.40 -0.84*** 2.19*** 2.82***
Net Interest Margin to ROA 0.011 -0.001 -0.03 -0.02
R square 0.42 0.63 0.46 0.71 0.33 0.42 0.48 0.61
NOB 35 35 35 35 35 35 35 35
Sources: IMF staff estimates.
(2) Sample includes Albania, Bosnia and Herzegovina, Bulgaria, Croatia, FYR Macedonia, Romania and Serbia from 2003 to 2007.
Euroization and Banking Sector Risks
Proxy of Default Probabilities Non-performing Loans
Notes: (1)*, ** and *** indicates significance at 10, 5 and 1 percent respectively.
While lower Euroization would facilitate monetary policy, it cannot be forced and prudential
measures should be adopted to contain the risks. De-euroization policies could involve both market-
based and administrative measures, but should stick to the principle of first maintaining macroeconomic
stability, and in particular low inflation. However, a certain degree of Euroization appears inevitable as
Albania becomes more integrated into the European market, and indeed reflects confidence in the
country’s transition process. To effectively contain the risks, banking supervisors should enhance risk-
based supervision by setting high standards for risk management and ensure that banks have adequate
buffers to handle large shocks.
19. 18
18. Monetary policy should remain cautious. Compared to many regional central banks
and a simple Taylor rule, the BoA has adopted a relatively tight stance (Text table and chart).
Staff encouraged the Bank of Albania to
continue with this cautious stance, with
the emphasis on anchoring inflation
expectations. However, while interest rate
decisions should be guided by the inflation
target, policy makers must keep an eye on
financial stability considerations and
macroprudential needs. Staff advised
against administrative measures to boost
credit to the private sector, pointing out
that a viable resumption of credit flows
will depend upon fiscal consolidation.
4.0
4.5
5.0
5.5
6.0
6.5
7.0
7.5
4.0
4.5
5.0
5.5
6.0
6.5
7.0
7.5
Mar-04
Sep-04
Mar-05
Sep-05
Mar-06
Sep-06
Mar-07
Sep-07
Mar-08
Sep-08
Mar-09
Sep-09
Actual and Predicted Policy Rates
Actual policy rate
Predicted rate
Sources: Bankof Albania; and IMF staff estimates.
0
200
400
600
800
1000
1200
Dec-02
Jun-03
Dec-03
Jun-04
Dec-04
Jun-05
Dec-05
Jun-06
Dec-06
Jun-07
Dec-07
Jun-08
Dec-08
Jun-09
Dec-09
Credit to the Private Sector
(Constant Exchange Rate, Dec 2002 = 100)
Sources: Bank of Albania; and IMF staff estimates.
20. 19
Country
De Facto
Exchange rate
t
Interest Rates Required Reserves
Albania Floating Policy rate w as low ered from
6.25 to 5.75 in Janaury 2009 and
further to 5.25 in October 2009.
No change in required reserve ratios.
Bosnia and
Herzegovina
Currency board In October 2008, the required reserves ratio on short-term deposit and
loans w as reduced from 18 to 14 percent. In May 2009, the required
reserves ratio on long term deposit and loans w as reduced from 10 to 7
percent.
Bulgaria Currency board Base interest rates have declined
from 5.77 percent in December
2008 to 1.46 percent in October
2009.
In December 2008, the minimum required reserves ratio w as reduced from
12 to 10 for lev, from 10 to 5 on deposits from abroad, and 0 on state and
local government budget funds.
Croatia Other managed float The repo rate w as reduced from
around 8-9 percent to a fixed 6
percent in November 2008.
In January 2009, the required reserve ratio w as reduced from 17 to 14
percent.
Macedonia, FYR Stabilized arrangement The policy rate w as raised from 7
to 9 percent in April 2009, and
low ered to 8.5 percent in
December 2009.
In May 2009, the required reserve ratio w as increased from 10 to 13
percent for foreign currency liabilities, and from 10 to 20 percent for
domestic currency liabilities w ith forex clause.
Romania, Rep Floating The policy rate w as reduced from
10.25 to 10 percent in Feburary
2009, 9.5 in May 2009, 9 in July
2009, 8.5 in August 2009, and 8
in September 2009.
The reserves requirement ratio w as reduced from 20 to 18 percent in
November 2008 and to 15 percent in July 2009 for lei denominated
liabilities w ith residual maturities up to tw o years. The ratio w as reduced
from 40 percent to zero for foreign currency liabilities w ith residual
maturity of over tw o years in May 2009. The ratio w as reduced from 40 to
35 percent in July, 30 percent in August, and 25 percent in November
2009 for foreign currency liabilities w ith residual maturity of up to tw o
years.
Serbia, Rep. Floating The repo rate w as cut from 15.75
to 16.5 in January, 15 in April, 13
in June, 12 in July, 11 in october
and 10 in November 2009.
In October 2008, the minimum required reserve ratio for foreign assets
w as reduced to zero and the allocation of dinars in the required reserves
w as increased from 10 to 20 percent. This ratio w as further increased to
40 percent in January 2009.
Sources: Central banks, and IMF
Monetary Policy Actions by Central Banks in the Region
19. Stress tests suggest that the banking system has sufficient buffers to weather the
expected downturn. The tests assessed key banking system risks:
Credit risk. The regulatory capital of the banking sector would remain above the
minimum required level, with two banks modestly undercapitalized according to Tier 1
leverage.
Liquidity risk. Some banks are vulnerable to reduced credit lines from parents. Reliance
on short-term BoA repo funding has increased to some €270 million in 2009.
Exchange rate risk. The banking sector would remain adequately capitalized with shocks
to the exchange rate due to its small positive foreign exchange positions, and the
associated indirect credit risks are fairly contained.
Interest rate risk. A few banks would become modestly undercapitalized with interest
rate hikes of 5 percent, but the banking sector would remain adequately capitalized.
21. 20
Wage Levels in Perspective
0
200
400
600
800
1000
1200
0
200
400
600
800
1000
1200
Albania
Bulgaria
Macedonia
Romania
Serbia
Montenegro
Bosnia
Croatia
Average monthly wages in Euros, 2007
Sources: Haver and Albania authorities.
The stress tests suggest that capital cushions, profits and increased provisioning should provide
enough resources to absorb foreseen loan losses. Assuming simultaneous shocks, some
institutions may require new capital, and the relevant banks have agreed to increase capital
accordingly.
20. The near-term banking sector outlook is stable, but uncertainties loom large. Banks
have been aided by their reliance on funding through their domestic deposit base, which is now
recovering. Many foreign parents have boosted the capital of their subsidiaries. At the same
time, Albanian firms and households are only moderately leveraged compared to South Eastern
European (SEE) peers. Staff noted that strong supervision in the past had enabled banks to draw
on large liquidity and capital buffers to weather the crisis. However, a drawn-out recovery could
further worsen the quality of domestic credit. Moreover, other risks are emerging, and
supervisors need to stay ahead of evolving challenges and risks. Notably, contingency plans that
deal with new tail risks need to be elaborated. The macroprudential toolkit should be accordingly
adapted to address any developing risks to financial stability early on, and thereby lay the
foundation for a sustainable resumption of credit growth. Noting that all banks are again
permitted to distribute profits, it was now also time for banks to move to address non-performing
loans. In particular, they should begin aggressively seizing collateral of nonperforming loans or
seek viable loan restructuring. This would also promote the correction of the real estate market
and facilitate the rebalancing of the economy.
21. Further development of the nonbank financial sector was seen as essential. The
authorities continue to work with the World Bank to develop the insurance and pension sectors,
which have potential to provide longer-term funds for investment; and staff advised that relevant
legal and regulatory problems in these two sectors should be resolved expeditiously.
C. Enhancing Competitiveness for Better European Integration
22. An improved business environment is key to harnessing the advantages from
prospective EU integration. There was agreement that the Albanian economy needed to
broaden its sources of growth and strengthen competitiveness by raising productivity and helping
Albania’s exports to climb up the value-added
ladder. Albania’s light regulation already provides
the economy with welcome flexibility, especially in
labor markets, and wage levels are among the
lowest in the region. The needed productivity gains
should be secured by greater investment. This calls
for further rapid improvements to the business
environment and investor protection along the following
lines:
Obstacles to the effective operation of privatized industries need to be addressed.
Staff encouraged the quick resolution of the regulatory issues regarding the privatized
22. 21
electricity distributor OSSH that could potentially trigger a World Bank Partial Risk
Guarantee (PRG), with adverse effects for the country’s reputation. Furthermore,
increasing payment arrears from the privatized refinery complex (ARMO) threaten the
successful privatization of Albpetrol—and thereby the conclusion of the strategic
privatization program. Staff thus recommended the initiation of legal recovery
proceedings against ARMO.
Establishing a clear property rights system—particularly for land tenure—needs to be
sped up. To bypass this bottleneck, the authorities are planning a number of industrial
zones to attract additional investment, including from abroad.
Enforcing rules. Considerable implementation and enforcement gaps for formal rules as
well as the sizeable informal economy are key—and mutually reinforcing—weaknesses.
0
1
2
3
4
5
6
0
1
2
3
4
5
6
Small-scale
privatization
Large-scale
privatization
Enterprisereform
Priceliberalisation
Tradeandforeign
exchangeliberalisation
Competitionpolicy
Bankingreform
Non-bankfinancial
institutions
Infrastructurereform
Albania(2008) Albania (2009) EU-10 (2009)
Structural Reform Progress
Source: EBRD.
23. Sound macroeconomic statistics are essential for competent policy making and
investor confidence. The national statistical agency INSTAT has made formidable progress
over recent years, for example, by starting to publish quarterly national accounts and
continuously upgrading their quality. However, considerable scope for further improvement
remains. Staff recommended a significant increase of resources and administrative support for
INSTAT and welcomed the intention to subscribe to the IMF Special Data Dissemination
Standard.
IV. STAFF APPRAISAL
24. In the face of strong headwinds, the Albanian economy has weathered the global
crisis fairly well so far, in part reflecting policy stimulus. In the budget, the full play of
automatic stabilizers was supplemented by major expenditure increases. Monetary policy
provided timely support, and the exchange rate functioned as a shock absorber. GDP is estimated
to have registered positive growth of 2.8 percent in 2009. Moreover, confidence in the financial
sector has returned, as evidenced by the resumption of deposit growth, while inflation
23. 22
expectations have remained well-contained. Both remittances and exports have begun to recover.
The baseline scenario is for a V-shaped recovery, albeit to a lower post-boom level of potential
growth, with growth in 2010 projected at 2–2½ percent. Underlying inflation is expected to
remain well contained.
25. However, policy buffers are now exhausted and must be rebuilt. Especially given the
significant downward risks from the challenging external environment and sizeable domestic
vulnerabilities, quick progress must be made to redress internal and external imbalances. With
private sector adjustment already under way, the budget must achieve a significant turnaround to
bring down the current account deficit and make space for credit extension to the private sector.
26. Fiscal tightening has to be quickly effected. The 2010 fiscal deficit should be cut to
around 3 percent of GDP (from 5.2 percent on unchanged policies) by a combination of one-time
and structural measures on both the revenue and expenditure side. Past tax and contributions cuts
should be reconsidered and a tax amnesty eschewed. All remaining contingency reserves in the
2010 budget should be saved. More fundamentally, and with more lasting impact, public
investment should be scaled back to more financeable and administratively manageable levels
after the completion of the Reshen-Kalimash road. Current spending needs to be revisited with a
view to rightsizing the civil service, and keeping wages and pensions in check, indexing them
only to inflation.
27. Medium-term fiscal policy should be governed by a credible and monitorable fiscal
rule. Limiting real expenditure increases to below 2 percent could go some way toward
achieving the government’s goal of debt reduction to 50 percent by 2013. This rule would
preferably be augmented by a mechanism that would trigger lower spending growth in the event
of an unexpected revenue shortfall. In contrast, positive surprises should translate into fiscal
savings, reducing the risk of ever exceeding the debt ceiling.
28. In addition to consolidation, there is also a role for debt management in lowering
fiscal risks. The authorities are appropriately seeking to place a Eurobond. However, heightened
uncertainty in international markets may have an impact on the size and pricing of the issue, and
the authorities are well advised to keep other options on the table, including a Fund-supported
arrangement, if a balance of payments need emerges.
29. Financial sector supervisors need to continue to stay ahead of evolving challenges
and risks. Past strong supervision has proven its worth in helping banks weather the storm.
However, supervisors need to monitor developments closely and continuously elaborate
contingency plans that deal with tail risks. Banks should help the needed economy-wide
rebalancing and real-estate price correction by executing collateral of nonperforming loans or
seeking viable loan restructurings.
30. The monetary policy framework and the flexible exchange rate have served the
economy well. Hence, the Bank of Albania should continue with its cautious stance, with a
24. 23
strong focus on anchoring inflation expectations. While interest rate decisions should be
governed by actual and projected inflation developments with respect to the inflation target,
monetary policy makers should remain mindful of financial stability considerations and
macroprudential needs.
31. Going forward, the Albanian economy needs to broaden its sources of growth and
strengthen competitiveness. This calls for further improvements in the business environment
and in investor protection. Priorities for action include the implementation and enforcement of
formal rules; improving the security of property rights (including for land tenure); and reducing
regulatory uncertainties associated with some past privatizations. Funding sources for new
investment could be boosted by finding new institutional investors, for instance, via accelerated
pension reforms.
32. Sound macroeconomic statistics are essential for competent policy making and
investor confidence. The national statistical agency INSTAT has made formidable progress
over recent years but will need a significant increase in funding and administrative support. The
intention to subscribe to the IMF Special Data Dissemination Standard is commendable.
33. It is proposed that the next Article IV consultation be held on the standard
12-month cycle.
25. 24
Figure 1. Comparative Economic Performance Before the Onset of the Global Crisis
Sources: IFS and WEO data.
0
2
4
6
8
10
0
2
4
6
8
Euro Area SEE Albania NMS
Real Annual EconomicGrowth
(Average 2003-08, In percent)
0
2
4
6
8
10
12
0
2
4
6
8
10
12
Euro Area Albania NMS SEE
Average Inflation Rates
(Dec 2003-07 and Sep 2008, annual, percent)
0
20
40
60
80
100
0
20
40
60
80
100
Albania SEE NMS
External Debt
(Average 2003-08, percent of GDP)
15
20
25
30
15
20
25
30
Euro Area SEE NMS Albania
GrossFixed Capital Formation
(Average 2003-08, percent of GDP)
0
20
40
60
80
100
120
140
160
0
20
40
60
80
100
120
140
160
Albania Euro Area SEE NMS
Trade
(2003-08 average, percent of GDP)
Exports plus imports
Exports
...reflecting and contributing to a relatively low
level of integration into the global economy.
Reliance on foreign capital inflows have been
at moderate levels...
0
2
4
6
8
10
12
14
16
18
20
0
2
4
6
8
10
12
14
16
18
20
Albania NMS SEE
Current account deficit and financial account balance
(2003-08 average, percent of GDP)
Financial account balance
Current account deficit
This performance was underpinned by
strong investment.... andlow externaldebt.
Albaniamaintainedstrong growth... ... price stability
26. 25
Figure 2. Albania: Characteristics of Albanian Banking Sector Prior to the Crisis
Sources: International Financial Statistics (IFS); and IMF staff estimates.
Given the high degree of monetization, financial intermediation in
Albania remains well below potential...
...despite an ongoing catch-up effect.
A large proportion of lended funds have been generated through
deposits…
...while the use of foreign borrowing is correspondingly low.
Core indicators point to a banking system that was solvent and
profitable before the crisis…
…particularly significant NFA buffers in September 2008
0
20
40
60
80
100
0
20
40
60
80
100
Macedonia
Albania
CzechRep.
Poland
Croatia
Serbia
Bulgaria
SlovakRep.
Bosnia
Hungary
Romania
Lithuania
Estonia
Latvia
DMBs: Foreign Currency Liabilities as Percent of
Total Credit, September 2008
Albania
Romania
Bulgaria
Lithuania
Latvia
Macedonia
Poland Hungary
Estonia
Croatia
0
200
400
600
800
1000
1200
1400
0
200
400
600
800
1000
1200
1400
1600
1800
0 10 20 30 40 50 60
Percentchangerealcredit1999-2008
Private sectorcredit to GDP in 1999
Catch-Up Effect
Slovak
Rep.
Slovak Rep.
Czech Rep.
Poland
Hungary
Bosnia
Romania Estonia
Croatia
Latvia
Lithuania
Albania
Bulgaria
-10
-5
0
5
10
15
20
25
30
35
40
45
0 20 40 60 80
Changeindeposits
Change in credit
Funding of Credit Expansion, 2002-08
(In percent of GDP)
45
degree
line
0
20
40
60
80
100
120
0
20
40
60
80
100
120
Latvia
Serbia
Romania
Lithuania
Poland
Estonia
Hungary
SlovakRep.
Bos.&Herz.
Macedonia
Czech.Rep.
Albania
Croatia
Bulgaria
Broad Money and Private Sector Credit, 2008
(Percent of GDP)
Broad money
Credit
0
5
10
15
20
25
30
0
5
10
15
20
25
30
Albania SEE NMS
NPLs and RegulatoryCapital at September 2008,
Return on Equityaverage for2005-07
NPLs Capital RoE
-80
-60
-40
-20
0
20
40
60
80
-80
-60
-40
-20
0
20
40
60
80
All banks Greek banks 1/ Others
Albanian Banks: Foreign Assetsand NFA, (percent of foreign
currencydeposits)
1/ Four Greek banksthat have relied heavily
on foreigncredit linesto fund lending.
27. 26
0
10
20
30
40
50
60
70
80
90
0
10
20
30
40
50
60
70
80
90
Food
Rawmaterials,minerals
Fuelsandlubricants
Chemicals
Manufactures
Machineryand
equipment
Overall competitiveness improving with increasing
product...
(Percent of total exports)
2006
2009
Figure 3. External Sector Developments, 2009
Sources: Albanian authorities; and IMF staff estimates.
1/ Includes SDR allocation.
-50
-40
-30
-20
-10
0
-50
-40
-30
-20
-10
0
Albania
Bosnia1/
Croatia
Kosovo
Macedonia
Montenegro
Serbia
Global crisis impacted export and imports of Albania,
but by less than of other SEE countries.
Exports Imports
(Percent change from previous year)
Imports
(3-month
moving avg)
Exports
(3-month
moving avg)
-40
-30
-20
-10
0
10
20
30
40
-40
-30
-20
-10
0
10
20
30
40
Jan-08
Mar-08
May-08
Jul-08
Sep-08
Nov-08
Jan-09
Mar-09
May-09
Jul-09
Sep-09
Nov-09
Jan-10
Decline in imports is smaller than exports, partly
because of strong governement spending...
(Percent change from previous year)
Private transfers
(3-quarter moving avg)
800
1000
1200
1400
1600
1800
2000
0
2
4
6
8
10
12
14
16
18
20
2004 2005 2006 2007 2008 2009
…resulting in only minor improvement in CA. Strong
FDI (incl. privatization reciepts) helped sustained
reserves buffers..
(Percent of GDP)
Current account deficit
FDI
GIR (in millions of EUR, right scale) 1/
REER
(2004=100)
0.0130
0.0135
0.0140
0.0145
0.0150
0.0155
0.0160
0.0165
0.0170
95
97
99
101
103
105
107
109
2004Jan
2004Jul
2005Jan
2005Jul
2006Jan
2006Jul
2007Jan
2007Jul
2008Jan
2008Jul
2009Jan
2009Jul
2011Jan
…at same time, REER depreciation contributed to
improved export competitivenes.
Export market
share (in percent;
right scale)
0
10
20
30
40
50
60
70
80
90
0
10
20
30
40
50
60
70
80
90
GreeceandItaly
OtherEUarea
ExportstoCent.&
East.Europe
RestofWorld
...and geographic diversification.
Direction of exports
Percent of total export)
2006
2007
2008
29. 28
2008 2009 2010 2011 2012 2013 2014 2015
Total revenue and grants 25.7 26.8 26.0 25.2 25.0 25.4 25.7 25.9 26.0
Tax revenue 23.6 24.3 23.5 22.9 22.9 23.3 23.7 23.9 24.0
VAT 9.1 9.8 9.5 9.3 9.2 9.5 9.6 9.7 9.7
Profit tax 2.2 1.7 1.5 1.5 1.5 1.5 1.6 1.6 1.6
Excise tax 3.0 3.0 2.9 2.9 2.9 2.9 2.9 2.9 2.9
Small business tax 0.2 0.2 0.2 0.2 0.2 0.2 0.2 0.2 0.2
Personal income tax 1.5 2.3 2.3 2.1 2.1 2.2 2.2 2.3 2.3
Customs duties 1.0 0.8 0.7 0.7 0.6 0.6 0.6 0.6 0.6
Other taxes 1.5 1.3 1.2 1.2 1.2 1.2 1.2 1.2 1.2
Property and local taxes 0.7 0.8 0.8 0.9 0.9 0.9 0.9 0.9 0.9
Social insurance contributions 4.3 4.4 4.3 4.2 4.2 4.3 4.5 4.5 4.6
Non-tax revenue 1.9 2.1 2.1 1.7 1.6 1.6 1.5 1.5 1.5
Grants 0.1 0.4 0.3 0.5 0.5 0.5 0.5 0.4 0.4
Total expenditure 29.6 32.3 33.4 30.3 31.1 31.6 31.9 32.1 32.2
Current expenditure 23.3 23.2 24.5 24.8 25.3 25.7 26.0 26.3 26.3
Personnel cost 6.1 6.1 6.3 6.3 6.3 6.3 6.3 6.3 6.3
Interest 2.6 2.9 3.1 3.3 3.8 3.8 3.9 4.0 4.1
Of which: domestic 2.4 2.6 2.7 2.7 2.8 2.9 3.0 3.2 3.4
Operations & maintenance 2.6 2.6 2.4 2.3 2.2 2.4 2.6 2.8 2.8
Subsidies 0.4 0.2 0.2 0.2 0.2 0.1 0.1 0.1 0.1
Social insurance outlays 7.2 7.0 8.4 8.5 8.5 8.5 8.5 8.5 8.5
Local government expenditure 2.2 2.5 2.8 2.4 2.5 2.7 2.7 2.7 2.7
Social protection transfers 1.5 1.6 1.7 1.7 1.7 1.7 1.7 1.7 1.7
Capital expenditure 1/ 5.9 8.6 8.8 5.1 5.2 5.2 5.2 5.2 5.2
Lending minus repayment 0.3 0.5 0.0 0.0 0.0 0.0 0.0 0.0 0.0
Reserve and contingency funds 2/ 0.0 0.0 0.0 0.4 0.6 0.6 0.6 0.6 0.6
Overall balance -3.9 -5.5 -7.4 -5.2 -6.1 -6.1 -6.1 -6.2 -6.2
Current balance including grants 3/ 2.3 3.5 1.4 0.1 -0.6 -0.6 -0.6 -0.7 -0.6
Financing 3.9 5.4 7.4 5.2 6.1 6.1 6.1 6.2 6.2
Domestic 4/ 3.3 2.2 3.7 2.0 3.8 4.4 5.7 6.2 6.7
Privatization receipts 5/ 1.6 0.5 2.4 0.0 0.0 0.0 0.0 0.0 0.0
Net borrowing 1.8 1.7 0.9 2.5 3.8 4.4 5.7 6.2 6.7
Foreign 0.5 3.2 3.7 3.1 2.3 1.7 0.4 0.0 -0.5
Memorandum Items:
Primary balance -1.2 -2.7 -4.3 -1.8 -2.3 -2.3 -2.3 -2.2 -2.1
Current balance excluding grants 2.2 3.2 1.1 -0.4 -1.1 -1.1 -1.1 -1.1 -1.1
Total spending contingencies 0.0 0.0 0.4 1.0 1.0 1.0 1.0 1.0 1.0
Expenditures in priority sectors 6/ 9.5 9.5 9.7 9.7 9.7 9.7 9.9 9.9 9.9
Public debt 53.9 55.2 59.7 62.8 65.1 66.9 68.1 69.1 69.9
Domestic general government 38.2 36.8 36.0 36.6 38.2 40.1 43.0 46.1 49.3
External 15.7 18.4 23.7 26.2 26.9 26.8 25.1 23.0 20.6
GDP (in billions of leks) 967 1,088 1,153 1,217 1,295 1,384 1,487 1,604 1,735
Sources: Albanian authorities; and IMF staff estimates and projections.
1/ Excludes capital transfer to KESH in 2007.
2/ Spending contingencies are reported according to their economic classification at outturn.
3/ Revenue including grants minus current expenditure (including the capital transfer to KESH in 2007).
4/ Includes arrears in 2009
5/ Includes privatization of ARMO in 2008 and OSSH in 2009.
6/ Education, health, and road sectors.
Projection
Table 2a. Albania: General Government Operations, 2007–15
(Percent of GDP)
2007
30. 29
2008 2009 2010 2011 2012 2013 2014 2015
Total revenue and grants 248.3 291.2 299.2 306.3 323.7 351.5 382.5 415.2 451.4
Tax revenue 228.2 264.2 270.8 278.8 296.4 322.6 352.5 383.2 417.1
VAT 87.8 107.1 110.1 113.1 119.7 130.8 143.2 155.1 167.9
Profit tax 21.1 18.1 17.1 18.1 19.3 21.1 23.1 25.2 27.5
Excise tax 28.7 32.5 33.5 35.4 37.6 40.2 43.2 46.6 50.4
Small business tax 2.2 2.6 2.5 2.6 2.8 3.1 3.4 3.7 4.0
Personal income tax 14.8 24.5 26.8 25.5 27.4 30.0 33.2 36.5 40.3
Customs duties 9.8 8.7 7.9 7.9 7.5 8.0 8.6 9.3 10.1
Other taxes 14.5 14.4 13.4 14.3 15.2 16.3 17.5 18.8 20.4
Property and local taxes 7.1 8.7 9.7 10.7 11.9 13.1 14.1 15.2 16.5
Social insurance contributions 42.0 47.6 49.8 51.2 55.0 60.0 66.2 72.7 80.0
Non-tax revenue 18.8 22.8 24.3 21.3 21.0 22.0 23.0 24.8 26.8
Grants 1.3 4.2 4.0 6.3 6.4 6.8 6.9 7.2 7.4
Total expenditure 285.7 351.5 384.7 369.2 402.5 436.5 473.8 515.1 558.5
Current expenditure 225.6 252.7 282.9 302.0 327.4 355.8 387.0 421.5 457.2
Personnel cost 59.1 66.6 72.7 76.7 81.7 87.2 93.8 101.2 109.4
Interest 25.6 31.3 36.3 40.6 49.3 53.1 57.8 63.9 71.0
Of which: domestic 23.5 28.4 31.4 33.2 35.6 39.5 44.4 51.2 59.2
Operations & maintenance 25.2 28.8 27.9 27.8 28.6 33.1 38.7 44.6 48.2
Subsidies 3.5 2.6 2.0 1.9 2.0 2.0 2.0 2.2 2.3
Social insurance outlays 69.9 76.2 96.7 103.7 110.3 117.9 126.7 136.7 147.8
Local government expenditure 21.3 27.1 32.8 29.3 32.2 37.1 40.8 44.0 47.6
Social protection transfers 14.8 17.8 19.1 20.5 21.8 23.9 26.0 27.6 29.3
Property compensation 0.5 0.0 1.7 1.4 1.4 1.4 1.4 1.4 1.4
Capital expenditure 1/ 57.0 93.8 101.6 61.9 67.6 72.2 77.6 83.7 90.5
Lending minus repayment 3.0 5.0 0.1 0.0 0.0 0.0 0.0 0.0 0.0
Reserve and contingency funds 2/ . 0.0 0.0 0.0 5.2 7.6 8.6 9.2 10.0 10.8
Overall balance 3/ -37.4 -60.2 -85.5 -62.8 -78.8 -85.1 -91.3 -99.9 -107.1
Current balance including grants 4/ 22.7 38.6 16.3 1.7 -7.4 -8.6 -9.1 -11.2 -11.2
Financing 37.4 59.1 79.9 68.3 78.8 85.1 91.3 99.9 107.1
Domestic 32.1 24.4 37.4 30.4 48.9 61.4 84.9 100.2 116.0
Privatization receipts 5/ 15.1 5.5 27.6 0.3 0.3 0.3 0.3 0.0 0.0
Net borrowing 17.0 18.9 9.8 30.1 48.6 61.1 84.6 100.2 116.0
Foreign 5.3 34.7 42.5 37.9 29.9 23.7 6.4 -0.2 -8.9
Memorandum Items:
Primary balance -11.8 -28.9 -49.2 -22.2 -29.5 -31.9 -33.6 -36.0 -36.1
Current balance excluding grants 21.4 34.3 12.2 -4.6 -13.8 -15.4 -16.1 -18.4 -18.6
Total spending contingencies 0.0 0.0 5.0 12.9 17.4 19.8 21.1 22.0 24.1
Expenditures in priority sectors 6/ 91.5 102.9 112.0 118.2 125.8 134.4 146.5 158.1 171.0
Public Debt 521.1 600.2 688.1 764.0 842.8 925.7 1013.0 1109.2 1212.6
Domestic general government 369.5 400.5 415.4 445.5 494.1 555.2 639.8 739.9 855.9
External 151.5 199.7 272.8 318.5 348.7 370.6 373.2 369.3 356.7
Direct government external debt 123.5 167.8 238.1 280.3 305.3 321.7 319.3 310.3 292.6
Government guaranteed external debt 28.0 32.0 34.7 38.2 43.4 48.9 53.9 59.0 64.1
Sources: Albanian authorities; and IMF staff estimates and projections.
1/ Excludes capital transfer to KESH in 2007.
2/ Spending contingencies are reported according to their economic classification at outturn.
3/ Arrears accumulated in 2009.
4/ Revenue including grants minus current expenditure (including the capital transfer to KESH in 2007).
5/ Includes privatization of ARMO in 2008 and OSSH in 2009.
6/ Education, health, and road sectors.
Projection
Table 2b. Albania: General Government Operations, 2007–15
(Billions of leks)
2007
31. 30
Dec-05 Dec-06 Dec-07 Dec-08 Dec-09
I Capital-based
(i) Regulatory capital as a percent of risk-weighted assets 18.6 18.1 17.1 17.2 16.2
(ii) Regulatory Tier 1 capital as a percent of risk-weighted assets 18.1 17.1 16.0 16.3 15.3
(iii) Capital as a percent of total assets
Regulatory Tier 1 capital as a percent of total assets 5.4 5.9 5.8 6.7 8.7
Regulatory capital as a percent of total assets 5.6 6.2 6.2 7.0 9.2
Shareholders' equity as a percent of total assets 6.6 6.8 7.6 8.6 9.6
(iv) Nonperforming loans net of provisions as a percent of capital
Nonperforming loans net of provisions as a percent of regulatory Tier 1 capital 4.4 7.2 12.0 27.2 29.9
Nonperforming loans net of provisions as a percent of regulatory capital 4.3 6.8 11.2 25.7 28.2
Nonperforming loans net of provisions as a percent of shareholders' equity 3.6 6.3 9.1 21.1 27.1
(v) Return on equity (ROE) (annual basis) 22.2 20.2 20.7 11.4 4.6
(vi) Net open position in foreign exchange as a percent of capital
Net open position in foreign exchange as a percent of regulatory Tier 1 capital 9.5 5.5 1.8 4.5 4.1
Net open position in foreign exchange as a percent of regulatory capital 9.3 5.2 1.7 4.3 3.9
Net open position in foreign exchange as a percent of shareholders' equity 7.8 4.8 1.4 3.5 3.7
II Asset-based
(vii) Liquid assets as a percent of total assets (Liquid-asset ratio) 1/ 62.6 57.6 49.8 42.8 27.6
(viii) Liquid assets as a percent of short-term liabilities 1/ 75.2 69.5 55.6 104.7 32.6
(ix) Return on assets (ROA) (net income to average total assets) (annual basis) 1.4 1.4 1.6 0.9 0.4
(x) Nonperforming loans (gross) as a percent of total loans 2.3 3.1 3.4 6.6 10.5
(xi) Sectoral distribution of loans to total loans na na na na na
III Income and expense-based
(xii) Interest margin to gross income 84.0 92.6 92.7 106.5 119.6
(xiii) Noninterest expenses to gross income 76.3 65.7 58.5 69.6 83.0
IV Memorandum items
Other (noncore) indicators:
Customer deposits as a percent of total (non-interbank) loans 342.5 265.5 215.5 162.6 154.3
Foreign currency-denominated loans to total loans 75.5 71.9 72.5 72.6 70.2
Foreign currency-denominated liabilities as a percent of total liabilities 41.0 44.0 46.9 48.5 48.9
Other indicators:
Risk weighted assets as a percent of total assets 30.0 34.6 36.4 40.8 56.7
Total loans as a percent of total assets 25.7 31.7 39.4 47.6 50.8
Total loans as a percent of shareholders' equity 387.0 469.5 516.4 555.1 530.2
Source: Data provided by Bank of Albania.
1/ Definition of liquid assets and short term liabilities were changed in October 2009.
Table 3. Albania: IMF Core Indicators of Financial Soundness, 2005–2009
34. 33
2007 2008 2009 2010 2011 2012 2013 2014 2015
Est.
Current account -10.3 -15.3 -14.0 -12.6 -11.3 -9.4 -7.5 -6.2 -5.2
Balance of goods and services -26.7 -26.8 -25.0 -22.7 -22.4 -20.9 -19.2 -17.9 -16.7
Exports 28.1 29.6 28.2 28.9 28.9 29.9 31.1 32.0 32.9
Goods 10.1 10.4 8.6 9.1 9.3 9.5 9.6 9.8 10.0
Services 18.1 19.2 19.6 19.8 19.6 20.4 21.5 22.2 22.9
Imports 54.9 56.5 53.2 51.6 51.3 50.7 50.3 49.9 49.6
Goods 37.0 38.1 34.9 33.4 33.0 32.4 31.9 31.4 31.3
Services 17.9 18.4 18.3 18.2 18.3 18.4 18.4 18.5 18.3
Income balance 2.8 0.6 -0.7 -1.1 -0.9 -0.6 -0.4 -0.3 -0.3
Of which: Interest due 0.6 0.7 0.9 1.1 1.1 1.0 0.9 0.9 0.8
Private transfers 1/ 12.6 10.3 10.9 10.4 11.2 11.4 11.4 11.4 11.4
Official transfers 1.0 0.7 0.7 0.7 0.8 0.7 0.7 0.6 0.5
Financial account 9.8 16.7 11.4 10.2 9.3 9.1 7.7 7.3 6.6
Direct investment 6.1 6.8 7.7 6.8 6.3 6.3 6.3 6.3 6.3
Other capital 2.6 6.2 -0.4 0.2 0.9 1.3 1.3 1.3 1.0
Private loans (incl.net trade credits) 0.1 1.0 0.8 0.7 0.8 1.1 0.9 0.8 0.6
Other financial flows 2.5 5.2 -1.2 -0.5 0.0 0.2 0.4 0.5 0.4
Of which: Change in NFA of DMBs (increase = -) 2/ 0.9 5.2 -1.9 -0.5 0.1 0.2 0.2 0.2 0.2
Medium- and long-term loans (net) 1.1 3.8 4.1 3.3 2.2 1.5 0.1 -0.3 -0.8
New borrowing 1.6 4.3 4.8 6.4 3.2 2.4 1.1 1.0 2.9
Multilateral loans 1.2 1.3 1.7 1.8 1.6 0.7 0.1 0.1 0.0
World Bank 0.5 0.3 0.3 0.5 0.4 0.2 0.1 0.1 0.0
EBRD 0.2 0.3 0.4 0.4 0.4 0.0 0.0 0.0 0.0
Other 0.5 0.7 1.0 0.8 0.8 0.5 0.0 0.0 0.0
Bilateral loans 0.4 0.4 0.9 1.2 1.0 1.2 0.5 0.5 0.3
Commercial debt 0.0 2.6 2.2 3.4 0.5 0.5 0.5 0.4 2.6
Amortization -0.5 -0.5 -0.7 -3.2 -1.0 -1.0 -1.0 -1.3 -3.6
Errors and omissions 3/ 1.3 0.8 2.1 2.1 2.0 1.9 1.7 1.6 1.5
Net balance 0.7 2.2 -0.5 -0.3 0.0 1.6 2.0 2.7 2.9
Available financing -1.9 -2.2 0.5 0.3 0.0 -1.6 -2.0 -2.7 -2.9
Change in net reserves (increase = -) 2/ -1.9 -2.2 0.5 0.3 0.0 -1.6 -2.0 -2.7 -2.9
BOP support 0.0 0.0 0.0 0.0 0.0 0.0 0.0 0.0 0.0
Changes in arrears (increase = +) 4/ 0.0 -0.1 -0.1 -0.2 0.0 0.0 0.0 0.0 0.0
Overdue debt forgiveness 0.0 0.0 0.0 0.0 0.0 0.0 0.0 0.0 0.0
Rescheduling 4/ 0.0 0.1 0.1 0.2 0.0 0.0 0.0 0.0 0.0
Identified Financing 0.1 0.0 0.0 0.0 0.0 0.0 0.0 0.0 0.0
Of which: World Bank including DPL 0.1 0.0 0.0 0.0 0.0 0.0 0.0 0.0 0.0
Sources: Ministry of Finance; Bank of Albania; donors; and Fund staff estimates and projections.
1/ Bank of Albania data plus IMF estimate (to capture some unrecorded inflows not captured in the BOA estimate).
2/ Net of valuation changes in 2007–09. In projections for 2010–15, valuation effects are assumed to be zero.
3/ Net errors and omissions include unidentified flows of private transfers.
4/ In 2006–2007 assumes rescheduling of stock of outstanding arrears, both with official and private creditors.
Table 5a . Albania: Balance of Payments, 2007–15
(In percent of GDP)
Projections
35. 34
2007 2008 2009 2010 2011 2012 2013 2014 2015
Est.
Current account -809 -1,342 -1,227 -1,101 -1,040 -918 -787 -703 -638
Balance of goods and services -2,092 -2,361 -2,183 -1,981 -2,063 -2,046 -2,023 -2,035 -2,054
Exports 2,202 2,605 2,469 2,529 2,661 2,931 3,274 3,633 4,035
Goods 786 917 751 796 859 928 1,012 1,113 1,224
Services 1,415 1,688 1,718 1,733 1,802 2,003 2,262 2,520 2,811
Imports 4,293 4,967 4,652 4,510 4,724 4,977 5,297 5,668 6,090
Goods 2,891 3,349 3,054 2,920 3,038 3,176 3,355 3,567 3,845
Services 1,402 1,618 1,598 1,590 1,686 1,800 1,942 2,101 2,244
Income balance 221 55 -59 -96 -81 -58 -39 -29 -39
Of which: Interest due 51 66 83 100 102 99 93 97 102
Private transfers 1/ 983 905 957 913 1,032 1,119 1,204 1,295 1,399
Official transfers 78 59 58 62 71 68 71 66 58
Financial account 765 1,472 997 892 860 888 811 828 805
Direct investment, net 477 597 672 591 580 618 663 710 774
Other capital 206 545 -34 14 79 127 134 153 125
Private loans (incl.net trade credits) 11 86 70 61 76 106 95 96 77
Other financial flows 195 459 -105 -47 3 21 39 57 48
Of which: Change in NFA of DMBs (increase = -) 2/ 73 461 -169 -45 9 21 24 27 29
Medium- and long-term loans (net) 83 331 359 286 201 143 13 -35 -94
New borrowing 124 376 422 564 294 239 116 108 351
Multilateral loans 94 110 153 159 150 70 14 6 0
World Bank 39 27 30 45 39 22 11 6 0
EBRD 14 25 33 39 37 0 0 0 0
Other 41 59 89 74 73 48 3 0 0
Bilateral loans 29 36 77 105 95 120 53 52 31
Commercial debt 0 230 193 300 50 50 50 50 320
Amortization -41 -45 -63 -277 -93 -96 -103 -143 -445
Errors and omissions 3/ 102 66 183 183 183 183 183 183 183
Net balance 58 197 -47 -26 3 154 206 308 350
Available financing -142 -197 47 26 -3 -154 -206 -308 -350
Change in net reserves (increase = -) 2/ -149 -197 47 26 -3 -154 -206 -308 -350
Of which: Change in gross reserves, (increase = -) 2/ -144 -192 100 35 6 -146 -199 -302 -345
Use of Fund Resources (net) -5 -5 -7 -9 -9 -8 -8 -7 -5
Budget support 0 0 0 0 0 0 0 0 0
Changes in arrears (increase = +) 4/ -3 -10 -11 -20 0 0 0 0 0
Overdue debt forgiveness 0 0 0 0 0 0 0 0 0
Rescheduling 4/ 3 10 11 0 0 0 0 0 0
Identified Financing 7 0 0 0 0 0 0 0 0
Of which: World Bank including DPL 7 0 0 0 0 0 0 0 0
Financing gap 5/ 0 0 0 20 0 0 0 0 0
Arrears Rescheduling 0 0 0 20 0 0 0 0 0
Memorandum items:
GDP in Euros 7,823 8,796 8,749 8,742 9,208 9,810 10,528 11,358 12,281
Gross usable reserves 1,467 1,721 1,621 1,586 1,580 1,725 1,924 2,226 2,571
(months of imports of goods and services) 4.1 4.2 4.2 4.2 4.0 4.2 4.4 4.7 5.1
Balance of goods and services (percent of GDP) -26.7 -26.8 -25.0 -22.7 -22.4 -20.9 -19.2 -17.9 -16.7
Current account (percent of GDP) -10.3 -15.3 -14.0 -12.6 -11.3 -9.4 -7.5 -6.2 -5.2
Debt service (percent of exports of goods and services) 6/ 2.6 2.7 5.0 12.8 5.0 4.3 3.3 3.5 10.3
Debt service (percent of central government revenues) 6/ 2.9 3.1 5.8 15.9 6.2 5.4 4.4 4.7 14.4
Total external debt stock (percent of GDP) 7/ 23.8 29.9 34.1 36.6 37.2 37.2 35.3 33.0 30.2
Volume of Exports of Goods and Services (percent change) 21.7 14.9 -8.0 -2.5 5.0 7.3 8.1 8.7 8.9
Volume of Imports of Goods and Services (percent change) 10.4 6.0 1.2 -7.9 2.9 3.8 4.5 5.1 5.8
Sources: Ministry of Finance; Bank of Albania; donors; and IMFstaff estimates and projections.
1/ Bank of Albania data plus IMF estimate (to capture some unrecorded inflows not captured in the BOA estimate).
2/ Net of valuation changes in 2007–09. In projections for 2010–15, valuation effects are assumed to be zero.
3/ Net errors and omissions include unidentified flows of private transfers.
4/ In 2010 assumes rescheduling of stock of outstanding arrears, both with official and private creditors.
5/ The financing gap,if any, is expected to be fully covered by arrears rescheduling.
6/ Public and publicly guaranteed debt only.
7/ Public and private external debt, including arrears. Debt stock converted into Lek at the e-o-p exchange rate.
Table 5b. Albania: Balance of Payments, 2007–15
(In millions of Euros)
Projections
36. 35
Appendix I. Public1
and External Debt Sustainability Analysis (DSA)
In the absence of further policy adjustment, public debt levels may turn unsustainable.
Total public debt has picked up since 2007, practically reaching the Albanian legal limit of
60 percent of GDP in 20092
. Taking into account the authorities’ current medium-term spending
plan, staff projects that debt ratios will continue to grow and reach 70 percent of GDP in 2015
(Table A.1). With such a debt path, financing the deficit will be increasingly hard. The average
maturity of domestic debt is still relatively low (as of the beginning of 2010 the duration of the
domestic portfolio was 0.8 years) and the share of concessional lending should decrease in the
coming years as Albania seeks financing in international capital markets.
The medium term target of a debt-to-GDP ratio below 50 percent is only attainable after
substantial fiscal consolidation. This target—elucidated in the government’s program—will not
be met in the baseline scenario. The following chart illustrates the need for a drastic reduction of
budget deficits in the short run if debt is to converge swiftly to this level.
3% deficit
30
35
40
45
50
55
60
65
2009 2014 2019 2024 2029
DebtDynamics for DifferentBudgetDeficits
4% deficit
2% deficit
Sources: Albanian authorities; and IMF staff estimates.
Stress tests indicate important vulnerabilities (Figure A.1). Public debt dynamics are
particularly vulnerable to a sharp depreciation of the lek and to a lower than projected growth
path (half standard deviation drop). Furthermore, persistently higher primary deficits (by
0.6 percent) due, for example, to a protracted burden of the current social security system, would
bring debt up to almost 74 percent by 2015. In all instances, the prospects of meeting debt targets
would be severely undermined. Finally, following unchanged policies would push up debt above
100 percent of GDP by 2015 as privatization proceeds are now mostly exhausted.
1
This section covers General Government Public Debt. Stress tests were performed using IMF’s Debt Sustainability
Assessment Framework for Market Access Countries: http://imf.org/external/np/pp/eng/2005/070105.htm
2
Foreseen in the 2008 Organic Budget Law.
37. 36
External debt has been on the rise since 2005 but remains sustainable based on current
staff projections. Policies, however, should be mindful of vulnerabilities, particularly given
the risks associated with current account and other shocks. Under the assumptions that
(i) growth will gradually return to its potential level with stabilizing global conditions, and
(ii) borrowing will moderate with FDI inflows strengthening and current account improving,
external debt is projected to peak at 37 percent of GDP in 2012 and then decline to 30 percent of
GDP by 2015 (Table A.2). Stress tests highlight vulnerabilities to the current account, and
combined shocks including real interest, growth and current account balance shocks
(Figure A.2). Under these two shocks external debt is projected to increase to 42 and 37 percent
of GDP by 2015, respectively
38. 37
2005 2006 2007 2008 2009 2010 2011 2012 2013 2014 2015 Debt-stabilizing
primary
balance 9/
Baseline: Public sector debt 1/ 58.0 56.0 53.9 55.2 59.7 62.8 65.1 66.9 68.1 69.1 69.9 -0.9
o/w foreign-currency denominated 18.0 16.9 15.7 18.4 23.7 25.4 25.5 24.3 22.8 20.8 18.7
Change in public sector debt 0.3 -2.0 -2.1 1.3 4.5 3.1 2.3 1.8 1.2 1.0 0.7
Identified debt-creating flows (4+7+12) 0.1 -5.9 -17.4 -5.1 -23.8 2.2 2.0 1.7 1.2 1.2 1.0
Primary deficit 0.5 0.4 1.2 2.7 3.8 2.3 2.3 2.3 2.3 2.2 2.1
Revenue and grants 25.0 25.3 25.7 26.8 26.0 25.2 25.0 25.4 25.7 25.9 26.0
Primary (noninterest) expenditure 25.5 25.8 26.9 29.4 29.7 27.5 27.3 27.7 28.0 28.1 28.1
Automatic debt dynamics 2/ 0.5 -3.6 -3.5 -2.2 0.0 0.2 0.0 -0.3 -0.8 -1.0 -1.1
Contribution from interest rate/growth differential 3/ -1.5 -2.1 -1.6 -3.1 0.0 0.2 0.0 -0.3 -0.8 -1.0 -1.1
Of which contribution from real interest rate 1.5 0.8 1.5 0.6 1.5 1.5 1.9 1.9 1.9 2.0 2.1
Of which contribution from real GDP growth -3.1 -2.9 -3.1 -3.8 -1.5 -1.3 -1.9 -2.2 -2.6 -3.0 -3.2
Contribution from exchange rate depreciation 4/ 2.0 -1.5 -1.9 0.9 ... ... ... ... ... ... ...
Other identified debt-creating flows -0.9 -2.8 -15.1 -5.5 -27.6 -0.3 -0.3 -0.3 -0.3 0.0 0.0
Privatization receipts (negative) -0.9 -2.8 -15.1 -5.5 -27.6 -0.3 -0.3 -0.3 -0.3 0.0 0.0
Recognition of implicit or contingent liabilities 0.0 0.0 0.0 0.0 0.0 0.0 0.0 0.0 0.0 0.0 0.0
Other (specify, e.g. bank recapitalization) 0.0 0.0 0.0 0.0 0.0 0.0 0.0 0.0 0.0 0.0 0.0
Residual, including asset changes (2-3) 5/ 0.3 3.9 15.3 6.3 28.3 0.9 0.3 0.1 0.0 -0.2 -0.2
Public sector debt-to-revenue ratio 1/ 232.4 221.0 209.9 206.1 230.0 249.4 260.3 263.4 264.9 267.1 268.6
Gross financing need 6/ 4.1 3.7 4.3 5.9 7.5 8.4 6.7 6.8 6.8 7.2 9.5
in billions of U.S. dollars 0.3 0.3 0.5 0.8 0.9 1.1 0.9 1.0 1.0 1.2 1.7
Scenario with key variables at their historical averages 7/ 59.7 60.6 60.9 61.1 61.1 61.2 61.3 -1.5
Scenario with no policy change (constant primary balance) in 2009-2014 59.7 90.9 95.2 98.7 101.3 103.4 105.3 -1.6
Key Macroeconomic and Fiscal Assumptions Underlying Baseline
Real GDP growth (in percent) 5.8 5.5 6.0 7.8 2.8 2.3 3.2 3.6 4.2 4.7 5.0
Average nominal interest rate on public debt (in percent) 8/ 6.0 5.3 5.1 6.0 6.0 5.9 6.5 6.3 6.2 6.3 6.4
Average real interest rate (nominal rate minus change in GDP deflator, in percent) 3.1 1.7 3.0 1.7 3.0 2.7 3.3 3.2 3.1 3.2 3.4
Nominal appreciation (increase in US dollar value of local currency, in percent) -10.4 10.0 13.8 -6.2 ... ... ... ... ... ... ...
Inflation rate (GDP deflator, in percent) 2.9 3.5 2.1 4.3 3.1 3.2 3.1 3.1 3.1 3.1 3.0
Growth of real primary spending (deflated by GDP deflator, in percent) 3.5 6.8 10.6 18.0 3.9 -5.6 2.5 5.3 5.2 5.2 4.9
Primary deficit 0.5 0.4 1.2 2.7 3.8 2.3 2.3 2.3 2.3 2.2 2.1
1/ Indicate coverage of public sector, e.g., general government or nonfinancial public sector. Also whether net or gross debt is used.
2/ Derived as [(r - (1+g - g + (1+r]/(1+g++g)) times previous period debt ratio, with r = interest rate; = growth rate of GDP deflator; g = real GDP growth rate; = share of foreign-currency
denominated debt; and = nominal exchange rate depreciation (measured by increase in local currency value of U.S. dollar).
3/ The real interest rate contribution is derived from the denominator in footnote 2/ as r - π (1+g) and the real growth contribution as -g.
4/ The exchange rate contribution is derived from the numerator in footnote 2/ as (1+r).
5/ For projections, this line includes exchange rate changes.
6/ Defined as public sector deficit, plus amortization of medium and long-term public sector debt, plus short-term debt at end of previous period.
7/ The key variables include real GDP growth; real interest rate; and primary balance in percent of GDP.
8/ Derived as nominal interest expenditure divided by previous period debt stock.
9/ Assumes that key variables (real GDP growth, real interest rate, and other identified debt-creating flows) remain at the level of the last projection year.
Table A.1. Country: Public Sector Debt Sustainability Framework, 2005–2015
(In percent of GDP, unless otherwise indicated)
Actual Projections
39. 38
Growth
shock
77
Baseline
70
40
45
50
55
60
65
70
75
80
Growth shock (in percent per year)
Baseline
70
40
45
50
55
60
65
70
75
80
PB shock
74
i-rate
shock
72
Baseline
70
40
45
50
55
60
65
70
75
Interest rate shock (in percent)
Figure A.1. Albania: Public Debt Sustainability: Bound Tests 1/
(Public debt in percent of GDP)
Sources: International MonetaryFund,countrydeskdata, and staff estimates.
1/ Shaded areas represent actual data.Individual shocks are permanent one-half standard deviation shocks.
Figures in the boxesrepresent average projectionsfor the respective variables in the baseline and scenario being
presented. Ten-yearhistoricalaverage forthe variable is also shown.
2/ Permanent 1/4 standard deviation shocksapplied to real interest rate, growth rate, and primarybalance.
3/ One-time real depreciation of 30 percent and 10 percent of GDP shock to contingent liabilitiesoccurin 2010,
with real depreciation defined as nominaldepreciation (measured by percentage fall in dollar value of local
currency)minusdomestic inflation (based on GDP deflator).
Historical
Baseline
3
4
5
6
7
8
9
10
40
45
50
55
60
65
70
75
Baseline and historical scenarios
75
Baseline
70
40
45
50
55
60
65
70
75
80
Combined shock 2/
Combined
shock
Baseline
70
80
45
50
55
60
65
70
75
80
contingent
liabilitiesshock
30 % depreciation
Real depreciation and contingent liabilities shocks 3/
Grossfinancing need
under baseline
(right scale)
Primary balance shock (in percent of GDP)
Baseline: -2.2
Scenario: -2.9
Historical: -1.9
Baseline: 3.8
Scenario: 2.9
Historical: 5.8
Baseline 3.2
Scenario: 3.8
Historical 3.1
40. 39
Projections
2005 2006 2007 2008 2009 2010 2011 2012 2013 2014 2015 Debt-stabilizing
non-interest
current account 6/
Baseline: External debt 20.4 25.3 25.8 27.6 34.1 35.9 37.0 37.0 35.3 32.9 30.2 -7.7
Change in external debt -3.9 4.9 0.6 1.8 6.5 1.8 1.2 0.0 -1.7 -2.4 -2.7
Identified external debt-creating flows (4+8+9) -4.7 -0.1 0.5 3.9 8.2 5.0 3.8 1.7 -0.4 -1.8 -3.0
Current account deficit, excluding interest payments 5.7 5.0 9.7 14.5 13.3 11.4 10.1 8.2 6.5 5.2 4.1
Deficit in balance of goods and services 24.6 24.1 26.8 26.8 25.0 22.6 22.4 20.9 19.2 17.9 16.8
Exports 22.8 25.2 28.2 29.5 28.2 28.9 28.9 29.9 31.1 31.9 33.0
Imports 47.4 49.3 55.1 56.3 53.2 51.5 51.3 50.8 50.4 49.8 49.8
Net non-debt creating capital inflows (negative) -3.4 -3.6 -6.1 -6.8 -7.9 -6.7 -6.3 -6.3 -6.3 -6.2 -6.3
Automatic debt dynamics 1/ -7.0 -1.5 -3.1 -3.8 2.8 0.3 0.0 -0.3 -0.6 -0.7 -0.7
Contribution from nominal interest rate 0.4 0.6 0.6 0.7 0.9 1.1 1.1 1.0 0.9 0.9 0.8
Contribution from real GDP growth -2.0 -1.0 -1.3 -1.7 -0.8 -0.8 -1.1 -1.3 -1.5 -1.5 -1.5
Contribution from price and exchange rate changes 2/ -5.4 -1.1 -2.4 -2.9 2.6 ... ... ... ... ... ...
Residual, incl. change in gross foreign assets (2-3) 3/ 0.8 4.9 0.0 -2.1 -1.6 -3.2 -2.6 -1.7 -1.3 -0.6 0.3
External debt-to-exports ratio (in percent) 89.4 100.4 91.5 93.4 120.8 124.4 128.1 123.9 113.3 103.0 91.6
Gross external financing need (in billions of US dollars) 4/ 551.0 598.7 1349.0 2413.2 2584.2 2459.6 2066.5 1891.0 1731.6 1677.2 1971.3
in percent of GDP 6.7 6.6 12.6 18.6 21.2 20.6 16.6 14.4 12.3 11.2 12.2
Scenario with key variables at their historical averages 5/ 35.9 31.2 28.5 26.5 25.2 24.6 -7.5
Key Macroeconomic Assumptions Underlying Baseline
Real GDP growth (in percent) 11.8 5.5 6.0 7.8 2.8 2.3 3.2 3.6 4.2 4.7 5.0
GDP deflator in US dollars (change in percent) 28.6 5.5 10.6 12.7 -8.7 -4.1 0.7 2.3 2.3 2.4 2.4
Nominal external interest rate (in percent) 2.2 3.1 3.0 3.5 3.2 3.3 3.2 2.9 2.5 2.6 2.7
Growth of exports (US dollar terms, in percent) 60.0 22.9 31.6 27.1 -10.3 0.3 4.1 9.5 11.1 9.8 11.1
Growth of imports (US dollar terms, in percent) 50.5 15.8 31.0 24.2 -11.4 -5.1 3.7 4.8 5.8 5.9 7.4
Current account balance, excluding interest payments -5.7 -5.0 -9.7 -14.5 -13.3 -11.4 -10.1 -8.2 -6.5 -5.2 -4.1
Net non-debt creating capital inflows 3.4 3.6 6.1 6.8 7.9 6.7 6.3 6.3 6.3 6.2 6.3
1/ Derived as [r - g - (1+g) + (1+r)]/(1+g++g) times previous period debt stock, with r = nominal effective interest rate on external debt; = change in domestic GDP deflator in US dollar terms, g = real GDP growth rate,
= nominal appreciation (increase in dollar value of domestic currency), and = share of domestic-currency denominated debt in total external debt.
2/ The contribution from price and exchange rate changes is defined as [-(1+g(1+r1+g++g) times previous period debt stock. increases with an appreciating domestic currency (> 0) and rising inflation (based
on GDP deflator).
3/ For projection, line includes the impact of price and exchange rate changes.
4/ Defined as current account deficit, plus amortization on medium- and long-term debt, plus short-term debt at end of previous period.
5/ The key variables include real GDP growth; nominal interest rate; dollar deflator growth; and both non-interest current account and non-debt inflows in percent of GDP.
6/ Long-run, constant balance that stabilizes the debt ratio assuming that key variables (real GDP growth, nominal interest rate, dollar deflator growth, and non-debt inflows in percent of GDP) remain at their levels
of the last projection year.
Table A.2. Country: External Debt Sustainability Framework, 2005-2015
(In percent of GDP, unless otherwise indicated)
Actual
41. 40
Grossfinancing need
under baseline
(right scale)
Non-interest current account shock
(in percent of GDP)
i-rate
shock
31
Baseline
30
0
5
10
15
20
25
30
35
40
45
50
55
2005 2007 2009 2011 2013 2015
Interest rate shock (in percent)
Figure A.2. Albania: External Debt Sustainability: Bound Tests 1/
(External debt in percent of GDP)
Sources:International Monetary Fund,Country desk data, and staff estimates.
1/Shaded areas representactual data. Individual shocks are permanentone-half standard deviation
shocks.Figures in the boxes representaverage projections for the respective variables in the
baseline and scenario being presented.Ten-year historical average for the variable is also shown.
2/Permanent1/4 standard deviation shocks applied to real interest rate, growth rate, and current
accountbalance.
3/One-time real depreciation of 30 percentoccurs in 2009.
Historical
25
Baseline
30
0
2
4
6
8
10
12
14
16
18
20
22
24
0
5
10
15
20
25
30
35
40
45
50
55
2005 2007 2009 2011 2013 2015
Baseline and historical scenarios
CAshock
42
Baseline
30
0
5
10
15
20
25
30
35
40
45
50
55
2005 2007 2009 2011 2013 2015
Combine
d shock
37
Baseline
30
0
5
10
15
20
25
30
35
40
45
50
55
2005 2007 2009 2011 2013 2015
Combined shock 2/
30 %
depreciation
30Baseline
30
0
5
10
15
20
25
30
35
40
45
50
55
2005 2007 2009 2011 2013 2015
Real depreciation shock 3/
Growth
shock
31
Baseline
30
0
5
10
15
20
25
30
35
40
45
50
55
2005 2007 2009 2011 2013 2015
Growth shock (in percent per year)
Baseline:
Scenario:
Historical:
2.8
3.4
2.0
Baseline:
Scenario:
Historical:
4.1
2.8
6.8
Baseline:
Scenario:
Historical:
-6.8
-9.3
-6.4
42. INTERNATIONAL MONETARY FUND
ALBANIA
Staff Report for the 2010 Article IV Consultation
Informational Annex
Prepared by the European Department
(In consultation with other departments and the World Bank)
April 23, 2010
Contents Page
I. Fund Relations .....................................................................................................................2
II. IMF-World Bank Relations .................................................................................................5
III. Statistical Issues...................................................................................................................7
43. 2
I. FUND RELATIONS
As of March 31, 2010
I. Membership Status: Joined: 10/15/1991; Article XIV
II. General Resources Account: SDR Million Percent Quota
Quota 48.70 100.00
Fund Holdings of Currency 53.87 110.62
Reserve position in Fund 3.35 6.89
III. SDR Department: SDR Million Percent Allocation
Net cumulative allocation 46.45 100.00
Holdings 46.65 100.42
IV. Outstanding Purchases and Loans: SDR Million Percent Quota
Extended Arrangement 8.52 17.50
PRGF Arrangements 33.35 68.47
V. Financial Arrangements:
Approval Expiration Amount Approved Amount Drawn
Type Date Date (SDR Million) (SDR Million)
EFF 2/01/2006 1/31/2009 8.52 8.52
PRGF 2/01/2006 1/31/2009 8.52 8.52
PRGF 6/21/2002 11/20/2005 28.00 28.00
VI. Projected Payments to the Fund (Expectation Basis)
(SDR Million; based on existing use of resources and present holdings of SDRs):
Forthcoming
2010 2011 2012 2013 2014
Principal 4.31 7.64 6.72 6.81 5.80
Charges/Interest 0.09 0.11 0.14 0.11 0.09
Total 4.40 7.75 6.86 6.93 5.89
VII. Safeguards Assessments:
The Bank of Albania (BoA) was subject to a safeguards assessment with respect to current
arrangements. The most recent assessment was completed on July 14, 2006 and found that
some weaknesses exist in the central bank's safeguards framework. The main
vulnerabilities identified by the assessment concern the quality of the external audit,
oversight of the external and internal audit functions and the system of internal controls,