Haiti: Humanitarian appeal funding for Haiti drops from 74% in 2010 to 40% in 2012
•
0 likes•264 views

New infographic highlights drop of level in funding since the earthquake

Recommended
More Related Content
More from Professor Eric K. Noji, M.D., MPH, DTMH(Lon), FRCP(UK)hon
More from Professor Eric K. Noji, M.D., MPH, DTMH(Lon), FRCP(UK)hon (20)
Haiti: Humanitarian appeal funding for Haiti drops from 74% in 2010 to 40% in 2012
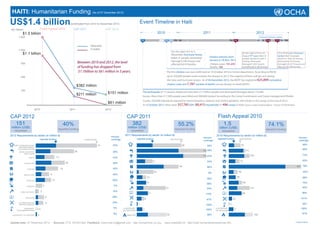
- 1. HAITI: Humanitarian Funding (As of 07 December 2012) US$1.4 billion contributed from 2010 to December 2012. Event Timeline in Haiti ($) million Flash Appeal 2010 CAP 2011 CAP 2012 $1.5 billion 2010 2011 2012 1,500 Hurricane and storm season Jan Oct Nov Dec Jan Dec Jan Jun Jul Aug Oct Nov Dec Required 1,200 Funded On the night of 4 to 5 $1.1 billion November Hurricane Tomas On the night of 24 to 25 23 to 30 October Hurricane Cholera statistics from August TS* Isaac killed 24 Sandy killed 54 people, killed 21 people, destroyed/ people, injured 42 with 3 injured 21 with 20 missing, damage 6,340 houses and January to 30 Nov. 2012 900 Between 2010 and 2012, the level affected 6,610 families Cholera cases: 101,250 missing, destroyed/ damaged 1,005 houses destroyed 6,274 houses, damaged 21,427 houses and of funding has dropped from Deaths: 760 and affected 8,189 families. affected 39, 058 families. $1.1billion to $61 million in 3 years. The first cholera case was confirmed on 19 October 2010 in Centre department. According to PAHO, 600 up to 250,000 people could contract the disease in 2012. The majority of them will get sick during the rainy and hurricane season. As of 04 December 2012, the MSPP has registered 625,899 cumulative cholera cases and 7,787 number of deaths (source Ministry of Health-MSPP) $382 million 300 $211 million $151 million The earthquake of 12 January displaced more than 2.1 million people and destroyed/damaged about 175,682 homes. More than 217,300 people were killed and 300,600 injured. According to the Camp Coordination and Camp management/Shelter Cluster, 320,000 individuals exposed to natural disasters, violence and cholera epidemic will remain in the camps at the end of 2012. $61 million As of October 2012, there were 357,785 IDPs (90,415 Households) in 496 camps in Haiti (Source: Data Tracking Matrix - Cluster CCCM/Shelter) 2010 2011 2012 CAP 2012 CAP 2011 Flash Appeal 2010 151 40% 382 55.2% 1.5 74.1% million (US$) million (US$) billion (US$) reported funding reported funding reported funding requested requested requested 2012 Requirements by sector (in million $) 2011 Requirements by sector (in million $) 2010 Requirements by sector (in million $) Percent Percent Percent reported funding requirement coverage reported funding requirement reported funding requirement coverage coverage CAMP COORDINATION AND 41 33% 48 35% 79 46% CAMP MANAGEMENT (CCCM) AND SHELTER 89% WATER, SANITATION 26 38% 75 59% 111 AND HYGIENE 75 67% 140 74% HEALTH 13 47% 17 53% 72 62% PROTECTION 20 54% 45 66% 487 78% FOOD AID 15 43% 18 9% 59 54% AGRICULTURE 9 42% 10 48 96% 56% NUTRITION 10 60% 10 90 74% 95% LOGISTICS 4 0% 31 24% 141 40% EARLY RECOVERY 2 14% 11 110% 88 99% 6 28% EDUCATION 8 67% 22 101% COORDINATION AND 5 34% SUPPORT SERVICES 1 100% 4 18% EMERGENCY 0.4 0% CLUSTER NOT CLUSTER NOT 0 100% TELECOMMUNICATIONS YET SPECIFIED 0 100% YET SPECIFIED 0% 32 38% 162 67% CLUSTER NOT YET SPECIFIED 0 SHELTER Update date: 07 December 2012 Sources: FTS, OCHA Haiti Feedback: ocha.haiti.im@gmail.com http://ochaonline.un.org www.reliefweb.int http://haiti.humanitarianresponse.info * Tropical Storm