Create a basic performance point dashboard epc
•Télécharger en tant que DOCX, PDF•
1 j'aime•1,598 vues


Recommandé
Recommandé
Contenu connexe
Tendances
Tendances (17)
Similaire à Create a basic performance point dashboard epc
Similaire à Create a basic performance point dashboard epc (20)
Plus de EPC Group
Plus de EPC Group (20)
Dernier
Dernier (20)
Create a basic performance point dashboard epc
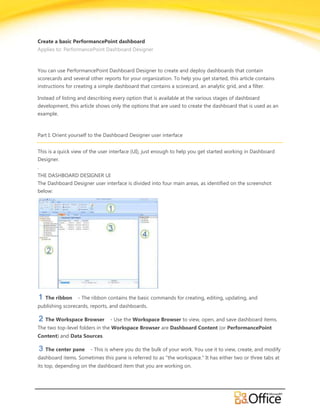
- 1. Create a basic PerformancePoint dashboard Applies to: PerformancePoint Dashboard Designer You can use PerformancePoint Dashboard Designer to create and deploy dashboards that contain scorecards and several other reports for your organization. To help you get started, this article contains instructions for creating a simple dashboard that contains a scorecard, an analytic grid, and a filter. Instead of listing and describing every option that is available at the various stages of dashboard development, this article shows only the options that are used to create the dashboard that is used as an example. Part I: Orient yourself to the Dashboard Designer user interface This is a quick view of the user interface (UI), just enough to help you get started working in Dashboard Designer. . THE DASHBOARD DESIGNER UI The Dashboard Designer user interface is divided into four main areas, as identified on the screenshot below: The ribbon - The ribbon contains the basic commands for creating, editing, updating, and publishing scorecards, reports, and dashboards. The Workspace Browser - Use the Workspace Browser to view, open, and save dashboard items. The two top-level folders in the Workspace Browser are Dashboard Content (or PerformancePoint Content) and Data Sources. The center pane - This is where you do the bulk of your work. You use it to view, create, and modify dashboard items. Sometimes this pane is referred to as "the workspace." It has either two or three tabs at its top, depending on the dashboard item that you are working on.
- 2. The Details pane - This pane becomes visible only when you select a dashboard item in the Workspace Browser. You use this pane to add or change the content that you display in a dashboard item. The items that are available in the Details pane vary according to the dashboard item that you are working on. ICONS FOR DASHBOARD ITEMS The dashboard items that are displayed in the center pane are associated with icons that help orient you to the content on the pane. The icons provide a quick means of identifying the various dashboard items that you see. A typical set of dashboard content items might resemble this: The following table lists and explains the icons that are used in the Dashboard Designer center pane. ICON DASHBOARD ITEM Dashboard Data source Filter Indicator KPI Report Scorecard NOTE When a dashboard item has not been saved, a pencil symbol appears across the face of the associated dashboard item icon. This filter icon , for example, is covered by the pencil symbol. The pencil disappears when the filter is saved. ©2009 Microsoft Corporation.
- 3. Part II: Create your dashboard items Before you can create a dashboard, you must create the items that will populate it. In this example, you select or create an Analysis Services data source, create a basic analytic grid report, select or create some KPIs, and then create a scorecard and a dashboard filter. NOTE You can create Analysis Services data sources in either SQL Server 2005 Analysis Services or SQL Server 2008 Analysis Services SELECT OR CREATE AN ANALYSIS SERVICES DATA SOURCE To select an existing data source 1. In the Workspace Browser pane, select Data Sources. 2. Click Refresh to make sure that the latest list of dashboard items is available. 3. Under Data Sources, double-click the data source that you plan to use. The data source opens in the center pane. 4. On the Editor tab, click Test Data Source to verify all your connection settings. A Test Connection dialog box should open and provide a "Connection Successful!" message. If you do not get this message, contact your administrator. 5. Click Close. To create a new data source 1. In the Workspace Browser tab, right-click the Data Sources folder. 2. Select the New Data Source option. A new Select a Data Source Template opens. 3. In the Template pane of the Select a Data Source Template dialog box, click Multidimensional, select the Analysis Services template, and then click OK. Your data source will appear in the Workspace Browser as "New Data Source." 4. In the Workspace Browser, select your new data source and rename it to an appropriate name. In this example, the new data source name is "Equipment Sales." ©2009 Microsoft Corporation.
- 4. 5. Configure the data source. a. On the Editor tab, select the Use Standard Connection option inConnection Settings. b. In the Server text box, enter the name of the server that hosts your data. Contact your IT administrator to find out what name you should use. The example shown here uses "cubes3." c. In the Database drop-down box, select the name of the database that contains the data that you need. In this example, the database is "Adventure Works DW." d. In the Cube drop-down box, select the cube that you want to work with. The example shown here uses the "Adventure Works" cube. e. Select the Unattended Service Account option in the Data Source Settings area of the pane. Your selections should look similar to those in the following screen shot. f. Click Test Data Source to verify all your connection settings. ATest Connection dialog box should open and provide a "Connection Successful!" message. Click Close. If the connection fails, contact your administrator. 6. In the Workspace Browser, right-click the name of your new data source and select Save. CREATE A BASIC ANALYTIC GRID REPORT An analytic grid is an interactive table that uses data that is stored in SQL Server 2005 Analysis Services or SQL Server 2008 Analysis Services. You create an analytic grid in two stages: first, you create the basic structure of your report and then you configure it to display data. To create the basic structure of your report 1. In the Workspace Browser pane, select Dashboard Content. 2. Click the Create tab, and then click Analytic Grid. The Create an Analytic Grid Report wizard opens. 3. On the Workspace tab, select your data source (Equipment Sales, in this example). ©2009 Microsoft Corporation.
- 5. 4. Click Finish. A "New Report" screen opens in the center pane and "New Report" is highlighted in the Workspace Browser pane. 5. In the Workspace Browser pane, select your new report, right-click it, and select Rename from the menu that appears. The "New Report" name will be highlighted in the Workspace Browser pane. 6. Enter the new name of your report in the highlighted area. In the following example, the new name is "Equipment Sales Report." 7. Right-click the report name and select Save. Your new report is saved to SharePoint Server 2010. Your report should look similar to the one in the following screen shot. The next step is to configure your report to display data. To configure your report to display data 1. In the center pane of the workspace, click the Design tab. 2. On the Details pane, expand Measures, Dimensions, or Named Sets to display the list of items that are available in each category. Drag an item to the Rows, Columns, or Background section of your report. Repeat this action for each item that you want to display in your grid. Consider the following points as you add items to your report: The Rows section corresponds to the horizontal rows of your grid. The Columns section corresponds to the vertical columns. Items that you place in the Background section serve as hidden filters for your analytic grid. ©2009 Microsoft Corporation.
- 6. To display data in your analytic grid, you must place at least one item in each Rows and Columns section, and you must place a measure in either Rows, Columns, or Background. IMPORTANT If you do not place a measure in one of these areas, the data that is displayed will be the default measure for the database, even though the default measure is not displayed anywhere. You can place a named set in one section, and a measure in another section. Or, you can select a hierarchy from the Dimensions group in one section and a measure in another. NOTE The hierarchies are represented in the tree on the Details pane by either six stacked boxes or a box pyramid . 3. For each hierarchy on your grid, you can select the dimension hierarchy members that you want to display. a. Click the DOWN ARROW next to the dimension name. The Select Members dialog box opens. Use the expandable tree control to view the list of dimension hierarchy members. In this example, two members are selected: Accessories and Bikes. The Default Member [All Products) option is cleared. b. Select the items that you want to display in your analytic grid, and then click OK NOTE If you want to use all dimension hierarchy members, select the Default Member (All Products) check box. Otherwise, clear that check box and select only the dimension hierarchy members that you want to use. The Select Members dialog box closes and your analytic grid refreshes to display the members that you selected. The following example shows an analytic grid report that displays information about accessories and bikes that were sold during the year 2004. ©2009 Microsoft Corporation.
- 7. "Accessories" and "Bikes," which are displayed in the rows of the grid, are members of the Product Categories dimension hierarchy. France, Germany and the United States, which are displayed in the columns of the grid, are members of the Geography dimension hierarchy. The Date dimension hierarchy is the filter that is applied in the Background area. It limits the resulting data to the years 2004. NOTE Sales amount is the default measure that is used for accessories and bikes in this example, so the Sales amount measure was not added as a background item. To see everything that is included in a specific category, click the +sign next to its name. In the example shown in the preceding screen shot, Bikes is expanded to show the three kinds of bikes that are available. Touring Bikes is expanded to show all the available touring bikes. c. In the Workspace Browser pane, right-click the name of the report that you created and select Save. Your report is now ready to be added to a dashboard. CREATE A BASIC SCORECARD By using scorecards, users can track results through simple visual summaries. Most dashboards contain at least one scorecard. By viewing the status of key metrics on a scorecard, you can assess the performance of your organization against those metrics. You can use a wizard to create your scorecard. 1. On the Create tab of the ribbon, click Scorecard. The Select a Scorecard Template dialog box opens. 2. In the Select a Scorecard Template dialog box, select the Microsoft category and then select the Analysis Services template. This template is based on multidimensional data that is available in SQL Server 2005 Analysis Services (SSAS) or SQL Server 2008 Analysis Services. 3. Click OK to close the Select a Scorecard Template dialog box. The Select a data source page of the wizard opens. 4. Select the data source that you plan to use and then click Next. The Select a KPI Source wizard page opens. 5. Select the Create KPIs from SQL Server Analysis Services measures option and then click Next. The Select KPIs to Import page opens. 6. Click the Add KPI tab repeatedly until you see all the KPIs that you want to use. If you add any KPIs that you do not want to use, select them and then click Delete Selected KPIs. ©2009 Microsoft Corporation.
- 8. 7. When you finish selecting all the KPIs that you want to use, click Next. The Add Measure Filters page opens. Do not enter anything on this page. 8. Click Next. The Add Member Columns page opens. Do not enter anything on this page. 9. Click Next. You will be prompted to select a location. The usual choice is the default location. 10. Click Finish to close the wizard. Your new scorecard will appear in the center pane and "New Scorecard" will appear at the top of the center pane and in highlighted form in the Workspace Browser pane. 11. In the Workspace Browser pane, right-click the name of the new scorecard, select Rename from the list on the menu, and then type the new name in the highlighted area. 12. In the Workspace Browser pane, right-click the scorecard name and select Save from the menu. Your scorecard is now complete. It should look similar to the "Equipment Sales Scorecard" in this example. NOTE The sample data used in creating the above scorecard resulted in identical Actual and Target figures. In a live situation, with real data, this is unlikely to happen. CREATE A BASIC DASHBOARD FILTER When you add a measure filter to a scorecard, you can limit the data to the dimension hierarchy members that satisfy your filter criteria. For example, you might use a measure filter that includes sales totals for the most recent month, and omits all previous sales amounts. The addition of a filter provides users of the ©2009 Microsoft Corporation.
- 9. dashboards with interactivity. Essentially, you are creating a tool for consumers of the dashboard to interact with the data. To add a measure filter: 1. Click the Create tab and, on the ribbon, select Filter. The Select a Filter Template dialog box opens. 2. Select Member Selection and then click OK. The Select a data source page opens. 3. On the Workspace tab, click the data source that you want to use. This example uses "Equipment Sales" as the data source. 4. Click Next. The Select Members page opens. 5. Next to the Filter dimension box, click Select Dimension. The Select Dimension dialog box opens. 6. Select the dimension that you want to use. "Date.Date.Fiscal" is used in this example. 7. Next to the Filter members box, click Select Members. If you want dashboard users to be able to filter the data so they can choose to view specific members, select All members. In this example, FY 2002, FY2003, and FY2004 are selected. When the dashboard is deployed, users can filter data to see information for specific fiscal years. ©2009 Microsoft Corporation.
- 10. 8. Click OK to close the dialog box and return to the Select Members page, which should look similar to this one. 9. Click Next. The Select Display Method page opens. 10. Choose List and then click Finish. The new filter opens in the center pane and its name is displayed in the Workspace Browser. 11. In the Workspace Browser, right-click the name of the new filter, select Rename from the menu, and then rename the filter. The new name will appear in the Workspace Browser and in the center pane. In this example, the new name is "Time filter for Equipment Sales." 12. In the Workspace Browser, right-click the filter name and select Save from the menu. Your filter is now complete and you are ready to assemble your dashboard. ©2009 Microsoft Corporation.
- 11. Part III: Create, connect, and deploy your dashboard You now have all the pieces for your PerformancePoint dashboard: a data source, an analytic grid report, a scorecard, and a filter. You are ready to put them together and create a dashboard. CREATE A BASIC DASHBOARD PAGE 1. Click the Create tab, and then click Dashboard. 2. In the Select a Dashboard Page Template dialog box, click the 2 Columns template, and then click OK. The wizard closes and a new dashboard opens in the center pane. "New Dashboard" is highlighted in the Workspace Browser pane. 3. In the Workspace Browser pane, right-click the highlighted dashboard name, select Rename from the menu, and type a new name for your dashboard. 4. In the Workspace Browser pane, right-click the highlighted dashboard name and select Save. Your dashboard is now available for you to edit in the center pane. It should look similar to the Equipment Sales Dashboard in this example. ASSEMBLE A BASIC DASHBOARD The Details pane is divided into zones. The current dashboard has two vertical zones. The next step is to add your scorecard and your analytic grid report to these zones. 1. In the Details pane, locate the analytic grid, the scorecard, and the filter that you created, and then drag them to zones in your dashboard. In this example, the time filter and the scorecard are moved to one ©2009 Microsoft Corporation.
- 12. zone and the report is moved to the adjacent zone. TIP If no dashboard elements appear in the Details pane, click the Hometab, and then click Refresh. 2. In the Workspace Browser pane, right-click the dashboard name and then click Save. You are now ready to connect the filter to your scorecard or report. CONNECT A BASIC FILTER TO A SCORECARD AND A REPORT You can use Dashboard Designer to link a filter to a scorecard or to an analytic chart or grid. After you establish the connections, dashboard users can use the filter to view specific information. The linked item is a filter for the scorecard or analytic report. In this example, the filter is connected to both the scorecard and the analytic grid. That way, the user can view results that are shown in each for a specified time period. Connect a filter to a scorecard: 1. Click the DOWN ARROW in the Time filter drop-down box and select Create Connection. The Connection dialog box opens. 2. Click the Items tab. In the Send values to list box select the scorecard that you created. ©2009 Microsoft Corporation.
- 13. 3. Click the Values tab. In the Connect to list box, select Page. In the Source value box select Member Unique Name, and then click OK. This action links the time filter to the scorecard. Connect a filter to a report: 1. Click the DOWN ARROW in the Time filter drop-down box and select Create Connection. The Connection dialog box opens. 2. Click the Items tab. In the Get values from list box, select the filter that you created. In this example, it is "Time filter for Equipment Sales." In the Send values to box select the name of the report that you created. The report in this example is "Equipment Sales Report." ©2009 Microsoft Corporation.
- 14. 3. Click the Values tab. In the Connect to list box, select the dimension hierarchy that you want to connect your filter to. "Date Fiscal" is the choice in this example. In the Source value box select Member Unique Name, and then click OK. 4. Click OK to close the Connection dialog box and return to the dashboard. 5. In the Workspace Browser, right-click the dashboard name and then select Save. This action links the time filter to the report. Your dashboard is now completed. The completed dashboard should resemble the one below. The time filter appears on both sides of the report because it is connected to both the scorecard and the analytic grid report. ©2009 Microsoft Corporation.
- 15. DEPLOY YOUR DASHBOARD TO SHAREPOINT Although you now have a completed dashboard, users cannot see it or use it until you deploy it to SharePoint Server 2010. After you deploy it, users can drill into the data in each Web Part. They can also filter it to view discrete groups of data, open it in a new window, and change analytic grids to analytic charts. 1. Make sure that you have saved all dashboard items that you plan to use on your dashboard. You cannot deploy a dashboard that contains unsaved items. 2. In the Workspace Browser pane, right-click the new dashboard and select Deploy to SharePoint. TIP You can also press Ctrl + D to deploy your dashboard to SharePoint Server 2010. A Deploy to SharePoint Site message box opens and is continuously displayed during the dashboard deployment. When the deployment is complete, the message box closes and you can view the new dashboard. The basic dashboard, created through steps in this article, displays a scorecard and an analytic grid. A time filter is applied to both so that users can drill into data for the specific fiscal year that they want to analyze. ©2009 Microsoft Corporation.
- 16. When you gain more experience with Dashboard Designer, you can create more complex scorecards by connecting to different data sources, using more filters, different dimensions, different report types, more elaborate scorecards, and so on. The possibilities are virtually limitless. ©2009 Microsoft Corporation.