SlideShare une entreprise Scribd logo
1  sur  5
Filter data in Excel Services
     Applies to: Microsoft SharePoint Server 2010


     Filtering data is a quick and easy way to create a subset of data in a range of cells or in a table column.
     Filtered data displays only the rows that meet criteria that you specify and hides rows that you do not
     want to display. You can also filter by more than one column. Filters are additive. Each additional filter that
     you apply works only the subset of data produced by the current filter, and therefore further reduces the
     subset of data. Thus, you might first filter on data from the year 2008, and then on data from France. The
     resulting information would contain only data that applied to France in 2008.

     You can filter by a list of values or by criteria.

     Filter text


1.   Locate a column that contains alphanumeric data.

2.   Click the arrow         in the column header.

3.   Do one of the following:

             Select from a list of text values

        1.   Click Filter.

        2.   In the list of text values, select or clear one or more text values to filter by.

     The list of text values can be up to 1,000 items. If the list is large, clear(Select All) at the top, and then
     select the specific text values to filter by.

             Create criteria

        1.   Point to Text Filters and then click one of the comparison operator commands, or click Custom
             Filter.
     For example, to filter by text that begins with a specific character, select Begins With, or to filter by text
     that has specific characters anywhere in the text, select Contains.

        2.   In the Custom Filter dialog box, in the box on the right, enter text.

     For example, to filter by text that begins with the letter "J", enter J, or to filter by text that has "bell"
     anywhere in the text, enter bell.

     If you need to find text that shares some characters but not others, use a wildcard character.

     The following table describes the wildcard characters that you can use as comparison criteria for text
     filters.

     USE                                TO FIND
? (question mark)                  Any single character
                                        For example, sm?th finds "smith" and "smyth"


     * (asterisk)                       Any number of characters
                                        For example, *east finds "Northeast" and "Southeast"


     ~ (tilde) followed by ?, *, or ~   A question mark, asterisk, or tilde
                                        For example, fy06~?finds "fy06?"


     Filter numbers

1.   Locate a column that contains numeric data.

2.   Click the arrow         in the column header.

3.   Do one of the following:

             Select from a list of numbers

        1.   Click Filter.

        2.   In the list of numbers, select or clear one or more numbers to filter by.

     The list of numbers can be up to 1,000 items. If the list is large, clear(Select All) at the top, and then select
     the specific numbers to filter by.

             Create criteria

        1.   Point to Number Filters and then click one of the comparison operator commands or
            click Custom Filter.
     For example, to filter by a lower and upper number limit, select Between.

        2.   In the Custom AutoFilter dialog box, in the box or boxes on the right, enter a number or numbers.

     For example, to filter by a lower number of "25" and an upper number of "50", enter 25 and 50.


     Filter dates or times

1.   Locate a column that contains dates or times.

2.   Click the arrow         in the column header.

3.   Do one of the following:

             Select from a list of dates or times

        1.   Click Filter.

        2.   In the list of dates or times, select or clear one or more dates or times to filter by.


     ©2009 Microsoft Corporation.
By default, the filter process groups all of the dates in the range in a hierarchy of years, months, and days.
When you select or clear a level in the hierarchy, the filter automatically selects or clears all of the dates
that are nested below that level. For example, if you select “2006”, the Web viewer shows months below
“2006”, and then lists the days below the name of each month.

The list of values can be up to 1,000 items. If the list of values is large, clear (Select All) at the top, and
then select the values to filter by.

           Create criteria

           Point to Date Filters and then do one of the following:

Common filter

A common filter is one based on a comparison operator. To use a common filter, follow this procedure:
      1.    Click one of the comparison operator commands (Equals,Before, After, or Between) or
            click Custom Filter.

      2.    In the Custom Filter dialog box, in the box on the right, enter a date or time.

For example, to filter by a lower and upper date or time, selectBetween.

      3.    In the Custom Filter dialog box, in the box or boxes on the right, enter a date or time.

For example, to filter by an earlier date of "3/1/2006" and a later date of "6/1/2006",
enter 3/1/2006 and 6/1/2006.

Dynamic filter

A dynamic filter is one where the criteria can change when you reapply the filter. To use a dynamic filter,
click one of the predefined date commands.

For example, on the All Dates in the Period menu, to filter all dates by the current date, select Today, or
to filter all dates by the following month, select Next Month.

    NOTES
.

            The commands under the All Dates in the Period menu, such asJanuary or Quarter 2, filter by
            the period no matter what the year is. This can be useful, for example, to compare sales by a
            period across several years.
            The filter options This Year and Year to Date handle future dates in a different way. This
            Year can return dates in the future for the current year, whereas Year to Date returns only dates
            up to and including the current date.


©2009 Microsoft Corporation.
Filter for top or bottom numbers

1.    Locate a column that contains numeric data.

2.    Click the arrow      in the column header.

3.    Point to Number Filters and then select Top 10.

4.    In the Top 10 Filter dialog box, do the following.

     1.   In the box on the left, click Top or Bottom. The filter determines the top and bottom values based on
          the original range of cells. It does not use the filtered subset of data.

     2.   In the box in the middle, enter a number from 1 to 255 for Items or 0.00 to 100.00 for Percent.

     3.   In the box on the right, do one of the following:

          To filter by number, click Items.

          To filter by percentage, click Percent.


      Clear a filter for a column


      To clear the filter for a column, click the Filter button     on the column heading, and then click Clear
      Filter from <Name>.


      Learn about possible issues with filtering data

      The following are issues that you should be aware of that either limit filtering or prevent filtering.

      Avoid mixing storage formats            For best results, the workbook author should not mix formats, such as
      text and number or number and date, in the same column because only one type of filter command is
      available for each column. If there is a mix of formats, the filter dialog box displays the format that occurs
      most frequently. For example, if the column contains three values stored as number and four as text, the
      filter process displays Text Filters.

      There may be more filtered rows than the limit of the maximum number of rows displayed                   If the
      number of rows that match the filter exceeds the maximum number of rows displayed in the workbook,
      and then the Web-based viewer displays the first set of filtered rows up to the current maximum number.
      To see all of the filtered rows, you may need to page to the next scrolling region. If the workbook is in an
      Excel Web Access Web Part, it might be possible to increase the number of rows that the Web Part
      displays.

      Nonprinting characters can prevent filtering           The Web-based viewer cannot filter data in a column
      that contains characters with an ANSI value of 0 to 32, which are nonprinting characters. In an Excel
      workbook, these characters display a rectangular box as a placeholder character. To filter data, the
      workbook author must remove these nonprinting characters or replace them with a printing character.


      ©2009 Microsoft Corporation.
Calculated members in PivotTable reports         You cannot apply a filter that combines a calculated
member (indicated by a blue color) with any other item, including other calculated members. To use a
filter with a calculated member, make sure that you select only one calculated member. If you are
selecting two or more items, remove any calculated members.

PivotTable metadata may be visible        If you are a workbook author and you publish a workbook
containing an OLAP PivotTable report with filtering applied, it's possible for a user to see the metadata of
a hidden field. If you want to keep this information confidential, do not enable filtering.


©2009 Microsoft Corporation.

Contenu connexe

Tendances

Getting started with_microsoft_excel
Getting started with_microsoft_excelGetting started with_microsoft_excel
Getting started with_microsoft_excel
Pratiksha Mhatre
 

Tendances (18)

Microsoft Excel Presentation
Microsoft Excel PresentationMicrosoft Excel Presentation
Microsoft Excel Presentation
 
Whatsapp survery report
Whatsapp survery  reportWhatsapp survery  report
Whatsapp survery report
 
Ms excel
Ms excelMs excel
Ms excel
 
Presentation Excel
Presentation ExcelPresentation Excel
Presentation Excel
 
Libre Office Calc Lesson 4: Understanding Functions
Libre Office Calc Lesson 4: Understanding FunctionsLibre Office Calc Lesson 4: Understanding Functions
Libre Office Calc Lesson 4: Understanding Functions
 
Ms excel basic about Data, graph and pivot table
Ms excel basic about Data, graph and pivot table Ms excel basic about Data, graph and pivot table
Ms excel basic about Data, graph and pivot table
 
Excelpresentationdatavalidation
ExcelpresentationdatavalidationExcelpresentationdatavalidation
Excelpresentationdatavalidation
 
Chapter.06
Chapter.06Chapter.06
Chapter.06
 
Create List Relationships by Using Unique and Lookup Columns - SharePoint 201...
Create List Relationships by Using Unique and Lookup Columns - SharePoint 201...Create List Relationships by Using Unique and Lookup Columns - SharePoint 201...
Create List Relationships by Using Unique and Lookup Columns - SharePoint 201...
 
Ms Excel Tutorials
Ms Excel TutorialsMs Excel Tutorials
Ms Excel Tutorials
 
MS EXCEL 2007
MS EXCEL 2007MS EXCEL 2007
MS EXCEL 2007
 
Libre Office Calc Lesson 5: Working with Data
Libre Office Calc Lesson 5: Working with DataLibre Office Calc Lesson 5: Working with Data
Libre Office Calc Lesson 5: Working with Data
 
Access2
Access2Access2
Access2
 
Getting started with_microsoft_excel
Getting started with_microsoft_excelGetting started with_microsoft_excel
Getting started with_microsoft_excel
 
Excel lesson 01
Excel lesson 01Excel lesson 01
Excel lesson 01
 
MS Excel
MS ExcelMS Excel
MS Excel
 
Libre office calc
Libre office calcLibre office calc
Libre office calc
 
Easy Pivot Tutorial June 2020
Easy Pivot Tutorial June 2020Easy Pivot Tutorial June 2020
Easy Pivot Tutorial June 2020
 

Similaire à Filter Data in Excel Services SharePoint 2010 - EPC Group

Focusing on specific data by using filterss
Focusing on specific data by using filterssFocusing on specific data by using filterss
Focusing on specific data by using filterss
um5ashm
 
Iipm chapter 3
Iipm chapter 3Iipm chapter 3
Iipm chapter 3
iipmff2
 
Microsoft excel training
Microsoft excel trainingMicrosoft excel training
Microsoft excel training
Mohamed Hassan
 
Summarize Data Using a Formula
Summarize Data Using a FormulaSummarize Data Using a Formula
Summarize Data Using a Formula
coachhahn
 

Similaire à Filter Data in Excel Services SharePoint 2010 - EPC Group (20)

Focusing on specific data by using filterss
Focusing on specific data by using filterssFocusing on specific data by using filterss
Focusing on specific data by using filterss
 
Microsoft Office Excel 2003 Sorting And Filtering
Microsoft Office Excel 2003 Sorting And FilteringMicrosoft Office Excel 2003 Sorting And Filtering
Microsoft Office Excel 2003 Sorting And Filtering
 
Naval PPT.pptx
Naval PPT.pptxNaval PPT.pptx
Naval PPT.pptx
 
Iipm chapter 3
Iipm chapter 3Iipm chapter 3
Iipm chapter 3
 
Microsoft excel training
Microsoft excel trainingMicrosoft excel training
Microsoft excel training
 
Summarize Data Using a Formula
Summarize Data Using a FormulaSummarize Data Using a Formula
Summarize Data Using a Formula
 
Excel database
Excel databaseExcel database
Excel database
 
MS Access 2010 tutorial 5
MS Access 2010 tutorial 5MS Access 2010 tutorial 5
MS Access 2010 tutorial 5
 
Fill series. Data validation. Excel Tutorial
Fill series. Data validation. Excel TutorialFill series. Data validation. Excel Tutorial
Fill series. Data validation. Excel Tutorial
 
Access2
Access2Access2
Access2
 
Advanced Filter Concepts in MS-Excel
Advanced Filter Concepts in MS-ExcelAdvanced Filter Concepts in MS-Excel
Advanced Filter Concepts in MS-Excel
 
Access 2007 lecture notes students
Access 2007 lecture notes studentsAccess 2007 lecture notes students
Access 2007 lecture notes students
 
Microsoft Excel- basics
Microsoft Excel-  basicsMicrosoft Excel-  basics
Microsoft Excel- basics
 
06.sorting and filling
06.sorting and filling06.sorting and filling
06.sorting and filling
 
Uses & applications of microsoft excel in vph research
Uses & applications of microsoft excel in vph researchUses & applications of microsoft excel in vph research
Uses & applications of microsoft excel in vph research
 
MS Excel 2013
MS Excel 2013MS Excel 2013
MS Excel 2013
 
Print10
Print10Print10
Print10
 
Libre Office Calc Lesson 2: Formatting and Charts
Libre Office Calc Lesson 2: Formatting and ChartsLibre Office Calc Lesson 2: Formatting and Charts
Libre Office Calc Lesson 2: Formatting and Charts
 
12045217.ppt
12045217.ppt12045217.ppt
12045217.ppt
 
How to Filter in Excel
How to Filter in ExcelHow to Filter in Excel
How to Filter in Excel
 

Plus de EPC Group

Windows Server 2012 Deep-Dive - EPC Group
Windows Server 2012 Deep-Dive - EPC GroupWindows Server 2012 Deep-Dive - EPC Group
Windows Server 2012 Deep-Dive - EPC Group
EPC Group
 
Understanding Windows Azure’s Active Directory (AD) and PowerShell Tools
Understanding Windows Azure’s Active Directory (AD) and PowerShell ToolsUnderstanding Windows Azure’s Active Directory (AD) and PowerShell Tools
Understanding Windows Azure’s Active Directory (AD) and PowerShell Tools
EPC Group
 
PowerShell with SharePoint 2013 and Office 365 - EPC Group
PowerShell with SharePoint 2013 and Office 365 - EPC GroupPowerShell with SharePoint 2013 and Office 365 - EPC Group
PowerShell with SharePoint 2013 and Office 365 - EPC Group
EPC Group
 

Plus de EPC Group (20)

Power BI vs Tableau - An Overview from EPC Group.pptx
Power BI vs Tableau - An Overview from EPC Group.pptxPower BI vs Tableau - An Overview from EPC Group.pptx
Power BI vs Tableau - An Overview from EPC Group.pptx
 
EPC Group Intune Practice and Capabilities Overview
EPC Group Intune Practice and Capabilities OverviewEPC Group Intune Practice and Capabilities Overview
EPC Group Intune Practice and Capabilities Overview
 
Pop the Hood on Microsoft Teams - EPC Group
Pop the Hood on Microsoft Teams - EPC GroupPop the Hood on Microsoft Teams - EPC Group
Pop the Hood on Microsoft Teams - EPC Group
 
Windows Server 2012 Deep-Dive - EPC Group
Windows Server 2012 Deep-Dive - EPC GroupWindows Server 2012 Deep-Dive - EPC Group
Windows Server 2012 Deep-Dive - EPC Group
 
Understanding Windows Azure’s Active Directory (AD) and PowerShell Tools
Understanding Windows Azure’s Active Directory (AD) and PowerShell ToolsUnderstanding Windows Azure’s Active Directory (AD) and PowerShell Tools
Understanding Windows Azure’s Active Directory (AD) and PowerShell Tools
 
PowerShell with SharePoint 2013 and Office 365 - EPC Group
PowerShell with SharePoint 2013 and Office 365 - EPC GroupPowerShell with SharePoint 2013 and Office 365 - EPC Group
PowerShell with SharePoint 2013 and Office 365 - EPC Group
 
Understanding Office 365’s Identity Solutions: Deep Dive - EPC Group
Understanding Office 365’s Identity Solutions: Deep Dive - EPC GroupUnderstanding Office 365’s Identity Solutions: Deep Dive - EPC Group
Understanding Office 365’s Identity Solutions: Deep Dive - EPC Group
 
System Center 2012 SP1 - Overview - EPC Group
System Center 2012 SP1 - Overview - EPC GroupSystem Center 2012 SP1 - Overview - EPC Group
System Center 2012 SP1 - Overview - EPC Group
 
Windows Azure Pack Enabling Virtual Machines - IaaS & Virtual Machine Role - ...
Windows Azure Pack Enabling Virtual Machines - IaaS & Virtual Machine Role - ...Windows Azure Pack Enabling Virtual Machines - IaaS & Virtual Machine Role - ...
Windows Azure Pack Enabling Virtual Machines - IaaS & Virtual Machine Role - ...
 
Lync 2013 - Audio - Quick Reference - 2 Page Reference - EPC Group
Lync 2013 - Audio - Quick Reference - 2 Page Reference - EPC GroupLync 2013 - Audio - Quick Reference - 2 Page Reference - EPC Group
Lync 2013 - Audio - Quick Reference - 2 Page Reference - EPC Group
 
Lync 2013 - Sharing and Collaboration - Quick Reference 2 Pager
Lync 2013 - Sharing and Collaboration - Quick Reference 2 PagerLync 2013 - Sharing and Collaboration - Quick Reference 2 Pager
Lync 2013 - Sharing and Collaboration - Quick Reference 2 Pager
 
Windows Server 2012 Deep-Dive - EPC Group
Windows Server 2012 Deep-Dive - EPC GroupWindows Server 2012 Deep-Dive - EPC Group
Windows Server 2012 Deep-Dive - EPC Group
 
Hyper-V’s Virtualization Enhancements - EPC Group
Hyper-V’s Virtualization Enhancements - EPC GroupHyper-V’s Virtualization Enhancements - EPC Group
Hyper-V’s Virtualization Enhancements - EPC Group
 
High Level Overview of Windows Azure - EPC Group
High Level Overview of Windows Azure - EPC GroupHigh Level Overview of Windows Azure - EPC Group
High Level Overview of Windows Azure - EPC Group
 
SharePoint 2013 and Office 365 External Sharing
SharePoint 2013 and Office 365 External SharingSharePoint 2013 and Office 365 External Sharing
SharePoint 2013 and Office 365 External Sharing
 
BizTalk Server 2010 - Invoking Restful Services - EPC Group
BizTalk Server 2010 - Invoking Restful Services - EPC GroupBizTalk Server 2010 - Invoking Restful Services - EPC Group
BizTalk Server 2010 - Invoking Restful Services - EPC Group
 
BizTalk Sever 2010 - Basic Principles of Maps - EPC Group
BizTalk Sever 2010 - Basic Principles of Maps - EPC GroupBizTalk Sever 2010 - Basic Principles of Maps - EPC Group
BizTalk Sever 2010 - Basic Principles of Maps - EPC Group
 
EPC Group and Continental Airlines ECM Case Study - SharePoint 2007 Global Study
EPC Group and Continental Airlines ECM Case Study - SharePoint 2007 Global StudyEPC Group and Continental Airlines ECM Case Study - SharePoint 2007 Global Study
EPC Group and Continental Airlines ECM Case Study - SharePoint 2007 Global Study
 
Driving End User Adoption in SharePoint 2013 & 2010 - EPC Group
Driving End User Adoption in SharePoint 2013 & 2010 - EPC GroupDriving End User Adoption in SharePoint 2013 & 2010 - EPC Group
Driving End User Adoption in SharePoint 2013 & 2010 - EPC Group
 
Join EPC Group's Monthly Newsletter
Join EPC Group's Monthly NewsletterJoin EPC Group's Monthly Newsletter
Join EPC Group's Monthly Newsletter
 

Dernier

Architecting Cloud Native Applications
Architecting Cloud Native ApplicationsArchitecting Cloud Native Applications
Architecting Cloud Native Applications
WSO2
 
+971581248768>> SAFE AND ORIGINAL ABORTION PILLS FOR SALE IN DUBAI AND ABUDHA...
+971581248768>> SAFE AND ORIGINAL ABORTION PILLS FOR SALE IN DUBAI AND ABUDHA...+971581248768>> SAFE AND ORIGINAL ABORTION PILLS FOR SALE IN DUBAI AND ABUDHA...
+971581248768>> SAFE AND ORIGINAL ABORTION PILLS FOR SALE IN DUBAI AND ABUDHA...
?#DUbAI#??##{{(☎️+971_581248768%)**%*]'#abortion pills for sale in dubai@
 
Cloud Frontiers: A Deep Dive into Serverless Spatial Data and FME
Cloud Frontiers:  A Deep Dive into Serverless Spatial Data and FMECloud Frontiers:  A Deep Dive into Serverless Spatial Data and FME
Cloud Frontiers: A Deep Dive into Serverless Spatial Data and FME
Safe Software
 

Dernier (20)

DBX First Quarter 2024 Investor Presentation
DBX First Quarter 2024 Investor PresentationDBX First Quarter 2024 Investor Presentation
DBX First Quarter 2024 Investor Presentation
 
Apidays New York 2024 - The value of a flexible API Management solution for O...
Apidays New York 2024 - The value of a flexible API Management solution for O...Apidays New York 2024 - The value of a flexible API Management solution for O...
Apidays New York 2024 - The value of a flexible API Management solution for O...
 
Apidays New York 2024 - APIs in 2030: The Risk of Technological Sleepwalk by ...
Apidays New York 2024 - APIs in 2030: The Risk of Technological Sleepwalk by ...Apidays New York 2024 - APIs in 2030: The Risk of Technological Sleepwalk by ...
Apidays New York 2024 - APIs in 2030: The Risk of Technological Sleepwalk by ...
 
TrustArc Webinar - Unlock the Power of AI-Driven Data Discovery
TrustArc Webinar - Unlock the Power of AI-Driven Data DiscoveryTrustArc Webinar - Unlock the Power of AI-Driven Data Discovery
TrustArc Webinar - Unlock the Power of AI-Driven Data Discovery
 
MS Copilot expands with MS Graph connectors
MS Copilot expands with MS Graph connectorsMS Copilot expands with MS Graph connectors
MS Copilot expands with MS Graph connectors
 
Architecting Cloud Native Applications
Architecting Cloud Native ApplicationsArchitecting Cloud Native Applications
Architecting Cloud Native Applications
 
Web Form Automation for Bonterra Impact Management (fka Social Solutions Apri...
Web Form Automation for Bonterra Impact Management (fka Social Solutions Apri...Web Form Automation for Bonterra Impact Management (fka Social Solutions Apri...
Web Form Automation for Bonterra Impact Management (fka Social Solutions Apri...
 
Apidays New York 2024 - Passkeys: Developing APIs to enable passwordless auth...
Apidays New York 2024 - Passkeys: Developing APIs to enable passwordless auth...Apidays New York 2024 - Passkeys: Developing APIs to enable passwordless auth...
Apidays New York 2024 - Passkeys: Developing APIs to enable passwordless auth...
 
Vector Search -An Introduction in Oracle Database 23ai.pptx
Vector Search -An Introduction in Oracle Database 23ai.pptxVector Search -An Introduction in Oracle Database 23ai.pptx
Vector Search -An Introduction in Oracle Database 23ai.pptx
 
Repurposing LNG terminals for Hydrogen Ammonia: Feasibility and Cost Saving
Repurposing LNG terminals for Hydrogen Ammonia: Feasibility and Cost SavingRepurposing LNG terminals for Hydrogen Ammonia: Feasibility and Cost Saving
Repurposing LNG terminals for Hydrogen Ammonia: Feasibility and Cost Saving
 
[BuildWithAI] Introduction to Gemini.pdf
[BuildWithAI] Introduction to Gemini.pdf[BuildWithAI] Introduction to Gemini.pdf
[BuildWithAI] Introduction to Gemini.pdf
 
Rising Above_ Dubai Floods and the Fortitude of Dubai International Airport.pdf
Rising Above_ Dubai Floods and the Fortitude of Dubai International Airport.pdfRising Above_ Dubai Floods and the Fortitude of Dubai International Airport.pdf
Rising Above_ Dubai Floods and the Fortitude of Dubai International Airport.pdf
 
How to Troubleshoot Apps for the Modern Connected Worker
How to Troubleshoot Apps for the Modern Connected WorkerHow to Troubleshoot Apps for the Modern Connected Worker
How to Troubleshoot Apps for the Modern Connected Worker
 
Navigating the Deluge_ Dubai Floods and the Resilience of Dubai International...
Navigating the Deluge_ Dubai Floods and the Resilience of Dubai International...Navigating the Deluge_ Dubai Floods and the Resilience of Dubai International...
Navigating the Deluge_ Dubai Floods and the Resilience of Dubai International...
 
Artificial Intelligence Chap.5 : Uncertainty
Artificial Intelligence Chap.5 : UncertaintyArtificial Intelligence Chap.5 : Uncertainty
Artificial Intelligence Chap.5 : Uncertainty
 
+971581248768>> SAFE AND ORIGINAL ABORTION PILLS FOR SALE IN DUBAI AND ABUDHA...
+971581248768>> SAFE AND ORIGINAL ABORTION PILLS FOR SALE IN DUBAI AND ABUDHA...+971581248768>> SAFE AND ORIGINAL ABORTION PILLS FOR SALE IN DUBAI AND ABUDHA...
+971581248768>> SAFE AND ORIGINAL ABORTION PILLS FOR SALE IN DUBAI AND ABUDHA...
 
Six Myths about Ontologies: The Basics of Formal Ontology
Six Myths about Ontologies: The Basics of Formal OntologySix Myths about Ontologies: The Basics of Formal Ontology
Six Myths about Ontologies: The Basics of Formal Ontology
 
Strategies for Landing an Oracle DBA Job as a Fresher
Strategies for Landing an Oracle DBA Job as a FresherStrategies for Landing an Oracle DBA Job as a Fresher
Strategies for Landing an Oracle DBA Job as a Fresher
 
Apidays New York 2024 - The Good, the Bad and the Governed by David O'Neill, ...
Apidays New York 2024 - The Good, the Bad and the Governed by David O'Neill, ...Apidays New York 2024 - The Good, the Bad and the Governed by David O'Neill, ...
Apidays New York 2024 - The Good, the Bad and the Governed by David O'Neill, ...
 
Cloud Frontiers: A Deep Dive into Serverless Spatial Data and FME
Cloud Frontiers:  A Deep Dive into Serverless Spatial Data and FMECloud Frontiers:  A Deep Dive into Serverless Spatial Data and FME
Cloud Frontiers: A Deep Dive into Serverless Spatial Data and FME
 

Filter Data in Excel Services SharePoint 2010 - EPC Group

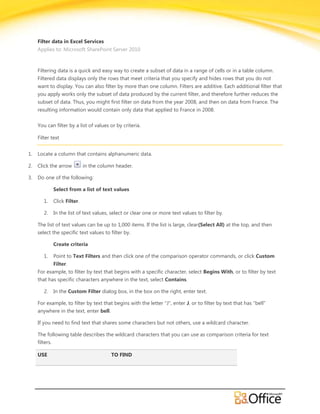
  • 1. Filter data in Excel Services Applies to: Microsoft SharePoint Server 2010 Filtering data is a quick and easy way to create a subset of data in a range of cells or in a table column. Filtered data displays only the rows that meet criteria that you specify and hides rows that you do not want to display. You can also filter by more than one column. Filters are additive. Each additional filter that you apply works only the subset of data produced by the current filter, and therefore further reduces the subset of data. Thus, you might first filter on data from the year 2008, and then on data from France. The resulting information would contain only data that applied to France in 2008. You can filter by a list of values or by criteria. Filter text 1. Locate a column that contains alphanumeric data. 2. Click the arrow in the column header. 3. Do one of the following: Select from a list of text values 1. Click Filter. 2. In the list of text values, select or clear one or more text values to filter by. The list of text values can be up to 1,000 items. If the list is large, clear(Select All) at the top, and then select the specific text values to filter by. Create criteria 1. Point to Text Filters and then click one of the comparison operator commands, or click Custom Filter. For example, to filter by text that begins with a specific character, select Begins With, or to filter by text that has specific characters anywhere in the text, select Contains. 2. In the Custom Filter dialog box, in the box on the right, enter text. For example, to filter by text that begins with the letter "J", enter J, or to filter by text that has "bell" anywhere in the text, enter bell. If you need to find text that shares some characters but not others, use a wildcard character. The following table describes the wildcard characters that you can use as comparison criteria for text filters. USE TO FIND
  • 2. ? (question mark) Any single character For example, sm?th finds "smith" and "smyth" * (asterisk) Any number of characters For example, *east finds "Northeast" and "Southeast" ~ (tilde) followed by ?, *, or ~ A question mark, asterisk, or tilde For example, fy06~?finds "fy06?" Filter numbers 1. Locate a column that contains numeric data. 2. Click the arrow in the column header. 3. Do one of the following: Select from a list of numbers 1. Click Filter. 2. In the list of numbers, select or clear one or more numbers to filter by. The list of numbers can be up to 1,000 items. If the list is large, clear(Select All) at the top, and then select the specific numbers to filter by. Create criteria 1. Point to Number Filters and then click one of the comparison operator commands or click Custom Filter. For example, to filter by a lower and upper number limit, select Between. 2. In the Custom AutoFilter dialog box, in the box or boxes on the right, enter a number or numbers. For example, to filter by a lower number of "25" and an upper number of "50", enter 25 and 50. Filter dates or times 1. Locate a column that contains dates or times. 2. Click the arrow in the column header. 3. Do one of the following: Select from a list of dates or times 1. Click Filter. 2. In the list of dates or times, select or clear one or more dates or times to filter by. ©2009 Microsoft Corporation.
  • 3. By default, the filter process groups all of the dates in the range in a hierarchy of years, months, and days. When you select or clear a level in the hierarchy, the filter automatically selects or clears all of the dates that are nested below that level. For example, if you select “2006”, the Web viewer shows months below “2006”, and then lists the days below the name of each month. The list of values can be up to 1,000 items. If the list of values is large, clear (Select All) at the top, and then select the values to filter by. Create criteria Point to Date Filters and then do one of the following: Common filter A common filter is one based on a comparison operator. To use a common filter, follow this procedure: 1. Click one of the comparison operator commands (Equals,Before, After, or Between) or click Custom Filter. 2. In the Custom Filter dialog box, in the box on the right, enter a date or time. For example, to filter by a lower and upper date or time, selectBetween. 3. In the Custom Filter dialog box, in the box or boxes on the right, enter a date or time. For example, to filter by an earlier date of "3/1/2006" and a later date of "6/1/2006", enter 3/1/2006 and 6/1/2006. Dynamic filter A dynamic filter is one where the criteria can change when you reapply the filter. To use a dynamic filter, click one of the predefined date commands. For example, on the All Dates in the Period menu, to filter all dates by the current date, select Today, or to filter all dates by the following month, select Next Month. NOTES . The commands under the All Dates in the Period menu, such asJanuary or Quarter 2, filter by the period no matter what the year is. This can be useful, for example, to compare sales by a period across several years. The filter options This Year and Year to Date handle future dates in a different way. This Year can return dates in the future for the current year, whereas Year to Date returns only dates up to and including the current date. ©2009 Microsoft Corporation.
  • 4. Filter for top or bottom numbers 1. Locate a column that contains numeric data. 2. Click the arrow in the column header. 3. Point to Number Filters and then select Top 10. 4. In the Top 10 Filter dialog box, do the following. 1. In the box on the left, click Top or Bottom. The filter determines the top and bottom values based on the original range of cells. It does not use the filtered subset of data. 2. In the box in the middle, enter a number from 1 to 255 for Items or 0.00 to 100.00 for Percent. 3. In the box on the right, do one of the following: To filter by number, click Items. To filter by percentage, click Percent. Clear a filter for a column To clear the filter for a column, click the Filter button on the column heading, and then click Clear Filter from <Name>. Learn about possible issues with filtering data The following are issues that you should be aware of that either limit filtering or prevent filtering. Avoid mixing storage formats For best results, the workbook author should not mix formats, such as text and number or number and date, in the same column because only one type of filter command is available for each column. If there is a mix of formats, the filter dialog box displays the format that occurs most frequently. For example, if the column contains three values stored as number and four as text, the filter process displays Text Filters. There may be more filtered rows than the limit of the maximum number of rows displayed If the number of rows that match the filter exceeds the maximum number of rows displayed in the workbook, and then the Web-based viewer displays the first set of filtered rows up to the current maximum number. To see all of the filtered rows, you may need to page to the next scrolling region. If the workbook is in an Excel Web Access Web Part, it might be possible to increase the number of rows that the Web Part displays. Nonprinting characters can prevent filtering The Web-based viewer cannot filter data in a column that contains characters with an ANSI value of 0 to 32, which are nonprinting characters. In an Excel workbook, these characters display a rectangular box as a placeholder character. To filter data, the workbook author must remove these nonprinting characters or replace them with a printing character. ©2009 Microsoft Corporation.
  • 5. Calculated members in PivotTable reports You cannot apply a filter that combines a calculated member (indicated by a blue color) with any other item, including other calculated members. To use a filter with a calculated member, make sure that you select only one calculated member. If you are selecting two or more items, remove any calculated members. PivotTable metadata may be visible If you are a workbook author and you publish a workbook containing an OLAP PivotTable report with filtering applied, it's possible for a user to see the metadata of a hidden field. If you want to keep this information confidential, do not enable filtering. ©2009 Microsoft Corporation.