SlideShare une entreprise Scribd logo
1  sur  7
Getting started with SharePoint status indicators
Applies to: Microsoft SharePoint Server 2010


A status indicator is a one-line report. At a glance, a status indicator shows how actual performance for a
particular measure compares to a goal. A good status indicator lets you know, without requiring
calculations, if results are on target or off target.

A status indicator shows the indicator name, its numeric results, and an icon. Notice how the icon provides
quick information. Typically, green icons indicate good performance, Red icons flag problem areas, and
yellow icons warn of potential problems. This illustration shows just two indicators: one displays a green
circle icon to indicate performance is on target, and one shows a yellow triangle to warn about marginal
performance.


Overview – How do I create status indicators?


A status indicator is an item in a Status List, which is a special form of a SharePoint list. You can create a
Status List in two ways:

Create just a Status List. After you create a Status List, you just add indicators to the list. In addition, you
can customize a Status List by adding or modifying columns in the list. For example, you might add a
column that shows the contact person for each indicator, or a column that shows the data source. Then,
you just add the indicators to the list that you created.
Create a Web Part with Status List. This is a Web Part that builds in a Status List automatically, so that all
you need to do is add indicators. Then, you can easily use the Web Part on a dashboard or other Web
page.

When you add an indicator, you give it a title and specify the data source for the indicator. You also set
the values that determine what icon SharePoint Server 2010 displays to indicate status. For example, you
might want an icon that displays a green circle when the actual value of the measure meets or exceeds
the goal, and displays a red triangle when values fall below a certain point.


Create a Status List

You can create a Status List in the Business Intelligence Center in a team or organization site, so that
other people easily can find them. Then, you can add one or more status indicators to the newly created
list. To increase flexibility about what the list displays, you can create one or more customized views of
      a Status List.

      To create a new Status List, take these steps:

1.    In the site where you want to create the Status List, click Site Actions, and then select View All Site
      Content. Under the All Site Content heading, click Create.

2.    On the Create page, in the Filter By: panel, click List. Then, in the main panel, click the Status List icon.

3.    Type a name for the Status List.

4.    (Optional) To enter a description, or to choose to have the list name appear in the Quick Launch panel,
      click More Options. Then, configure the options that you prefer.

5.    Click Create to finish creating the Status List. SharePoint Server 2010 opens the new Status List in edit
      mode so that you can add one or more status indicators.


      Create a Web Part with Status List

      You can create a special Web Part that displays a pre-defined view of a Status List. You can add indicators
      directly to this Web Part, and then use the Web Part on any page in your site.

      To create a new Web Part with Status List, take these steps:

     1.   In the site where you want to create the Web Part with Status List, in the Quick Launch panel of the
          default page of the Business Intelligence Center, click Dashboards,

     2.   On the Dashboard: All Items page, click the Documents tab in the Library Tools group.

     3.   Click New Document, and then select Web Part Page with Status List to open the property page for
          a new Web Part.

     4.   On the property page for the new Web Part with Status List, in the Page Name section, enter a name
          and description for the new page. If desired, you can also enter a Page Title, which will appear as a
          banner title on the new Web Part page.

     5.   In the Location section, select the Documents Library and Folder that will contain the new Web Part
          page from the matching drop down lists.

     6.   (Optional) In the Create Link in Current Navigation Bar section, decide whether you want to create a
          link from this page to the navigation bar.

     7.   In the Web part page with status list layout section, select a layout from the Layout list.

     8.   In the Status Indicators section, check the radio button next to Create a status indicator list for me
          automatically. Alternatively, you can decide to select an existing list at a later time.

     9.   Click OK to close the property page and open the new Web Part page.


      ©2009 Microsoft Corporation.
You can customize the Web Part Page with Status List. For example, you can change the type of icon
     that SharePoint uses to display the status of the indicator, you can create a display title for it, or you can
     specify the size of the Web Part. To learn how to do this, see links in the See Also section.

     You are now ready to add a status indicator to the Status List in the newly created Web Part.

     Add a status indicator to a Status List

     The steps in this procedure assume that you have selected a previously created Status List, and that the
     list is in Edit mode, or that you have just created a new Status List. When you create a new list,
     SharePoint Server 2010 automatically opens the list in Edit mode.

1.   On the Status List toolbar, click the arrow next to New.

2.   Select an indicator type from the drop-down menu, depending on the data source for the indicator to
     open a property page for the new indicator.

3.   The following table contains a list of available indicator types and a short description of each type. To
     learn how to specify properties for a specific indicator type, click on the name of the indicator type.


     INDICATOR TYPE                      DESCRIPTION


     SharePoint List based Status        Shows a value based on the contents of a SharePoint list.
     Indicator


     Excel based Status Indicator        Shows values directly imported from an Excel Services workbook. The
                                         value can be specified by a cell address in the workbook.


     SQL Server Analysis Services        Imports a selected Key Performance Indicator from a SQL Server
     based Status Indicator              Analysis Services cube


     Fixed value based Status            Shows values that are manually entered by the indicator author.
     Indicator


     SHAREPOINT LIST BASED STATUS INDICATOR
     SharePoint Server 2010 lists are great ways to track items. For example, you might create a list that shows
     the status of business contracts, and create a status indicator that reports the percentage of active
     contracts, or contracts that are complete. Lists can contain items that are part of a workflow, or report
     employee participation in training programs.

     You can use a status indicator to track how long the issues or tasks have been open, how many are open,
     and what percentage of a task is complete. You can also keep track of totals, such as the amount of time
     that an issue has been open or the total number of sales in a region.


     ©2009 Microsoft Corporation.
NOTE      Before you select this option, make sure the list that you want to use exists, and is in the view
 that you want to use...
 To create a new status indicator that is based on a SharePoint list, take these steps:

1.    On the New Item page, under SharePoint List and View, in the List URL box, enter the URL of the list
      or library.

       NOTE      The SharePoint list or library must be in the same site.
2.    In the View box, select the view that contains the items you want to use in the status indicator.

3.    Under Value Calculation, select the calculation method that you want to use to calculate the goal of
      the status indicator. The following table describes the calculation options.

 CALCULATION                 DESCRIPTION
 OPTION


 Number of list              A count of the total number of items in the list.
 items


 Percentage of list          This method calculates the percentage of items in the specified view that meet the
 items in the view           criteria that you select.
 where                       To select a criteria, take these steps:

                             Select the name of the column from the Select column…drop-down list.
                             Select the comparison operator from the is equal to drop-down list.
                             Type the value that you want to use for comparison in the text box.

                             To add criteria for up to five additional columns, repeat these steps.
 Calculation using all       This method calculates the value that you select, based on values in a specified
 list items in the           column. Select one of the following from the drop-down list: Sum, Average,
 view                        Maximum, or Minimum. Then, select the column that contains the values that
                             you want computed from the Select column… drop-down list


4.    In the Status Icon Rules section, do the following:

            From the Better values are drop down list, select higher to have SharePoint change Icons when
            increasing values meet or exceed goal or warning thresholds. Select lower to have SharePoint
            change Icons when decreasing values meet or exceed goal or warning thresholds.

            In the Display when value has met or exceeded goal box, type the goal value. When the
            indicator value reaches this goal, SharePoint changes the icon to show that performance is on
            target.
            In the Display when value has met or exceeded warning box, type the value at which
            performance is unacceptable, and SharePoint changes the icon to warn of a potential problem.


 ©2009 Microsoft Corporation.
5.   (Optional) In the Details Link section, in the Details Page box, type the URL of the page that provides
          more detailed information about this indicator, such as the source list for the indicator.

     6.   (Optional) in the Update Rules section, select the option that determines whether SharePoint Server
          2010 updates the indicator values each time a new user opens the list, or updates the indicator values
          when the user manually updates the values from a menu.


      EXCEL BASED STATUS INDICATOR
      You can base a status indicator on data in an Excel workbook that you save or publish to your SharePoint
      Server 2010 site. As the data in the workbook changes, SharePoint Server 2010 automatically updates the
      values in the status indicator. In addition, you can display the workbook on the same Web page.

      To create a new status indicator that is based on an Excel Services workbook, take these steps:

1.    On the New Item page, in the Name and Description boxes, type a name and optional description for
      the indicator.

2.    (Optional) In the Comments box, type any comments. For example, you might provide information to
      help people who are viewing the indicator understand what it represents.

3.    In the Indicator Value section, in the Workbook URL box, enter the URL of the Excel workbook that
      contains the data and calculations for the indicator. The Excel Services workbook must be saved in a
      SharePoint library that is in the same site.

4.    In the Cell Address for Indicator Value box, type the address of the cell that contains the actual value for
      the indicator. Alternatively, you can click the Browse button to browse the workbook that you specified
      by the URL in Step 3, and then select the cell that contains the values you want to use in the status
      indicator

5.    In the Status Icon Rules section, do the following:

              From the Better values are drop down list, select higher to have SharePoint change Icons when
              increasing values meet or exceed goal or warning thresholds. Select lower to have SharePoint
              change Icons when decreasing values meet or exceed goal or warning thresholds.

              In the Display when value has met or exceeded goal box, type the goal value. When the
              indicator value reaches this goal, SharePoint changes the icon to show that performance is on
              target.
              In the Display when value has met or exceeded warning box, type the value at which
              performance is unacceptable, and SharePoint changes the icon to warn of a potential problem.

     6.   (Optional) In the Details Link section, in the Details Page box, type the URL of the page that provides
          more detailed information about this indicator, such as the source list for the indicator.


      ©2009 Microsoft Corporation.
7.   (Optional) in the Update Rules section, select the option that determines whether SharePoint Server
     2010 updates the indicator values each time a new user opens the list, or updates the indicator values
     when the user manually updates the values from a menu.


 SQL SERVER ANALYSIS SERVICES BASED STATUS INDICATOR
 SharePoint Server 2010can import KPIs from SQL Server Analysis Services (SSAS), a component of SQL
 Server 2005 and SQL Server 2008. A systems administrator or database analyst usually sets up these KPIs
 and adds the data connection file to the Data Connection library on a Business Intelligence Center site.
 Then, anyone with the appropriate permissions can access the database and link to the Analysis Services
 KPIs

 SSAS enables analysts to define powerful and flexible KPIs that are based on multidimensional data.
 However, an SSAS KPI can be defined and managed only while working in SSAS. An analyst can use
 commands in SSAS to create and manage any KPI properties, such as the performance goal, the status
 icon, and the threshold values at which an icon changes color to indicate a change in performance status.

 You can change the display name of a KPI that you import to a Status List, but you cannot change any
 other properties of the KPI while working in SharePoint Server 2010.

 To import a KPI from SSAS, take these steps.

1.   On the New Item page, in the Data Connection box, enter the URL of the Microsoft Office data
     connection (.odc) file, or click the Browse button to open the Select an Asset dialog box, and navigate
     to the .odc file.

2.   In the Only display KPIs from display folder box, select the display folder in the Analysis Services
     database that contains the KPI.

3.   In the KPI List box, select the KPI you want, such as Total Revenue or Average Profit Margin.

4.   Select the Include child indicators check box to display all of the child indicators for the selected KPI.
     If the selected KPI has child indicators, the Status List displays the parent and child indicators in a
     hierarchy.
     The following illustration shows an imported KPI (Net Income) that has three child indicators
     (Operating Profit, Operating Expenses, and Financial Gross Margin).


5.   In the Name and Description boxes, type a name and description (optional) for the indicator.

6.   (Optional) In the Comments box, type any comments. For example, you might provide information to
     help people who are viewing the KPI understand what it represents.


 ©2009 Microsoft Corporation.
7.    (Optional) In the Details Link section, in the Details Page box, type the URL of the page that provides
           more detailed information about this indicator, such as the data source for the indicator.

     8.    (Optional) in the Update Rules section, select the option that determines whether SharePoint Server
           2010 updates the indicator values each time a new user opens the list, or updates the indicator values
           when the user manually updates the values from a menu.

          NOTE      The Status Icon Rules for an indicator that imports an Analysis Services KPI are preset by the
      database analyst...


      FIXED VALUE BASED STATUS INDICATOR
      In some situations, you might want to enter values manually for a status indicator. Perhaps the indicator is
      based on unstructured information such as e-mail, or you have a one-time project to track.

1.    On the New Item page, in the Name and Description boxes, type a name and optional description for
      the indicator.

2.    (Optional) In the Comments box, type any comments. For example, you might provide information to
      help people who are viewing the indicator understand what it represents.

3.    Type the numerical value of your progress so far.

4.    In the Status Icon Rules section, do the following:

                 From the Better values are drop down list, select higher to have SharePoint change Icons when
                 increasing values meet or exceed goal or warning thresholds. Select lower to have SharePoint
                 change Icons when decreasing values meet or exceed goal or warning thresholds.
                 In the Display when value has met or exceeded goal box, type the goal value. When the
                 indicator value reaches this goal, SharePoint changes the icon to show that performance is on
                 target.
                 In the Display when value has met or exceeded warning box, type the value at which
                 performance is unacceptable, and SharePoint changes the icon to warn of a potential problem.


      ©2009 Microsoft Corporation.

Contenu connexe

Tendances

Create an index and update an index in word
Create an index and update an index in wordCreate an index and update an index in word
Create an index and update an index in wordRaghu nath
 
How to Create Oracle Fusion BI Publisher Report Using RTF Template
How to Create Oracle Fusion BI Publisher Report Using RTF TemplateHow to Create Oracle Fusion BI Publisher Report Using RTF Template
How to Create Oracle Fusion BI Publisher Report Using RTF TemplateFeras Ahmad
 
D I T211 Chapter 8 ( Lab 5)
D I T211    Chapter 8 ( Lab 5)D I T211    Chapter 8 ( Lab 5)
D I T211 Chapter 8 ( Lab 5)askme
 
Excel PowerPoint
Excel PowerPointExcel PowerPoint
Excel PowerPointnhumar
 
Adding A New Field
Adding A New FieldAdding A New Field
Adding A New FieldEMAINT
 
Lesson 5 Basic Tutorial Data Analysis Software for Flow Cytometry
Lesson 5 Basic Tutorial Data Analysis Software for Flow CytometryLesson 5 Basic Tutorial Data Analysis Software for Flow Cytometry
Lesson 5 Basic Tutorial Data Analysis Software for Flow CytometryUttam Belbase
 
Unit C - CSCI 64
Unit C - CSCI 64Unit C - CSCI 64
Unit C - CSCI 64dpd
 
Access lesson05
Access lesson05Access lesson05
Access lesson05Aram SE
 
Access2007 part1
Access2007 part1Access2007 part1
Access2007 part1jigeno
 
MS Excel Training(Basic)
MS Excel Training(Basic)MS Excel Training(Basic)
MS Excel Training(Basic)vikash kumar
 
Microsoft Word 2013 Quickstart
Microsoft Word 2013 QuickstartMicrosoft Word 2013 Quickstart
Microsoft Word 2013 Quickstartcomatsg
 
Access lesson 04 Creating and Modifying Forms
Access lesson 04 Creating and Modifying FormsAccess lesson 04 Creating and Modifying Forms
Access lesson 04 Creating and Modifying FormsAram SE
 
Access lesson 01 Microsoft Access Basics
Access lesson 01 Microsoft Access BasicsAccess lesson 01 Microsoft Access Basics
Access lesson 01 Microsoft Access BasicsAram SE
 

Tendances (20)

Create an index and update an index in word
Create an index and update an index in wordCreate an index and update an index in word
Create an index and update an index in word
 
Ms excel 2007 pptx
Ms excel 2007 pptxMs excel 2007 pptx
Ms excel 2007 pptx
 
How to Create Oracle Fusion BI Publisher Report Using RTF Template
How to Create Oracle Fusion BI Publisher Report Using RTF TemplateHow to Create Oracle Fusion BI Publisher Report Using RTF Template
How to Create Oracle Fusion BI Publisher Report Using RTF Template
 
D I T211 Chapter 8 ( Lab 5)
D I T211    Chapter 8 ( Lab 5)D I T211    Chapter 8 ( Lab 5)
D I T211 Chapter 8 ( Lab 5)
 
Access 2007
Access 2007Access 2007
Access 2007
 
Excel PowerPoint
Excel PowerPointExcel PowerPoint
Excel PowerPoint
 
Access2007
Access2007Access2007
Access2007
 
Excel 2007 Unit C
Excel 2007 Unit CExcel 2007 Unit C
Excel 2007 Unit C
 
Adding A New Field
Adding A New FieldAdding A New Field
Adding A New Field
 
Lesson 5 Basic Tutorial Data Analysis Software for Flow Cytometry
Lesson 5 Basic Tutorial Data Analysis Software for Flow CytometryLesson 5 Basic Tutorial Data Analysis Software for Flow Cytometry
Lesson 5 Basic Tutorial Data Analysis Software for Flow Cytometry
 
Access 2007
Access 2007Access 2007
Access 2007
 
Unit C - CSCI 64
Unit C - CSCI 64Unit C - CSCI 64
Unit C - CSCI 64
 
Access lesson05
Access lesson05Access lesson05
Access lesson05
 
Web(chap2)
Web(chap2)Web(chap2)
Web(chap2)
 
Productivity tools
Productivity toolsProductivity tools
Productivity tools
 
Access2007 part1
Access2007 part1Access2007 part1
Access2007 part1
 
MS Excel Training(Basic)
MS Excel Training(Basic)MS Excel Training(Basic)
MS Excel Training(Basic)
 
Microsoft Word 2013 Quickstart
Microsoft Word 2013 QuickstartMicrosoft Word 2013 Quickstart
Microsoft Word 2013 Quickstart
 
Access lesson 04 Creating and Modifying Forms
Access lesson 04 Creating and Modifying FormsAccess lesson 04 Creating and Modifying Forms
Access lesson 04 Creating and Modifying Forms
 
Access lesson 01 Microsoft Access Basics
Access lesson 01 Microsoft Access BasicsAccess lesson 01 Microsoft Access Basics
Access lesson 01 Microsoft Access Basics
 

Similaire à Getting Started with SharePoint Status Indicators - EPC Group

How to Navigate PerformancePoint 2010 Dashboards and Explore Data - EPC Group
How to Navigate PerformancePoint 2010 Dashboards and Explore Data - EPC GroupHow to Navigate PerformancePoint 2010 Dashboards and Explore Data - EPC Group
How to Navigate PerformancePoint 2010 Dashboards and Explore Data - EPC GroupEPC Group
 
ETL Microsoft Material
ETL Microsoft MaterialETL Microsoft Material
ETL Microsoft MaterialAhmed Hashem
 
SharePoint Lists and Libraries Configuration
SharePoint Lists and Libraries ConfigurationSharePoint Lists and Libraries Configuration
SharePoint Lists and Libraries Configurationamitmathur31
 
SharePoint Lists and Document Libraries Configuration and Learning
SharePoint Lists and Document Libraries Configuration and LearningSharePoint Lists and Document Libraries Configuration and Learning
SharePoint Lists and Document Libraries Configuration and LearningGovind S Yadav
 
SharePoint Lists and Libraries Configuration
SharePoint Lists and Libraries ConfigurationSharePoint Lists and Libraries Configuration
SharePoint Lists and Libraries Configurationamitmathur31
 
SharePoint Lists and Libraries
SharePoint Lists and LibrariesSharePoint Lists and Libraries
SharePoint Lists and Librariesamitmathur31
 
SharePoint Lists and Libraries Configuration
SharePoint Lists and Libraries ConfigurationSharePoint Lists and Libraries Configuration
SharePoint Lists and Libraries ConfigurationGovind S Yadav
 
Share point ssis adapters 2011
Share point ssis adapters 2011Share point ssis adapters 2011
Share point ssis adapters 2011Krishna Na
 
Informatica power center
Informatica power centerInformatica power center
Informatica power centerSouravSRT
 
Project Web Access Quick Reference Guide For Team Members
Project Web Access Quick Reference Guide For Team MembersProject Web Access Quick Reference Guide For Team Members
Project Web Access Quick Reference Guide For Team MembersToney Sisk
 
Financial reporting rpd using obiee
Financial reporting rpd using obieeFinancial reporting rpd using obiee
Financial reporting rpd using obieeAmit Sharma
 
Financial reporting rpd using obiee
Financial reporting rpd using obieeFinancial reporting rpd using obiee
Financial reporting rpd using obieeAmit Sharma
 
Financial reporting rpd using obiee
Financial reporting rpd using obieeFinancial reporting rpd using obiee
Financial reporting rpd using obieeAmit Sharma
 
2580 microsoft excel2010_rtm_wsg_external
2580 microsoft excel2010_rtm_wsg_external2580 microsoft excel2010_rtm_wsg_external
2580 microsoft excel2010_rtm_wsg_externalBrittanyShatia
 
I Simply Excel
I Simply ExcelI Simply Excel
I Simply ExcelEric Couch
 
Create a PivotTable to analyze worksheet data.pdf
Create a PivotTable to analyze worksheet data.pdfCreate a PivotTable to analyze worksheet data.pdf
Create a PivotTable to analyze worksheet data.pdfAbubakar Bashir
 
CREATING A DATASET FROM EXCEL IN POWER BI REPORT BUILDER
CREATING A DATASET FROM EXCEL IN POWER BI REPORT BUILDERCREATING A DATASET FROM EXCEL IN POWER BI REPORT BUILDER
CREATING A DATASET FROM EXCEL IN POWER BI REPORT BUILDERSagarDuttPhuloria
 

Similaire à Getting Started with SharePoint Status Indicators - EPC Group (20)

How to Navigate PerformancePoint 2010 Dashboards and Explore Data - EPC Group
How to Navigate PerformancePoint 2010 Dashboards and Explore Data - EPC GroupHow to Navigate PerformancePoint 2010 Dashboards and Explore Data - EPC Group
How to Navigate PerformancePoint 2010 Dashboards and Explore Data - EPC Group
 
ETL Microsoft Material
ETL Microsoft MaterialETL Microsoft Material
ETL Microsoft Material
 
SharePoint Lists and Libraries Configuration
SharePoint Lists and Libraries ConfigurationSharePoint Lists and Libraries Configuration
SharePoint Lists and Libraries Configuration
 
SharePoint Lists and Document Libraries Configuration and Learning
SharePoint Lists and Document Libraries Configuration and LearningSharePoint Lists and Document Libraries Configuration and Learning
SharePoint Lists and Document Libraries Configuration and Learning
 
SharePoint Lists and Libraries Configuration
SharePoint Lists and Libraries ConfigurationSharePoint Lists and Libraries Configuration
SharePoint Lists and Libraries Configuration
 
SharePoint Lists and Libraries
SharePoint Lists and LibrariesSharePoint Lists and Libraries
SharePoint Lists and Libraries
 
Presentation 03
Presentation 03Presentation 03
Presentation 03
 
SharePoint Lists and Libraries Configuration
SharePoint Lists and Libraries ConfigurationSharePoint Lists and Libraries Configuration
SharePoint Lists and Libraries Configuration
 
Share point ssis adapters 2011
Share point ssis adapters 2011Share point ssis adapters 2011
Share point ssis adapters 2011
 
MS Excel 2013
MS Excel 2013MS Excel 2013
MS Excel 2013
 
Req pro tips
Req pro tipsReq pro tips
Req pro tips
 
Informatica power center
Informatica power centerInformatica power center
Informatica power center
 
Project Web Access Quick Reference Guide For Team Members
Project Web Access Quick Reference Guide For Team MembersProject Web Access Quick Reference Guide For Team Members
Project Web Access Quick Reference Guide For Team Members
 
Financial reporting rpd using obiee
Financial reporting rpd using obieeFinancial reporting rpd using obiee
Financial reporting rpd using obiee
 
Financial reporting rpd using obiee
Financial reporting rpd using obieeFinancial reporting rpd using obiee
Financial reporting rpd using obiee
 
Financial reporting rpd using obiee
Financial reporting rpd using obieeFinancial reporting rpd using obiee
Financial reporting rpd using obiee
 
2580 microsoft excel2010_rtm_wsg_external
2580 microsoft excel2010_rtm_wsg_external2580 microsoft excel2010_rtm_wsg_external
2580 microsoft excel2010_rtm_wsg_external
 
I Simply Excel
I Simply ExcelI Simply Excel
I Simply Excel
 
Create a PivotTable to analyze worksheet data.pdf
Create a PivotTable to analyze worksheet data.pdfCreate a PivotTable to analyze worksheet data.pdf
Create a PivotTable to analyze worksheet data.pdf
 
CREATING A DATASET FROM EXCEL IN POWER BI REPORT BUILDER
CREATING A DATASET FROM EXCEL IN POWER BI REPORT BUILDERCREATING A DATASET FROM EXCEL IN POWER BI REPORT BUILDER
CREATING A DATASET FROM EXCEL IN POWER BI REPORT BUILDER
 

Plus de EPC Group

Power BI vs Tableau - An Overview from EPC Group.pptx
Power BI vs Tableau - An Overview from EPC Group.pptxPower BI vs Tableau - An Overview from EPC Group.pptx
Power BI vs Tableau - An Overview from EPC Group.pptxEPC Group
 
EPC Group Intune Practice and Capabilities Overview
EPC Group Intune Practice and Capabilities OverviewEPC Group Intune Practice and Capabilities Overview
EPC Group Intune Practice and Capabilities OverviewEPC Group
 
Pop the Hood on Microsoft Teams - EPC Group
Pop the Hood on Microsoft Teams - EPC GroupPop the Hood on Microsoft Teams - EPC Group
Pop the Hood on Microsoft Teams - EPC GroupEPC Group
 
Windows Server 2012 Deep-Dive - EPC Group
Windows Server 2012 Deep-Dive - EPC GroupWindows Server 2012 Deep-Dive - EPC Group
Windows Server 2012 Deep-Dive - EPC GroupEPC Group
 
Understanding Windows Azure’s Active Directory (AD) and PowerShell Tools
Understanding Windows Azure’s Active Directory (AD) and PowerShell ToolsUnderstanding Windows Azure’s Active Directory (AD) and PowerShell Tools
Understanding Windows Azure’s Active Directory (AD) and PowerShell ToolsEPC Group
 
PowerShell with SharePoint 2013 and Office 365 - EPC Group
PowerShell with SharePoint 2013 and Office 365 - EPC GroupPowerShell with SharePoint 2013 and Office 365 - EPC Group
PowerShell with SharePoint 2013 and Office 365 - EPC GroupEPC Group
 
Understanding Office 365’s Identity Solutions: Deep Dive - EPC Group
Understanding Office 365’s Identity Solutions: Deep Dive - EPC GroupUnderstanding Office 365’s Identity Solutions: Deep Dive - EPC Group
Understanding Office 365’s Identity Solutions: Deep Dive - EPC GroupEPC Group
 
System Center 2012 SP1 - Overview - EPC Group
System Center 2012 SP1 - Overview - EPC GroupSystem Center 2012 SP1 - Overview - EPC Group
System Center 2012 SP1 - Overview - EPC GroupEPC Group
 
Windows Azure Pack Enabling Virtual Machines - IaaS & Virtual Machine Role - ...
Windows Azure Pack Enabling Virtual Machines - IaaS & Virtual Machine Role - ...Windows Azure Pack Enabling Virtual Machines - IaaS & Virtual Machine Role - ...
Windows Azure Pack Enabling Virtual Machines - IaaS & Virtual Machine Role - ...EPC Group
 
Lync 2013 - Audio - Quick Reference - 2 Page Reference - EPC Group
Lync 2013 - Audio - Quick Reference - 2 Page Reference - EPC GroupLync 2013 - Audio - Quick Reference - 2 Page Reference - EPC Group
Lync 2013 - Audio - Quick Reference - 2 Page Reference - EPC GroupEPC Group
 
Lync 2013 - Sharing and Collaboration - Quick Reference 2 Pager
Lync 2013 - Sharing and Collaboration - Quick Reference 2 PagerLync 2013 - Sharing and Collaboration - Quick Reference 2 Pager
Lync 2013 - Sharing and Collaboration - Quick Reference 2 PagerEPC Group
 
Windows Server 2012 Deep-Dive - EPC Group
Windows Server 2012 Deep-Dive - EPC GroupWindows Server 2012 Deep-Dive - EPC Group
Windows Server 2012 Deep-Dive - EPC GroupEPC Group
 
Hyper-V’s Virtualization Enhancements - EPC Group
Hyper-V’s Virtualization Enhancements - EPC GroupHyper-V’s Virtualization Enhancements - EPC Group
Hyper-V’s Virtualization Enhancements - EPC GroupEPC Group
 
High Level Overview of Windows Azure - EPC Group
High Level Overview of Windows Azure - EPC GroupHigh Level Overview of Windows Azure - EPC Group
High Level Overview of Windows Azure - EPC GroupEPC Group
 
SharePoint 2013 and Office 365 External Sharing
SharePoint 2013 and Office 365 External SharingSharePoint 2013 and Office 365 External Sharing
SharePoint 2013 and Office 365 External SharingEPC Group
 
BizTalk Server 2010 - Invoking Restful Services - EPC Group
BizTalk Server 2010 - Invoking Restful Services - EPC GroupBizTalk Server 2010 - Invoking Restful Services - EPC Group
BizTalk Server 2010 - Invoking Restful Services - EPC GroupEPC Group
 
BizTalk Sever 2010 - Basic Principles of Maps - EPC Group
BizTalk Sever 2010 - Basic Principles of Maps - EPC GroupBizTalk Sever 2010 - Basic Principles of Maps - EPC Group
BizTalk Sever 2010 - Basic Principles of Maps - EPC GroupEPC Group
 
EPC Group and Continental Airlines ECM Case Study - SharePoint 2007 Global Study
EPC Group and Continental Airlines ECM Case Study - SharePoint 2007 Global StudyEPC Group and Continental Airlines ECM Case Study - SharePoint 2007 Global Study
EPC Group and Continental Airlines ECM Case Study - SharePoint 2007 Global StudyEPC Group
 
Driving End User Adoption in SharePoint 2013 & 2010 - EPC Group
Driving End User Adoption in SharePoint 2013 & 2010 - EPC GroupDriving End User Adoption in SharePoint 2013 & 2010 - EPC Group
Driving End User Adoption in SharePoint 2013 & 2010 - EPC GroupEPC Group
 
Join EPC Group's Monthly Newsletter
Join EPC Group's Monthly NewsletterJoin EPC Group's Monthly Newsletter
Join EPC Group's Monthly NewsletterEPC Group
 

Plus de EPC Group (20)

Power BI vs Tableau - An Overview from EPC Group.pptx
Power BI vs Tableau - An Overview from EPC Group.pptxPower BI vs Tableau - An Overview from EPC Group.pptx
Power BI vs Tableau - An Overview from EPC Group.pptx
 
EPC Group Intune Practice and Capabilities Overview
EPC Group Intune Practice and Capabilities OverviewEPC Group Intune Practice and Capabilities Overview
EPC Group Intune Practice and Capabilities Overview
 
Pop the Hood on Microsoft Teams - EPC Group
Pop the Hood on Microsoft Teams - EPC GroupPop the Hood on Microsoft Teams - EPC Group
Pop the Hood on Microsoft Teams - EPC Group
 
Windows Server 2012 Deep-Dive - EPC Group
Windows Server 2012 Deep-Dive - EPC GroupWindows Server 2012 Deep-Dive - EPC Group
Windows Server 2012 Deep-Dive - EPC Group
 
Understanding Windows Azure’s Active Directory (AD) and PowerShell Tools
Understanding Windows Azure’s Active Directory (AD) and PowerShell ToolsUnderstanding Windows Azure’s Active Directory (AD) and PowerShell Tools
Understanding Windows Azure’s Active Directory (AD) and PowerShell Tools
 
PowerShell with SharePoint 2013 and Office 365 - EPC Group
PowerShell with SharePoint 2013 and Office 365 - EPC GroupPowerShell with SharePoint 2013 and Office 365 - EPC Group
PowerShell with SharePoint 2013 and Office 365 - EPC Group
 
Understanding Office 365’s Identity Solutions: Deep Dive - EPC Group
Understanding Office 365’s Identity Solutions: Deep Dive - EPC GroupUnderstanding Office 365’s Identity Solutions: Deep Dive - EPC Group
Understanding Office 365’s Identity Solutions: Deep Dive - EPC Group
 
System Center 2012 SP1 - Overview - EPC Group
System Center 2012 SP1 - Overview - EPC GroupSystem Center 2012 SP1 - Overview - EPC Group
System Center 2012 SP1 - Overview - EPC Group
 
Windows Azure Pack Enabling Virtual Machines - IaaS & Virtual Machine Role - ...
Windows Azure Pack Enabling Virtual Machines - IaaS & Virtual Machine Role - ...Windows Azure Pack Enabling Virtual Machines - IaaS & Virtual Machine Role - ...
Windows Azure Pack Enabling Virtual Machines - IaaS & Virtual Machine Role - ...
 
Lync 2013 - Audio - Quick Reference - 2 Page Reference - EPC Group
Lync 2013 - Audio - Quick Reference - 2 Page Reference - EPC GroupLync 2013 - Audio - Quick Reference - 2 Page Reference - EPC Group
Lync 2013 - Audio - Quick Reference - 2 Page Reference - EPC Group
 
Lync 2013 - Sharing and Collaboration - Quick Reference 2 Pager
Lync 2013 - Sharing and Collaboration - Quick Reference 2 PagerLync 2013 - Sharing and Collaboration - Quick Reference 2 Pager
Lync 2013 - Sharing and Collaboration - Quick Reference 2 Pager
 
Windows Server 2012 Deep-Dive - EPC Group
Windows Server 2012 Deep-Dive - EPC GroupWindows Server 2012 Deep-Dive - EPC Group
Windows Server 2012 Deep-Dive - EPC Group
 
Hyper-V’s Virtualization Enhancements - EPC Group
Hyper-V’s Virtualization Enhancements - EPC GroupHyper-V’s Virtualization Enhancements - EPC Group
Hyper-V’s Virtualization Enhancements - EPC Group
 
High Level Overview of Windows Azure - EPC Group
High Level Overview of Windows Azure - EPC GroupHigh Level Overview of Windows Azure - EPC Group
High Level Overview of Windows Azure - EPC Group
 
SharePoint 2013 and Office 365 External Sharing
SharePoint 2013 and Office 365 External SharingSharePoint 2013 and Office 365 External Sharing
SharePoint 2013 and Office 365 External Sharing
 
BizTalk Server 2010 - Invoking Restful Services - EPC Group
BizTalk Server 2010 - Invoking Restful Services - EPC GroupBizTalk Server 2010 - Invoking Restful Services - EPC Group
BizTalk Server 2010 - Invoking Restful Services - EPC Group
 
BizTalk Sever 2010 - Basic Principles of Maps - EPC Group
BizTalk Sever 2010 - Basic Principles of Maps - EPC GroupBizTalk Sever 2010 - Basic Principles of Maps - EPC Group
BizTalk Sever 2010 - Basic Principles of Maps - EPC Group
 
EPC Group and Continental Airlines ECM Case Study - SharePoint 2007 Global Study
EPC Group and Continental Airlines ECM Case Study - SharePoint 2007 Global StudyEPC Group and Continental Airlines ECM Case Study - SharePoint 2007 Global Study
EPC Group and Continental Airlines ECM Case Study - SharePoint 2007 Global Study
 
Driving End User Adoption in SharePoint 2013 & 2010 - EPC Group
Driving End User Adoption in SharePoint 2013 & 2010 - EPC GroupDriving End User Adoption in SharePoint 2013 & 2010 - EPC Group
Driving End User Adoption in SharePoint 2013 & 2010 - EPC Group
 
Join EPC Group's Monthly Newsletter
Join EPC Group's Monthly NewsletterJoin EPC Group's Monthly Newsletter
Join EPC Group's Monthly Newsletter
 

Dernier

The State of Passkeys with FIDO Alliance.pptx
The State of Passkeys with FIDO Alliance.pptxThe State of Passkeys with FIDO Alliance.pptx
The State of Passkeys with FIDO Alliance.pptxLoriGlavin3
 
What is DBT - The Ultimate Data Build Tool.pdf
What is DBT - The Ultimate Data Build Tool.pdfWhat is DBT - The Ultimate Data Build Tool.pdf
What is DBT - The Ultimate Data Build Tool.pdfMounikaPolabathina
 
How to Effectively Monitor SD-WAN and SASE Environments with ThousandEyes
How to Effectively Monitor SD-WAN and SASE Environments with ThousandEyesHow to Effectively Monitor SD-WAN and SASE Environments with ThousandEyes
How to Effectively Monitor SD-WAN and SASE Environments with ThousandEyesThousandEyes
 
Use of FIDO in the Payments and Identity Landscape: FIDO Paris Seminar.pptx
Use of FIDO in the Payments and Identity Landscape: FIDO Paris Seminar.pptxUse of FIDO in the Payments and Identity Landscape: FIDO Paris Seminar.pptx
Use of FIDO in the Payments and Identity Landscape: FIDO Paris Seminar.pptxLoriGlavin3
 
UiPath Community: Communication Mining from Zero to Hero
UiPath Community: Communication Mining from Zero to HeroUiPath Community: Communication Mining from Zero to Hero
UiPath Community: Communication Mining from Zero to HeroUiPathCommunity
 
Connecting the Dots for Information Discovery.pdf
Connecting the Dots for Information Discovery.pdfConnecting the Dots for Information Discovery.pdf
Connecting the Dots for Information Discovery.pdfNeo4j
 
Decarbonising Buildings: Making a net-zero built environment a reality
Decarbonising Buildings: Making a net-zero built environment a realityDecarbonising Buildings: Making a net-zero built environment a reality
Decarbonising Buildings: Making a net-zero built environment a realityIES VE
 
Scale your database traffic with Read & Write split using MySQL Router
Scale your database traffic with Read & Write split using MySQL RouterScale your database traffic with Read & Write split using MySQL Router
Scale your database traffic with Read & Write split using MySQL RouterMydbops
 
Modern Roaming for Notes and Nomad – Cheaper Faster Better Stronger
Modern Roaming for Notes and Nomad – Cheaper Faster Better StrongerModern Roaming for Notes and Nomad – Cheaper Faster Better Stronger
Modern Roaming for Notes and Nomad – Cheaper Faster Better Strongerpanagenda
 
TrustArc Webinar - How to Build Consumer Trust Through Data Privacy
TrustArc Webinar - How to Build Consumer Trust Through Data PrivacyTrustArc Webinar - How to Build Consumer Trust Through Data Privacy
TrustArc Webinar - How to Build Consumer Trust Through Data PrivacyTrustArc
 
The Future Roadmap for the Composable Data Stack - Wes McKinney - Data Counci...
The Future Roadmap for the Composable Data Stack - Wes McKinney - Data Counci...The Future Roadmap for the Composable Data Stack - Wes McKinney - Data Counci...
The Future Roadmap for the Composable Data Stack - Wes McKinney - Data Counci...Wes McKinney
 
Sample pptx for embedding into website for demo
Sample pptx for embedding into website for demoSample pptx for embedding into website for demo
Sample pptx for embedding into website for demoHarshalMandlekar2
 
Emixa Mendix Meetup 11 April 2024 about Mendix Native development
Emixa Mendix Meetup 11 April 2024 about Mendix Native developmentEmixa Mendix Meetup 11 April 2024 about Mendix Native development
Emixa Mendix Meetup 11 April 2024 about Mendix Native developmentPim van der Noll
 
Long journey of Ruby standard library at RubyConf AU 2024
Long journey of Ruby standard library at RubyConf AU 2024Long journey of Ruby standard library at RubyConf AU 2024
Long journey of Ruby standard library at RubyConf AU 2024Hiroshi SHIBATA
 
The Ultimate Guide to Choosing WordPress Pros and Cons
The Ultimate Guide to Choosing WordPress Pros and ConsThe Ultimate Guide to Choosing WordPress Pros and Cons
The Ultimate Guide to Choosing WordPress Pros and ConsPixlogix Infotech
 
Testing tools and AI - ideas what to try with some tool examples
Testing tools and AI - ideas what to try with some tool examplesTesting tools and AI - ideas what to try with some tool examples
Testing tools and AI - ideas what to try with some tool examplesKari Kakkonen
 
A Deep Dive on Passkeys: FIDO Paris Seminar.pptx
A Deep Dive on Passkeys: FIDO Paris Seminar.pptxA Deep Dive on Passkeys: FIDO Paris Seminar.pptx
A Deep Dive on Passkeys: FIDO Paris Seminar.pptxLoriGlavin3
 
From Family Reminiscence to Scholarly Archive .
From Family Reminiscence to Scholarly Archive .From Family Reminiscence to Scholarly Archive .
From Family Reminiscence to Scholarly Archive .Alan Dix
 
Unleashing Real-time Insights with ClickHouse_ Navigating the Landscape in 20...
Unleashing Real-time Insights with ClickHouse_ Navigating the Landscape in 20...Unleashing Real-time Insights with ClickHouse_ Navigating the Landscape in 20...
Unleashing Real-time Insights with ClickHouse_ Navigating the Landscape in 20...Alkin Tezuysal
 
(How to Program) Paul Deitel, Harvey Deitel-Java How to Program, Early Object...
(How to Program) Paul Deitel, Harvey Deitel-Java How to Program, Early Object...(How to Program) Paul Deitel, Harvey Deitel-Java How to Program, Early Object...
(How to Program) Paul Deitel, Harvey Deitel-Java How to Program, Early Object...AliaaTarek5
 

Dernier (20)

The State of Passkeys with FIDO Alliance.pptx
The State of Passkeys with FIDO Alliance.pptxThe State of Passkeys with FIDO Alliance.pptx
The State of Passkeys with FIDO Alliance.pptx
 
What is DBT - The Ultimate Data Build Tool.pdf
What is DBT - The Ultimate Data Build Tool.pdfWhat is DBT - The Ultimate Data Build Tool.pdf
What is DBT - The Ultimate Data Build Tool.pdf
 
How to Effectively Monitor SD-WAN and SASE Environments with ThousandEyes
How to Effectively Monitor SD-WAN and SASE Environments with ThousandEyesHow to Effectively Monitor SD-WAN and SASE Environments with ThousandEyes
How to Effectively Monitor SD-WAN and SASE Environments with ThousandEyes
 
Use of FIDO in the Payments and Identity Landscape: FIDO Paris Seminar.pptx
Use of FIDO in the Payments and Identity Landscape: FIDO Paris Seminar.pptxUse of FIDO in the Payments and Identity Landscape: FIDO Paris Seminar.pptx
Use of FIDO in the Payments and Identity Landscape: FIDO Paris Seminar.pptx
 
UiPath Community: Communication Mining from Zero to Hero
UiPath Community: Communication Mining from Zero to HeroUiPath Community: Communication Mining from Zero to Hero
UiPath Community: Communication Mining from Zero to Hero
 
Connecting the Dots for Information Discovery.pdf
Connecting the Dots for Information Discovery.pdfConnecting the Dots for Information Discovery.pdf
Connecting the Dots for Information Discovery.pdf
 
Decarbonising Buildings: Making a net-zero built environment a reality
Decarbonising Buildings: Making a net-zero built environment a realityDecarbonising Buildings: Making a net-zero built environment a reality
Decarbonising Buildings: Making a net-zero built environment a reality
 
Scale your database traffic with Read & Write split using MySQL Router
Scale your database traffic with Read & Write split using MySQL RouterScale your database traffic with Read & Write split using MySQL Router
Scale your database traffic with Read & Write split using MySQL Router
 
Modern Roaming for Notes and Nomad – Cheaper Faster Better Stronger
Modern Roaming for Notes and Nomad – Cheaper Faster Better StrongerModern Roaming for Notes and Nomad – Cheaper Faster Better Stronger
Modern Roaming for Notes and Nomad – Cheaper Faster Better Stronger
 
TrustArc Webinar - How to Build Consumer Trust Through Data Privacy
TrustArc Webinar - How to Build Consumer Trust Through Data PrivacyTrustArc Webinar - How to Build Consumer Trust Through Data Privacy
TrustArc Webinar - How to Build Consumer Trust Through Data Privacy
 
The Future Roadmap for the Composable Data Stack - Wes McKinney - Data Counci...
The Future Roadmap for the Composable Data Stack - Wes McKinney - Data Counci...The Future Roadmap for the Composable Data Stack - Wes McKinney - Data Counci...
The Future Roadmap for the Composable Data Stack - Wes McKinney - Data Counci...
 
Sample pptx for embedding into website for demo
Sample pptx for embedding into website for demoSample pptx for embedding into website for demo
Sample pptx for embedding into website for demo
 
Emixa Mendix Meetup 11 April 2024 about Mendix Native development
Emixa Mendix Meetup 11 April 2024 about Mendix Native developmentEmixa Mendix Meetup 11 April 2024 about Mendix Native development
Emixa Mendix Meetup 11 April 2024 about Mendix Native development
 
Long journey of Ruby standard library at RubyConf AU 2024
Long journey of Ruby standard library at RubyConf AU 2024Long journey of Ruby standard library at RubyConf AU 2024
Long journey of Ruby standard library at RubyConf AU 2024
 
The Ultimate Guide to Choosing WordPress Pros and Cons
The Ultimate Guide to Choosing WordPress Pros and ConsThe Ultimate Guide to Choosing WordPress Pros and Cons
The Ultimate Guide to Choosing WordPress Pros and Cons
 
Testing tools and AI - ideas what to try with some tool examples
Testing tools and AI - ideas what to try with some tool examplesTesting tools and AI - ideas what to try with some tool examples
Testing tools and AI - ideas what to try with some tool examples
 
A Deep Dive on Passkeys: FIDO Paris Seminar.pptx
A Deep Dive on Passkeys: FIDO Paris Seminar.pptxA Deep Dive on Passkeys: FIDO Paris Seminar.pptx
A Deep Dive on Passkeys: FIDO Paris Seminar.pptx
 
From Family Reminiscence to Scholarly Archive .
From Family Reminiscence to Scholarly Archive .From Family Reminiscence to Scholarly Archive .
From Family Reminiscence to Scholarly Archive .
 
Unleashing Real-time Insights with ClickHouse_ Navigating the Landscape in 20...
Unleashing Real-time Insights with ClickHouse_ Navigating the Landscape in 20...Unleashing Real-time Insights with ClickHouse_ Navigating the Landscape in 20...
Unleashing Real-time Insights with ClickHouse_ Navigating the Landscape in 20...
 
(How to Program) Paul Deitel, Harvey Deitel-Java How to Program, Early Object...
(How to Program) Paul Deitel, Harvey Deitel-Java How to Program, Early Object...(How to Program) Paul Deitel, Harvey Deitel-Java How to Program, Early Object...
(How to Program) Paul Deitel, Harvey Deitel-Java How to Program, Early Object...
 

Getting Started with SharePoint Status Indicators - EPC Group

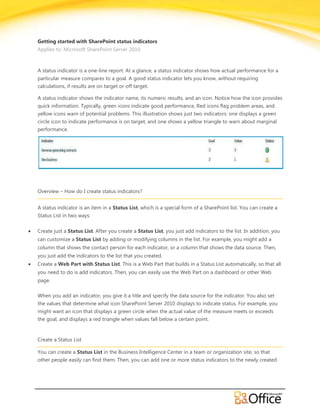
  • 1. Getting started with SharePoint status indicators Applies to: Microsoft SharePoint Server 2010 A status indicator is a one-line report. At a glance, a status indicator shows how actual performance for a particular measure compares to a goal. A good status indicator lets you know, without requiring calculations, if results are on target or off target. A status indicator shows the indicator name, its numeric results, and an icon. Notice how the icon provides quick information. Typically, green icons indicate good performance, Red icons flag problem areas, and yellow icons warn of potential problems. This illustration shows just two indicators: one displays a green circle icon to indicate performance is on target, and one shows a yellow triangle to warn about marginal performance. Overview – How do I create status indicators? A status indicator is an item in a Status List, which is a special form of a SharePoint list. You can create a Status List in two ways: Create just a Status List. After you create a Status List, you just add indicators to the list. In addition, you can customize a Status List by adding or modifying columns in the list. For example, you might add a column that shows the contact person for each indicator, or a column that shows the data source. Then, you just add the indicators to the list that you created. Create a Web Part with Status List. This is a Web Part that builds in a Status List automatically, so that all you need to do is add indicators. Then, you can easily use the Web Part on a dashboard or other Web page. When you add an indicator, you give it a title and specify the data source for the indicator. You also set the values that determine what icon SharePoint Server 2010 displays to indicate status. For example, you might want an icon that displays a green circle when the actual value of the measure meets or exceeds the goal, and displays a red triangle when values fall below a certain point. Create a Status List You can create a Status List in the Business Intelligence Center in a team or organization site, so that other people easily can find them. Then, you can add one or more status indicators to the newly created
  • 2. list. To increase flexibility about what the list displays, you can create one or more customized views of a Status List. To create a new Status List, take these steps: 1. In the site where you want to create the Status List, click Site Actions, and then select View All Site Content. Under the All Site Content heading, click Create. 2. On the Create page, in the Filter By: panel, click List. Then, in the main panel, click the Status List icon. 3. Type a name for the Status List. 4. (Optional) To enter a description, or to choose to have the list name appear in the Quick Launch panel, click More Options. Then, configure the options that you prefer. 5. Click Create to finish creating the Status List. SharePoint Server 2010 opens the new Status List in edit mode so that you can add one or more status indicators. Create a Web Part with Status List You can create a special Web Part that displays a pre-defined view of a Status List. You can add indicators directly to this Web Part, and then use the Web Part on any page in your site. To create a new Web Part with Status List, take these steps: 1. In the site where you want to create the Web Part with Status List, in the Quick Launch panel of the default page of the Business Intelligence Center, click Dashboards, 2. On the Dashboard: All Items page, click the Documents tab in the Library Tools group. 3. Click New Document, and then select Web Part Page with Status List to open the property page for a new Web Part. 4. On the property page for the new Web Part with Status List, in the Page Name section, enter a name and description for the new page. If desired, you can also enter a Page Title, which will appear as a banner title on the new Web Part page. 5. In the Location section, select the Documents Library and Folder that will contain the new Web Part page from the matching drop down lists. 6. (Optional) In the Create Link in Current Navigation Bar section, decide whether you want to create a link from this page to the navigation bar. 7. In the Web part page with status list layout section, select a layout from the Layout list. 8. In the Status Indicators section, check the radio button next to Create a status indicator list for me automatically. Alternatively, you can decide to select an existing list at a later time. 9. Click OK to close the property page and open the new Web Part page. ©2009 Microsoft Corporation.
  • 3. You can customize the Web Part Page with Status List. For example, you can change the type of icon that SharePoint uses to display the status of the indicator, you can create a display title for it, or you can specify the size of the Web Part. To learn how to do this, see links in the See Also section. You are now ready to add a status indicator to the Status List in the newly created Web Part. Add a status indicator to a Status List The steps in this procedure assume that you have selected a previously created Status List, and that the list is in Edit mode, or that you have just created a new Status List. When you create a new list, SharePoint Server 2010 automatically opens the list in Edit mode. 1. On the Status List toolbar, click the arrow next to New. 2. Select an indicator type from the drop-down menu, depending on the data source for the indicator to open a property page for the new indicator. 3. The following table contains a list of available indicator types and a short description of each type. To learn how to specify properties for a specific indicator type, click on the name of the indicator type. INDICATOR TYPE DESCRIPTION SharePoint List based Status Shows a value based on the contents of a SharePoint list. Indicator Excel based Status Indicator Shows values directly imported from an Excel Services workbook. The value can be specified by a cell address in the workbook. SQL Server Analysis Services Imports a selected Key Performance Indicator from a SQL Server based Status Indicator Analysis Services cube Fixed value based Status Shows values that are manually entered by the indicator author. Indicator SHAREPOINT LIST BASED STATUS INDICATOR SharePoint Server 2010 lists are great ways to track items. For example, you might create a list that shows the status of business contracts, and create a status indicator that reports the percentage of active contracts, or contracts that are complete. Lists can contain items that are part of a workflow, or report employee participation in training programs. You can use a status indicator to track how long the issues or tasks have been open, how many are open, and what percentage of a task is complete. You can also keep track of totals, such as the amount of time that an issue has been open or the total number of sales in a region. ©2009 Microsoft Corporation.
  • 4. NOTE Before you select this option, make sure the list that you want to use exists, and is in the view that you want to use... To create a new status indicator that is based on a SharePoint list, take these steps: 1. On the New Item page, under SharePoint List and View, in the List URL box, enter the URL of the list or library. NOTE The SharePoint list or library must be in the same site. 2. In the View box, select the view that contains the items you want to use in the status indicator. 3. Under Value Calculation, select the calculation method that you want to use to calculate the goal of the status indicator. The following table describes the calculation options. CALCULATION DESCRIPTION OPTION Number of list A count of the total number of items in the list. items Percentage of list This method calculates the percentage of items in the specified view that meet the items in the view criteria that you select. where To select a criteria, take these steps: Select the name of the column from the Select column…drop-down list. Select the comparison operator from the is equal to drop-down list. Type the value that you want to use for comparison in the text box. To add criteria for up to five additional columns, repeat these steps. Calculation using all This method calculates the value that you select, based on values in a specified list items in the column. Select one of the following from the drop-down list: Sum, Average, view Maximum, or Minimum. Then, select the column that contains the values that you want computed from the Select column… drop-down list 4. In the Status Icon Rules section, do the following: From the Better values are drop down list, select higher to have SharePoint change Icons when increasing values meet or exceed goal or warning thresholds. Select lower to have SharePoint change Icons when decreasing values meet or exceed goal or warning thresholds. In the Display when value has met or exceeded goal box, type the goal value. When the indicator value reaches this goal, SharePoint changes the icon to show that performance is on target. In the Display when value has met or exceeded warning box, type the value at which performance is unacceptable, and SharePoint changes the icon to warn of a potential problem. ©2009 Microsoft Corporation.
  • 5. 5. (Optional) In the Details Link section, in the Details Page box, type the URL of the page that provides more detailed information about this indicator, such as the source list for the indicator. 6. (Optional) in the Update Rules section, select the option that determines whether SharePoint Server 2010 updates the indicator values each time a new user opens the list, or updates the indicator values when the user manually updates the values from a menu. EXCEL BASED STATUS INDICATOR You can base a status indicator on data in an Excel workbook that you save or publish to your SharePoint Server 2010 site. As the data in the workbook changes, SharePoint Server 2010 automatically updates the values in the status indicator. In addition, you can display the workbook on the same Web page. To create a new status indicator that is based on an Excel Services workbook, take these steps: 1. On the New Item page, in the Name and Description boxes, type a name and optional description for the indicator. 2. (Optional) In the Comments box, type any comments. For example, you might provide information to help people who are viewing the indicator understand what it represents. 3. In the Indicator Value section, in the Workbook URL box, enter the URL of the Excel workbook that contains the data and calculations for the indicator. The Excel Services workbook must be saved in a SharePoint library that is in the same site. 4. In the Cell Address for Indicator Value box, type the address of the cell that contains the actual value for the indicator. Alternatively, you can click the Browse button to browse the workbook that you specified by the URL in Step 3, and then select the cell that contains the values you want to use in the status indicator 5. In the Status Icon Rules section, do the following: From the Better values are drop down list, select higher to have SharePoint change Icons when increasing values meet or exceed goal or warning thresholds. Select lower to have SharePoint change Icons when decreasing values meet or exceed goal or warning thresholds. In the Display when value has met or exceeded goal box, type the goal value. When the indicator value reaches this goal, SharePoint changes the icon to show that performance is on target. In the Display when value has met or exceeded warning box, type the value at which performance is unacceptable, and SharePoint changes the icon to warn of a potential problem. 6. (Optional) In the Details Link section, in the Details Page box, type the URL of the page that provides more detailed information about this indicator, such as the source list for the indicator. ©2009 Microsoft Corporation.
  • 6. 7. (Optional) in the Update Rules section, select the option that determines whether SharePoint Server 2010 updates the indicator values each time a new user opens the list, or updates the indicator values when the user manually updates the values from a menu. SQL SERVER ANALYSIS SERVICES BASED STATUS INDICATOR SharePoint Server 2010can import KPIs from SQL Server Analysis Services (SSAS), a component of SQL Server 2005 and SQL Server 2008. A systems administrator or database analyst usually sets up these KPIs and adds the data connection file to the Data Connection library on a Business Intelligence Center site. Then, anyone with the appropriate permissions can access the database and link to the Analysis Services KPIs SSAS enables analysts to define powerful and flexible KPIs that are based on multidimensional data. However, an SSAS KPI can be defined and managed only while working in SSAS. An analyst can use commands in SSAS to create and manage any KPI properties, such as the performance goal, the status icon, and the threshold values at which an icon changes color to indicate a change in performance status. You can change the display name of a KPI that you import to a Status List, but you cannot change any other properties of the KPI while working in SharePoint Server 2010. To import a KPI from SSAS, take these steps. 1. On the New Item page, in the Data Connection box, enter the URL of the Microsoft Office data connection (.odc) file, or click the Browse button to open the Select an Asset dialog box, and navigate to the .odc file. 2. In the Only display KPIs from display folder box, select the display folder in the Analysis Services database that contains the KPI. 3. In the KPI List box, select the KPI you want, such as Total Revenue or Average Profit Margin. 4. Select the Include child indicators check box to display all of the child indicators for the selected KPI. If the selected KPI has child indicators, the Status List displays the parent and child indicators in a hierarchy. The following illustration shows an imported KPI (Net Income) that has three child indicators (Operating Profit, Operating Expenses, and Financial Gross Margin). 5. In the Name and Description boxes, type a name and description (optional) for the indicator. 6. (Optional) In the Comments box, type any comments. For example, you might provide information to help people who are viewing the KPI understand what it represents. ©2009 Microsoft Corporation.
  • 7. 7. (Optional) In the Details Link section, in the Details Page box, type the URL of the page that provides more detailed information about this indicator, such as the data source for the indicator. 8. (Optional) in the Update Rules section, select the option that determines whether SharePoint Server 2010 updates the indicator values each time a new user opens the list, or updates the indicator values when the user manually updates the values from a menu. NOTE The Status Icon Rules for an indicator that imports an Analysis Services KPI are preset by the database analyst... FIXED VALUE BASED STATUS INDICATOR In some situations, you might want to enter values manually for a status indicator. Perhaps the indicator is based on unstructured information such as e-mail, or you have a one-time project to track. 1. On the New Item page, in the Name and Description boxes, type a name and optional description for the indicator. 2. (Optional) In the Comments box, type any comments. For example, you might provide information to help people who are viewing the indicator understand what it represents. 3. Type the numerical value of your progress so far. 4. In the Status Icon Rules section, do the following: From the Better values are drop down list, select higher to have SharePoint change Icons when increasing values meet or exceed goal or warning thresholds. Select lower to have SharePoint change Icons when decreasing values meet or exceed goal or warning thresholds. In the Display when value has met or exceeded goal box, type the goal value. When the indicator value reaches this goal, SharePoint changes the icon to show that performance is on target. In the Display when value has met or exceeded warning box, type the value at which performance is unacceptable, and SharePoint changes the icon to warn of a potential problem. ©2009 Microsoft Corporation.