Contenu connexe
Similaire à Enzymelab (20)
Enzymelab
- 1. 004-007_CH02 5/16/06 12:48 PM Page 4
Name ____________________________________ Class ______________________ Date _________________
Chapter 2 The Chemistry of Life Design an Experiment
Investigating the Effect of Temperature on Enzyme Activity
Almost all chemical reactions that occur in living organisms are catalyzed
by enzymes. Many factors in a cell’s environment affect the action of an
enzyme. In this investigation, you will design an experiment to determine
the effect of temperature on an enzyme-catalyzed reaction.
Problem
How does temperature affect the rate of an enzyme-catalyzed reaction?
Materials
• raw liver • forceps
• petri dish • glass-marking pencil
• dropper pipette • ice bath
• 1% hydrogen peroxide solution • 3 thermometers
• liver puree • warm-water bath
• 25-mL graduated cylinder • clock or watch with second hand
• five 50-mL beakers • paper towel
• filter-paper disks
Skills Formulating Hypotheses, Predicting
Design Your Experiment
© Pearson Education, Inc., publishing as Pearson Prentice Hall. All rights reserved.
Part A: Observe the Catalase Reaction
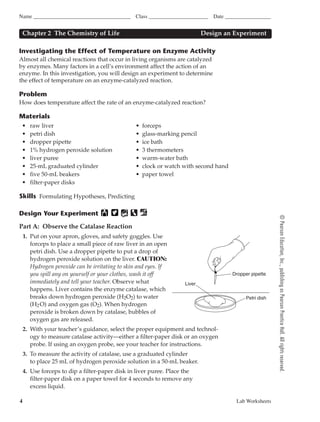
1. Put on your apron, gloves, and safety goggles. Use
forceps to place a small piece of raw liver in an open
petri dish. Use a dropper pipette to put a drop of
hydrogen peroxide solution on the liver. CAUTION:
Hydrogen peroxide can be irritating to skin and eyes. If
you spill any on yourself or your clothes, wash it off Dropper pipette
immediately and tell your teacher. Observe what Liver
happens. Liver contains the enzyme catalase, which
breaks down hydrogen peroxide (H2O2) to water Petri dish
(H2 O) and oxygen gas (O2). When hydrogen
peroxide is broken down by catalase, bubbles of
oxygen gas are released.
2. With your teacher’s guidance, select the proper equipment and technol-
ogy to measure catalase activity—either a filter-paper disk or an oxygen
probe. If using an oxygen probe, see your teacher for instructions.
3. To measure the activity of catalase, use a graduated cylinder
to place 25 mL of hydrogen peroxide solution in a 50-mL beaker.
4. Use forceps to dip a filter-paper disk in liver puree. Place the
filter-paper disk on a paper towel for 4 seconds to remove any
excess liquid.
4 Lab Worksheets
- 2. 004-007_CH02 5/16/06 12:48 PM Page 5
Name ____________________________________ Class ______________________ Date _________________
5. Use the forceps to place the filter-paper disk at the bottom of the
beaker of hydrogen peroxide solution. Observe the filter-paper disk,
and record the number of seconds it takes to float to the top of the
liquid. Number of seconds: _________
Part B: Design an Experiment
6. Formulating Hypotheses Use your observation and knowledge to
develop a hypothesis. Develop a hypothesis about how temperature
will affect the rate at which catalase breaks down hydrogen
peroxide. Record your hypothesis.
Hypothesis: ______________________________________________________________________
7. Designing Experiments Design an experiment to test your
hypothesis. Your experimental plan should include a prediction of the
result based on your hypothesis as well as any appropriate controls
and replications (repetitions). Be sure to identify all manipulated,
responding, and controlled variables in your experimental plan.
Include any necessary safety precautions and safety equipment in
your plan. If more space is needed, use a separate sheet of paper.
Prediction of Result: ______________________________________________________________
Experimental Plan: _______________________________________________________________
© Pearson Education, Inc., publishing as Pearson Prentice Hall. All rights reserved.
8. As you plan your investigative procedures, refer to the Lab Tips box
on page 55 in your textbook for information on demonstrating safe
practices, making wise choices in the use of materials, and selecting
equipment and technology.
Lab Worksheets 5
- 3. 004-007_CH02 5/16/06 12:48 PM Page 6
Name ____________________________________ Class ______________________ Date _________________
9. Construct a data table similar to the one below in which to record the
results of your experiment. Perform your experiment only after you
have obtained your teacher’s approval of your plan. Use a separate
sheet of paper if you need more room.
Data Table
Temperature (؇F) Time (secs) Observations
10. Make a graph of the results of your experiment. Plot temperature on
the x-axis and the variable by which you measured catalase activity on
the y-axis. With your teacher’s guidance, select the proper equipment
and technology to use—either graph paper or a graphing calculator.
Analyze and Conclude
1. Inferring How does the time required for a catalase-soaked filter-
paper disk to float reflect the amount of catalase activity in the
© Pearson Education, Inc., publishing as Pearson Prentice Hall. All rights reserved.
solution?
2. Inferring How did temperature affect catalase activity? Was your
prediction confirmed?
3. Drawing Conclusions Many mammals, including cattle and pigs,
have body temperatures close to 37ЊC. Does your graph indicate that
catalase is most active close to that temperature? How might
mammals benefit from that relationship?
6 Lab Worksheets
- 4. 004-007_CH02 5/16/06 12:48 PM Page 7
Name ____________________________________ Class ______________________ Date _________________
4. Evaluating Identify and discuss possible sources of error in your
procedure.
5. SAFETY Explain how you demonstrated safe practices when using
hydrogen peroxide.
© Pearson Education, Inc., publishing as Pearson Prentice Hall. All rights reserved.
Lab Worksheets 7