
Recommended
Recommended
More Related Content
Recently uploaded
Recently uploaded (20)
Featured
Featured (20)
Asia-Pacific fund distribution - Market intelligence: fund flows that matter - 2015 - Poster
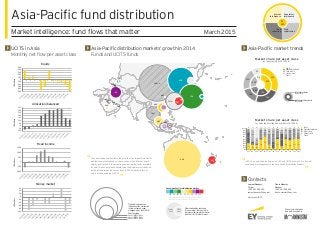
- 1. THA* AUS KOR JPN TWN ISR HKG NZL MYS SGP TUR IDN SAU PHL KWT ARE BHR QAT MAC LBN CHN*,** Asia-Pacific fund distribution Market intelligence: fund flows that matter March 2015 UCITS in Asia Monthly net flow per asset class Asia-Pacific distribution markets’ growth in 2014 Funds and UCITS funds Asia-Pacific market trends Contacts Laurent Denayer Partner +352 42 124 8340 laurent.denayer@lu.ey.com Visit ey.com/GFD France Messier Manager +352 42 124 8534 france.messier@lu.ey.com EY analysis is based on fund data provided by * No growth figure has been calculated for these markets. ** CHN and China refer to the Mainland China market. In 2014, open-ended funds grew by 12% and UCITS grew by 4% in terms of assets under management in the Asia-Pacific distribution markets. “ The heat map above illustrates the growth of the largest Asia-Pacific distribution markets based on the variation of the total net assets held by local investors in domestic and cross-border funds available for sale. The annual growth determining the bubble color is defined by the ratio between the sum of flows in 2014 and the total net assets at the beginning of 2014. “ ” ” Annual growth of local distribution markets Bubble scaling About US$500 billion About US$250 billion About US$100 billion 37% 20% 14% 20% 9% 31% 23% 16% 21% 9% Market share per asset class by investor type (12/2014) Market share per asset class for selected distribution markets (12/2014) Equity Allocation/balanced Fixed income Money market Others Retail share classes (outer circle) Institutional share classes (inner circle) Equity Allocation/balanced Fixed income Money market Others Equity -500 -400 -300 -200 -100 100 0 300 200 400 500 01/201402/201403/201404/201405/201406/201407/201408/201409/201410/201411/201412/2014 USDmillionsUS$millions Allocation/balanced -100 -50 0 50 150 100 250 200 300 350 01/201402/201403/201404/201405/201406/201407/201408/201409/201410/201411/201412/2014 USDmillionsUS$millions Fixed income -1,000 -500 0 500 1,000 1,500 01/201402/201403/201404/201405/201406/201407/201408/201409/201410/201411/201412/2014 USDmillionsUS$millions Money market -100 -80 -60 -20 -40 20 0 40 60 01/201402/201403/201404/201405/201406/201407/201408/201409/201410/201411/201412/2014 USDmillionsUS$millions 31% 24% 23% 49% 62% 22% 7% 50% 17% 50% 45% 52% 52% 52% 14% 6% 9% 5% 3% 32% 10% 60% 9% 11% 6% 8% 10% 7% 7% 38% 17% 51% 39% 30% 8% 18% 39% 41% 21% 6% 51% 20% 2% 16% 22% 20% 8% 11% 22% 18% 2% 4% 44% 2% 1% 2% 1% 2% 4% 1% 4% 1% 1%1% 0% 10% 20% 30% 40% 50% 60% 70% 80% 90% 100% AUS CHN KOR JPN TWN THA ISR HKG NZL MYS SGP ARE BHR Funds AuM UCITS AuM The bubble size gives an indication of the market size in terms of assets under management as at 12/2014. When two bubbles are shown for one market, the inner circle represents the market share and growth of UCITS in that market. -12% -9% -6% -3% 0% 3% 6% 9% 12% Regulatory intelligence Fund registration Market intelligence Fund reporting EY GFD
- 2. GFD2.0 GlobalFundDistribution EY’sglobalservicesforcross-border distributionofUCITS,AIFsandotherCIS Asia-Pacificwallchart March2015 Core Non-core EYGFDcoverage EY and Morningstar Contacts EYMorningstar AboutEY EYisagloballeaderinassurance,tax,transaction andadvisoryservices.Theinsightsandquality serviceswedeliverhelpbuildtrustandconfidence inthecapitalmarketsandineconomiestheworld over.Wedevelopoutstandingleaderswhoteamto deliveronourpromisestoallofourstakeholders. Insodoing,weplayacriticalroleinbuildinga betterworkingworldforourpeople,forourclients andforourcommunities. EYreferstotheglobalorganization,andmay refertooneormore,ofthememberfirmsof Ernst & YoungGlobalLimited,eachofwhichisa separatelegalentity.Ernst&YoungGlobalLimited, aUKcompanylimitedbyguarantee,doesnot provideservicestoclients.Formoreinformation aboutourorganization,pleasevisitey.com. ©2015EYGMLimited. AllRightsReserved. EYGno.EH0234 EDNone Thismaterialhasbeenpreparedforgeneralinformationalpurposes onlyandisnotintendedtoberelieduponasaccounting,tax,or otherprofessionaladvice.Pleaserefertoyouradvisorsforspecific advice. MorningstarEY|Assurance|Tax|Transactions|Advisory Copyright©2015Morningstar.AllRights Reserved.Theinformationcontainedherein:(1) isproprietarytoMorningstarand/oritscontent providers;(2)maynotbecopiedordistributed; and(3)isnotwarrantedtobeaccurate,complete ortimely.NeitherMorningstarnoritscontent providersareresponsibleforanydamagesor lossesarisingfromanyuseofthisinformation. Pastperformanceisnoguaranteeoffuture results. Australia Austria Bahrain Belgium Brazil Canada Chile Colombia CzechRepublic Denmark Finland France Germany HongKong Hungary India Ireland Italy Japan Luxembourg Macao Malta Mexico TheNetherlands Norway Peru Poland Portugal SaudiArabia Singapore SouthAfrica SouthKorea Spain Sweden Switzerland Taiwan Turkey UnitedArabEmirates UnitedKingdom UnitedStatesofAmerica LaurentDenayer Partner +352421248340 laurent.denayer@lu.ey.com FranceMessier Manager +352421248534 france.messier@lu.ey.com JohnBaker +35227042935 john.baker@morningstar.com TerryRosenbluth +35227042936 terry.rosenbluth@morningstar.com ForMorningstarglobaloffices,pleasevisit global.morningstar.com/contacts Tolearnmore,pleasevisit global.morningstar.com/ MorningstarAssetFlows Asset Flows by Morningstar RatingTM ($Mil) Morningstar Asset Flows by Firm Name Estimated Net Flow Net Assets Firm Name 1 Year ($Mil) ($Bil) Vanguard 98,718 165,894 Goldman Sachs 30,762 56,543 BlackRock 28,264 92,006 iShares 25,074 50,707 Dimensional 16,190 28,814 JPMorgan 13,328 48,676 Morgan Stanley 12,385 27,168 MFS 10,583 19,475 Oakmark 7,237 15,859 State Street -1,008 26,206 Date as of June 2014. Source: Morningstar, Inc. To learn more and to receive a free monthly asset flows commentary, enabling you to stay current with industry trends, please visit http://global.morningstar.com/MorningstarAssetFlows Morningstar is a leading provider of independent investment research in North America, Europe, Australia, and Asia. The company offers an extensive line of products and services for individual investors, financial advisors, asset managers, and retirement plan providers and sponsors. Morningstar provides data on approximately 473,000 investment offerings, including stocks, mutual funds, and similar vehicles, along with real-time global market data on more than 12 million equities, indexes, futures, options, commodities, and precious metals, in addition to foreign exchange and Treasury markets. Morningstar also offers investment management services through its investment advisory subsidiaries and had approximately $169 billion in assets under advisement and management as of June 30, 2014. The company has operations in 27 countries. Morningstar Asset Flows Data Service Morningstar launched its asset flows data service, a tool for monitoring current asset flows and market share data, in March 2009. Morningstar’s asset flows data service enables industry professionals to review fund flows by sector, fund type, fund group, and legal structure to analyse investment trends and investor sentiment across the asset management industry. It is available within Morningstar Direct,TM the company’s global institutional research platform, as well as Morningstar’s data feed solution, Morningstar Licensed Data. Morningstar also provides bespoke asset flow datasets (for specific regions) including: By firm: Compare inflows and outflows of a bespoke list of asset managers. By individual firm fund flows: Diagnose month by month fund flows by asset manager. By asset curve: Analyse fund flows between equity, fixed income, alternative, allocation and money market funds. By investor reaction: Use fund flows to assess investor response to major market events. By country: Compare UK investor habits with a variety of domiciles including, Australia, France, Germany, Italy, Spain, Sweden, Switzerland, and the United States. Morningstar, Inc. ©2014 Morningstar, Inc. All rights reserved. The Morningstar name and logo are registered marks of Morningstar. Marks used in conjunction with Morningstar products or services are the property of Morningstar or its subsidiaries. 3 3 3 3 3 195,413 309,159QQQQQ QQQQ QQQ QQ Q -32,783 -122,897 -92,539 EY’s global fund flow trends and analysis are powered by fund data provided by Morningstar. The EY Global Fund Distribution reports use EY’s proprietary methodology, developed to offer a unique perspective on global fund flows, that also considers SRRI volatility levels, TER bands, fund categories and more. By looking beyond changes in total net assets to looking at estimated fund flows, asset managers and servicers gain insight on market movements dividing fund flows into specific fund categories and investment regions. This information enables fund groups to better plan fund distribution and marketing strategies. EYandMorningstarmakenoguarantee,representationorwarranty andacceptnoresponsibilityorliability(contingentorotherwise) astotheaccuracy,suitability,timeliness,correctsequencing orcompletenessoftheinformationand/ordataincludedinthis publication. Theinformationcontainedhereinisnotintendedtoprovide professionaladvice.Youshouldseekappropriateprofessionaladvice wherenecessarybeforetakinganyactionbasedontheinformation and/ordatacontainedinthispublication.Useofthisinformation and/ordataisatyoursolerisk. EYand/orMorningstarcannotbeheldliableformistakes,omissions, orforthepossibleeffects,resultsoroutcomeobtainedfurther totheuseofthispublicationorforanylosswhichmayarisefrom relianceonmaterialscontainedinit,whichisissuedforinformative purposesonly.Noreadershouldactonorrefrainfromactingonthe basisofanymattercontainedinthispublicationwithoutconsidering and,ifnecessary,takingappropriateadviceinrespectofhis/herown particularcircumstances. Reproductionofthispublicationinwholeorinpart,inanymedia, includingelectronicmedia,isprohibitedexceptwiththepriorwritten permissionofEY. Forcompletecoverageplease contactlaurent.denayer@lu.ey.com Fund registration Market intelligence Regulatory intelligence Helps you perform and monitor the effective registration and maintenance of your UCITS, AIFs and other CIS in each targeted jurisdiction, through our dedicated client-focused team with distribution knowledge. Provides you with country-based regulatory intelligence describing how to register your funds step-by-step and how to cope with local reporting and maintenance requirements. Provides you with country-based market intelligence and interactive market analytics responding to essential concerns you may have regarding your distribution strategy. Our Regulatory Intelligence Services • Online access to EY’s continuously updated web-based regulatory intelligence matrix, including the following information for the target distribution markets: • Local initial and subsequent registration requirements and procedures • Local maintenance requirements and procedures • Local regulatory practice • Local regulatory reporting requirements • Local legal and marketing document requirements • Local translation and publication requirements • Regulatory alerts and newsletters to keep you abreast of regulatory changes Our Market Intelligence Services • Quarterly country-based market intelligence matrix comprehensively describing the level of attractiveness of the relevant target distribution markets, including: • Local investors’ appetite for different fund products and strategies • Local distribution channels • Local sales and marketing practices • Fund flows and trends analysis supported by EY GFD dedicated business intelligence tool • Interactive market analytics enabling you to follow fund industry trends, compare markets, create your own market analysis by building charts and tables with data that matter to you Objective End-to-end services to efficiently outsource the filing of regulatory applications to regulators, collect/disseminate fund documents and manage/monitor the fund registration process. Objective Do-it-yourself practical guide to implement your distribution strategy and register your UCITS, AIFs and other CIS for public distribution or distribute your AIFs on a private placement basis. Objective • Interactive, web-based business intelligence engine to define and challenge your product development and distribution strategies • Determine which product to distribute, in which jurisdiction, to which category of investors and through which distribution channels Our Fund Registration Services • Online fund registration platform • For all markets not covered by the e-filing platforms, direct submission of application files to regulators • Centralized follow-up of cross-border application files • Ad-hoc registration- and distribution- related services • Multiple dashboards with extensive functionalities allowing you to monitor the registration status of your funds on an ongoing basis Fund reporting Provides you with a streamlined fund reporting process using a time- and cost-saving model, allowing you to enhance risk management and oversight with regard to fund reporting obligations in various jurisdictions. Provides you with an automated solution dedicated to the preparation of financial statements for all types of investment funds and related companies in various jurisdictions. Objective • Streamline the tax reporting process and reduce effort duplication by using a single provider • Reduce involvement of in-house managerial resources • Enhance risk management and oversight and provide information on legislative or practice development in the context of fund tax reporting Objective End-to-end automated service to efficiently outsource the preparation of financial statements Our Fund Tax Reporting Services • Access to an efficient and transparent operating model using an online fund tax reporting platform for both fund clients and fund administrators • Proven tax reporting platform used for coordination, data exchange, monitoring, and general ad-hoc update services • A central point of contact to coordinate the offering and senior country contacts at your disposal Our Fund Reporting Services • A central point of contact to coordinate the offering and multidisciplinary senior team with significant experience in financial statements compilation • End-to-end coordination of the reporting process including all stakeholders • Efficient and continuous monitoring following high-quality standards during the entire reporting process • Translation of the financial statements and related documentation • GAAP conversions GFD 2.0 Move with us to a new generation of distribution support services Comprehensiveand reliablemarketintelligence Centralcoordination andlocalexecution In-depthregulatory insightandleadership Customizedand dedicatedclientservice EY GFD refers to a set of innovative services developed by EY to help asset managers with the cross-border distribution and registration of their UCITS, AIFs and other CIS. It covers all key distribution markets in Europe, Asia, Latin America, Africa and the Middle East. EY GFD includes four complementary services: • Market Intelligence • Regulatory Intelligence • Fund Registration • Fund Reporting All EY GFD services are accessible through the EY GFD dedicated web platform www.eygfd.com EY GFD