SlideShare une entreprise Scribd logo
1  sur  6
Form 5: Linear Law 2.1 Line of Best Fit - Drawing lines of best fit If x and y are two variables related  linearly , then when the values of y are plotted against the values of x, a  straight line  is obtained. Graph of y against x
How is it related to the topic vector in the subtopic of addition and subtraction? Look at the next slide so that you can see the connection.
Connection  When we have two lines of best fit, we can add or subtract the lines. If the lines are linear, they can be added or subtracted whether they are parallel or non-parallel to each other.
Line of best fit The two diagrams show the line of best fit. These two lines are parallel to each other. P Q R S
We have the vector  and  . When we add  both vectors, the resultant vector is  .  Where,
[object Object],[object Object],[object Object],[object Object],[object Object],[object Object],[object Object]

Contenu connexe

Tendances

Parallel and perpendicular Lines
Parallel and perpendicular LinesParallel and perpendicular Lines
Parallel and perpendicular Lines
amymallory
 
4 4 proving lines parallel
4 4 proving lines parallel4 4 proving lines parallel
4 4 proving lines parallel
gwilson8786
 
4 2 & 4-3 parallel lines and transversals
4 2 & 4-3 parallel lines and transversals4 2 & 4-3 parallel lines and transversals
4 2 & 4-3 parallel lines and transversals
gwilson8786
 
3-6 Congruent Angles
3-6 Congruent Angles 3-6 Congruent Angles
3-6 Congruent Angles
gwilson8786
 
Day 13-3: Similar Polygons
Day 13-3: Similar PolygonsDay 13-3: Similar Polygons
Day 13-3: Similar Polygons
Kate Nowak
 
Geom 3point4and5
Geom 3point4and5Geom 3point4and5
Geom 3point4and5
herbison
 

Tendances (18)

Parallel and perpendicular Lines
Parallel and perpendicular LinesParallel and perpendicular Lines
Parallel and perpendicular Lines
 
Matrices
MatricesMatrices
Matrices
 
Baru matrices
Baru matricesBaru matrices
Baru matrices
 
4 4 proving lines parallel
4 4 proving lines parallel4 4 proving lines parallel
4 4 proving lines parallel
 
4 2 & 4-3 parallel lines and transversals
4 2 & 4-3 parallel lines and transversals4 2 & 4-3 parallel lines and transversals
4 2 & 4-3 parallel lines and transversals
 
3-6 Congruent Angles
3-6 Congruent Angles 3-6 Congruent Angles
3-6 Congruent Angles
 
คาบ 3 4
คาบ 3 4คาบ 3 4
คาบ 3 4
 
Day 13-3: Similar Polygons
Day 13-3: Similar PolygonsDay 13-3: Similar Polygons
Day 13-3: Similar Polygons
 
Integers
IntegersIntegers
Integers
 
Matrices
MatricesMatrices
Matrices
 
Matrices and its applications
Matrices and its applicationsMatrices and its applications
Matrices and its applications
 
7.5 proportions in triangles
7.5 proportions in triangles7.5 proportions in triangles
7.5 proportions in triangles
 
Tmp2023
Tmp2023Tmp2023
Tmp2023
 
Geom 3point4and5
Geom 3point4and5Geom 3point4and5
Geom 3point4and5
 
Matrices
MatricesMatrices
Matrices
 
7 2
7 27 2
7 2
 
Line and Angles
Line and AnglesLine and Angles
Line and Angles
 
Algebra 2 Section 2-2
Algebra 2 Section 2-2Algebra 2 Section 2-2
Algebra 2 Section 2-2
 

En vedette (7)

Topic 1
Topic 1 Topic 1
Topic 1
 
Linear Equations
Linear EquationsLinear Equations
Linear Equations
 
Workforce Management Survey 2010
Workforce Management Survey 2010Workforce Management Survey 2010
Workforce Management Survey 2010
 
Appendix 1 baru
Appendix 1 baruAppendix 1 baru
Appendix 1 baru
 
FORM 3 & FORM 4
FORM 3 & FORM 4FORM 3 & FORM 4
FORM 3 & FORM 4
 
Topic 3
Topic 3Topic 3
Topic 3
 
Topic 1 math (3)
Topic 1 math (3)Topic 1 math (3)
Topic 1 math (3)
 

Similaire à Vector

correlation and r3433333333333333333333333333333333333333333333333egratio111n...
correlation and r3433333333333333333333333333333333333333333333333egratio111n...correlation and r3433333333333333333333333333333333333333333333333egratio111n...
correlation and r3433333333333333333333333333333333333333333333333egratio111n...
Ghaneshwer Jharbade
 
Stats 3000 Week 2 - Winter 2011
Stats 3000 Week 2 - Winter 2011Stats 3000 Week 2 - Winter 2011
Stats 3000 Week 2 - Winter 2011
Lauren Crosby
 
Correlation and Regression
Correlation and RegressionCorrelation and Regression
Correlation and Regression
Shubham Mehta
 
5 6 Scatter Plots & Best Fit Lines
5 6 Scatter Plots & Best Fit Lines5 6 Scatter Plots & Best Fit Lines
5 6 Scatter Plots & Best Fit Lines
Bitsy Griffin
 
IDS.pdf
IDS.pdfIDS.pdf
Statistical Relationships
Statistical RelationshipsStatistical Relationships
Statistical Relationships
mandrewmartin
 

Similaire à Vector (20)

Line & Angles
Line & AnglesLine & Angles
Line & Angles
 
Scatter diagram
Scatter diagramScatter diagram
Scatter diagram
 
R linear regression
R   linear regressionR   linear regression
R linear regression
 
Line and Angles I
Line and Angles ILine and Angles I
Line and Angles I
 
Line & Angles 1
Line & Angles 1Line & Angles 1
Line & Angles 1
 
Physics 1.3 scalars and vectors
Physics 1.3 scalars and vectorsPhysics 1.3 scalars and vectors
Physics 1.3 scalars and vectors
 
Presentation on textile mathematics
Presentation on textile mathematicsPresentation on textile mathematics
Presentation on textile mathematics
 
Form 3 and Form 4
Form 3 and Form 4Form 3 and Form 4
Form 3 and Form 4
 
correlation and r3433333333333333333333333333333333333333333333333egratio111n...
correlation and r3433333333333333333333333333333333333333333333333egratio111n...correlation and r3433333333333333333333333333333333333333333333333egratio111n...
correlation and r3433333333333333333333333333333333333333333333333egratio111n...
 
Stats 3000 Week 2 - Winter 2011
Stats 3000 Week 2 - Winter 2011Stats 3000 Week 2 - Winter 2011
Stats 3000 Week 2 - Winter 2011
 
Chapter#8
Chapter#8Chapter#8
Chapter#8
 
S1 pb
S1 pbS1 pb
S1 pb
 
Correlation and Regression
Correlation and RegressionCorrelation and Regression
Correlation and Regression
 
MCA_UNIT-4_Computer Oriented Numerical Statistical Methods
MCA_UNIT-4_Computer Oriented Numerical Statistical MethodsMCA_UNIT-4_Computer Oriented Numerical Statistical Methods
MCA_UNIT-4_Computer Oriented Numerical Statistical Methods
 
Correlation and regression
Correlation and regressionCorrelation and regression
Correlation and regression
 
5 6 Scatter Plots & Best Fit Lines
5 6 Scatter Plots & Best Fit Lines5 6 Scatter Plots & Best Fit Lines
5 6 Scatter Plots & Best Fit Lines
 
IDS.pdf
IDS.pdfIDS.pdf
IDS.pdf
 
SCATTER PLOTS
SCATTER PLOTSSCATTER PLOTS
SCATTER PLOTS
 
Maths presentation
Maths presentationMaths presentation
Maths presentation
 
Statistical Relationships
Statistical RelationshipsStatistical Relationships
Statistical Relationships
 

Plus de fatine1232002 (19)

Appendix 2 baru
Appendix 2 baruAppendix 2 baru
Appendix 2 baru
 
Presentation1
Presentation1Presentation1
Presentation1
 
Appendix 2
Appendix 2Appendix 2
Appendix 2
 
Appendix 1
Appendix 1Appendix 1
Appendix 1
 
Topic 1
Topic 1Topic 1
Topic 1
 
Topic 3
Topic 3Topic 3
Topic 3
 
Topic 2
Topic 2Topic 2
Topic 2
 
Form 5 (variation vs
Form 5 (variation vsForm 5 (variation vs
Form 5 (variation vs
 
Baru matrices
Baru matricesBaru matrices
Baru matrices
 
Tmp2023
Tmp2023Tmp2023
Tmp2023
 
Concept Map
Concept MapConcept Map
Concept Map
 
Vector
VectorVector
Vector
 
Presentation1
Presentation1Presentation1
Presentation1
 
Form 5 (variation vs
Form 5 (variation vsForm 5 (variation vs
Form 5 (variation vs
 
Presentation1
Presentation1Presentation1
Presentation1
 
FORM 5: Linear Law
FORM 5: Linear LawFORM 5: Linear Law
FORM 5: Linear Law
 
Ratio, Rate and Proportion
Ratio, Rate and ProportionRatio, Rate and Proportion
Ratio, Rate and Proportion
 
Linear Equation
Linear EquationLinear Equation
Linear Equation
 
Tmp2023 4
Tmp2023 4Tmp2023 4
Tmp2023 4
 

Vector

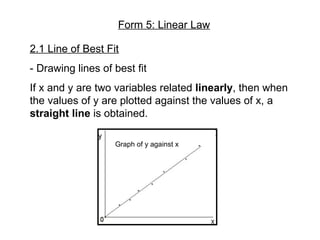
  • 1. Form 5: Linear Law 2.1 Line of Best Fit - Drawing lines of best fit If x and y are two variables related linearly , then when the values of y are plotted against the values of x, a straight line is obtained. Graph of y against x
  • 2. How is it related to the topic vector in the subtopic of addition and subtraction? Look at the next slide so that you can see the connection.
  • 3. Connection When we have two lines of best fit, we can add or subtract the lines. If the lines are linear, they can be added or subtracted whether they are parallel or non-parallel to each other.
  • 4. Line of best fit The two diagrams show the line of best fit. These two lines are parallel to each other. P Q R S
  • 5. We have the vector and . When we add both vectors, the resultant vector is . Where,
  • 6.