Best VIP Call Girls Noida Sector 18 Call Me: 8448380779
wal mart store 2001Financials
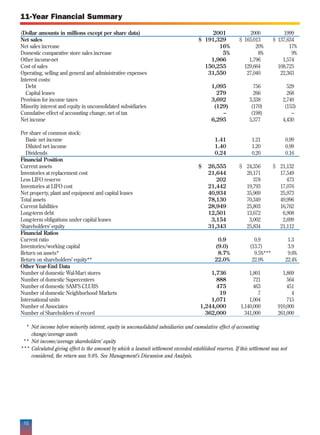
1. 11-Year Financial Summary
(Dollar amounts in millions except per share data) 2000 1999
2001
$ 165,013 $ 137,634
Net sales $ 191,329
Net sales increase 20% 17%
16%
Domestic comparative store sales increase 8% 9%
5%
Other income-net 1,796 1,574
1,966
Cost of sales 129,664 108,725
150,255
Operating, selling and general and administrative expenses 27,040 22,363
31,550
Interest costs:
Debt 756 529
1,095
Capital leases 266 268
279
Provision for income taxes 3,338 2,740
3,692
Minority interest and equity in unconsolidated subsidiaries (170) (153)
(129)
Cumulative effect of accounting change, net of tax (198) –
–
Net income 5,377 4,430
6,295
Per share of common stock:
Basic net income 1.21 0.99
1.41
Diluted net income 1.20 0.99
1.40
Dividends 0.20 0.16
0.24
Financial Position
Current assets $ 24,356 $ 21,132
$ 26,555
Inventories at replacement cost 20,171 17,549
21,644
Less LIFO reserve 378 473
202
Inventories at LIFO cost 19,793 17,076
21,442
Net property, plant and equipment and capital leases 35,969 25,973
40,934
Total assets 70,349 49,996
78,130
Current liabilities 25,803 16,762
28,949
Long-term debt 13,672 6,908
12,501
Long-term obligations under capital leases 3,002 2,699
3,154
Shareholders’ equity 25,834 21,112
31,343
Financial Ratios
Current ratio 0.9 1.3
0.9
Inventories/working capital (13.7) 3.9
(9.0)
Return on assets* 9.5%*** 9.6%
8.7%
Return on shareholders’ equity** 22.9% 22.4%
22.0%
Other Year-End Data
Number of domestic Wal-Mart stores 1,801 1,869
1,736
Number of domestic Supercenters 721 564
888
Number of domestic SAM’S CLUBS 463 451
475
Number of domestic Neighborhood Markets 7 4
19
International units 1,004 715
1,071
Number of Associates 1,140,000 910,000
1,244,000
Number of Shareholders of record 341,000 261,000
362,000
* Net income before minority interest, equity in unconsolidated subsidiaries and cumulative effect of accounting
change/average assets
** Net income/average shareholders’ equity
*** Calculated giving effect to the amount by which a lawsuit settlement exceeded established reserves. If this settlement was not
considered, the return was 9.8%. See Management’s Discussion and Analysis.
16
2. 1998 1997 1996 1995 1994 1993 1992 1991
$ 117,958 $ 104,859 $ 93,627 $ 82,494 $ 67,344 $ 55,484 $ 43,887 $ 32,602
12% 12% 13% 22% 21% 26% 35% 26%
6% 5% 4% 7% 6% 11% 10% 10%
1,341 1,319 1,146 914 645 497 404 262
93,438 83,510 74,505 65,586 53,444 44,175 34,786 25,500
19,358 16,946 15,021 12,858 10,333 8,321 6,684 5,152
555 629 692 520 331 143 113 43
229 216 196 186 186 180 153 126
2,115 1,794 1,606 1,581 1,358 1,171 945 752
(78) (27) (13) 4 (4) 4 (1) –
– – – – – – – –
3,526 3,056 2,740 2,681 2,333 1,995 1,609 1,291
0.78 0.67 0.60 0.59 0.51 0.44 0.35 0.28
0.78 0.67 0.60 0.59 0.51 0.44 0.35 0.28
0.14 0.11 0.10 0.09 0.07 0.05 0.04 0.04
$ 19,352 $ 17,993 $ 17,331 $ 15,338 $ 12,114 $ 10,198 $ 8,575 $ 6,415
16,845 16,193 16,300 14,415 11,483 9,780 7,857 6,207
348 296 311 351 469 512 473 399
16,497 15,897 15,989 14,064 11,014 9,268 7,384 5,808
23,606 20,324 18,894 15,874 13,176 9,793 6,434 4,712
45,384 39,604 37,541 32,819 26,441 20,565 15,443 11,389
14,460 10,957 11,454 9,973 7,406 6,754 5,004 3,990
7,191 7,709 8,508 7,871 6,156 3,073 1,722 740
2,483 2,307 2,092 1,838 1,804 1,772 1,556 1,159
18,503 17,143 14,756 12,726 10,753 8,759 6,990 5,366
1.3 1.6 1.5 1.5 1.6 1.5 1.7 1.6
3.4 2.3 2.7 2.6 2.3 2.7 2.1 2.4
8.5% 7.9% 7.8% 9.0% 9.9% 11.1% 12.0% 13.2%
19.8% 19.2% 19.9% 22.8% 23.9% 25.3% 26.0% 27.7%
1,921 1,960 1,995 1,985 1,950 1,848 1,714 1,568
441 344 239 147 72 34 10 9
443 436 433 426 417 256 208 148
– – – – – – – –
601 314 276 226 24 10 – –
825,000 728,000 675,000 622,000 528,000 434,000 371,000 328,000
246,000 257,000 244,000 259,000 258,000 181,000 150,000 122,000
The effects of the change in accounting method for SAM’S CLUB membership revenue recognition would not have a material
impact on this summary prior to 1998. Therefore, pro forma information as if the accounting change had been in effect for all
years presented has not been provided. See Management’s Discussion and Analysis for discussion of the impact of the accounting
change in fiscal 2000 and 1999.
The acquisition of the ASDA Group PLC and the Company’s related debt issuance had a significant impact on the fiscal 2000
amounts in this summary. See Notes 3 and 6 to the Consolidated Financial Statements.
17
3. Management’s Discussion and Analysis
Net Sales
Sales (in millions) by operating segment for the three fiscal years ended January 31, were as follows:
Fiscal Year Wal-Mart Stores SAM’S CLUB International Other Total Company Total Company Increase
from Prior Fiscal Year
2001 $121,889 $26,798 $32,100 $10,542 $191,329 16%
2000 108,721 24,801 22,728 8,763 165,013 20%
1999 95,395 22,881 12,247 7,111 137,634 17%
The Company’s sales growth of 16% in fiscal 2001, when compared to fiscal 2000, resulted from the Company’s domestic and
international expansion programs, and a domestic comparative store sales increase of 5%. The sales increase of 20% in fiscal 2000, when
compared to fiscal 1999, resulted from the Company’s expansion program, including a significant international acquisition, and a
domestic comparative store sales increase of 8%. Wal-Mart Stores and SAM’S CLUB segments include domestic units only. Wal-Mart
stores and SAM’S CLUBS located outside the United States are included in the International segment.
Costs and Expenses
For fiscal 2001, cost of sales as a percentage of sales decreased compared to fiscal 2000, resulting in increases in gross margin of 0.05%
for fiscal 2001. This improvement in gross margin occurred primarily due to a $176 million LIFO inventory benefit. This was offset by
continued price rollbacks and increased international and food sales which generally have lower gross margins than domestic general
merchandise. Cost of sales, as a percentage of sales decreased for fiscal 2000 compared to fiscal 1999, resulting in increases in gross
margin of 0.4% for fiscal 2000. The fiscal 2000 improvement in gross margin can be attributed to a favorable sales mix of higher margin
categories, improvements in shrinkage and markdowns, a favorable LIFO inventory adjustment and the slower growth of SAM’S
CLUB, which is our lowest gross margin retail operation. Management expects gross margins to narrow as food sales continue to
increase as a percentage of sales both domestically and internationally.
Operating, selling, general and administrative expenses increased 0.1% as a percentage of sales in fiscal 2001 when compared with fiscal
2000. This increase was primarily due to increased maintenance and repair costs and depreciation charges incurred during the year.
Operating, selling, general and administrative expenses increased 0.1% as a percentage of sales in fiscal 2000 when compared with fiscal
1999. This increase was primarily due to increased payroll cost incurred during the year. Additionally, in the second quarter of fiscal
2000, a $624 million jury verdict was rendered against the Company in a lawsuit. The Company settled the lawsuit for an amount less
than the jury verdict. The Company had previously established reserves related to this lawsuit, which were not material to its results of
operations or financial position. The settlement exceeded the Company’s estimated reserves for this lawsuit and resulted in a charge in
the second quarter of fiscal 2000 of $0.03 per share net of taxes.
Interest Costs
Debt interest costs increased .11% as a percentage of sales from .46% in fiscal 2000 to .57% in fiscal 2001. This increase is the result of
increased fiscal 2000 borrowings incurred as the result of the ASDA acquisition and has been somewhat offset by reductions resulting
from the Company’s inventory control efforts. For fiscal 2000, debt interest costs increased .08% as a percentage of sales from .38% in
fiscal 1999 to .46%. This increase resulted from increased fiscal 2000 borrowings as the result of the ASDA acquisition. See Note 3 of the
Notes to Consolidated Financial Statements for additional information.
Wal-Mart Stores
Sales for the Company’s Wal-Mart Stores segment increased by 12.1% in fiscal 2001 when compared to fiscal 2000 and 14.0% in fiscal
2000 when compared to fiscal 1999. The fiscal 2001 and fiscal 2000 growth are the result of comparative store sales increases and the
Company’s expansion program. Segment expansion during fiscal 2001 included the opening of 41 Wal-Mart stores, 12 Neighborhood
Markets and 167 Supercenters (including the conversion of 104 existing Wal-Mart stores into Supercenters). Segment expansion
during fiscal 2000 included the opening of 29 Wal-Mart stores, three Neighborhood Markets and 157 Supercenters (including the
conversion of 96 existing Wal-Mart stores into Supercenters).
Fiscal 2001 operating income for the segment increased by 11.5%, from $8.7 billion in fiscal 2000 to $9.7 billion in fiscal 2001. Segment
operating income as a percent of segment sales remained unchanged at 8.0% from fiscal 2000 to fiscal 2001. Operating income for fiscal
2001 was driven by margin improvements resulting from decreased markdowns and improved shrinkage. Offsetting these margin
improvements were increased distribution costs, resulting from higher fuel, utility and payroll charges and higher overall payroll costs
as a percentage of sales created by a holiday season with lower than anticipated sales. Operating income for the segment for fiscal 2000
increased by 20.2%, from $7.2 billion in fiscal 1999 to $8.7 billion in fiscal 2000. Fiscal 2000 operating income as a percentage of segment
sales was 8.0%, up from 7.6% in fiscal 1999. The improvement in operating income in 2000 was driven by margin improvements resulting
from improvements in markdowns and shrinkage. However, these margin improvements were somewhat offset by increased payroll
costs in fiscal 2000. Operating income information for fiscal years 1999 and 2000 has been reclassified to conform to the current year
presentation. For this reclassification, certain corporate expenses have been moved from the Other segment to the operating segments.
SAM’S CLUB
Sales for the Company’s SAM’S CLUB segment increased by 8.1% in fiscal 2001 when compared to fiscal 2000, and by 8.4% in fiscal 2000
when compared to fiscal 1999. The fiscal 2001 and fiscal 2000 sales growth are the result of comparative club sales increases and the
Company’s expansion program. Due to rapid growth in the International segment, SAM’S CLUB sales continued to decrease as a
percentage of total Company sales, decreasing from 15.0% in fiscal 2000 to 14.0% in fiscal 2001. Segment expansion during fiscal 2001
and 2000 consisted of the opening of 13 and 12 new clubs, respectively.
18
4. Operating income for the segment in fiscal 2001 increased by 10.8%, from $850 million in fiscal 2000 to $942 million in fiscal 2001. Due
primarily to margin improvements, operating income as a percentage of segment sales increased from 3.4% in fiscal 2000 to 3.5% in
fiscal 2001. In December 1999, the Securities and Exchange Commission issued Staff Accounting Bulletin No. 101 “Revenue Recognition
in Financial Statements” (SAB 101). SAB 101 deals with various revenue recognition issues, several of which are common within the
retail industry. As a result of the issuance of this SAB, the Company changed its method of recognizing revenues for SAM’S CLUB
membership fees effective as of the beginning of fiscal 2000. Additionally, operating income information for fiscal years 1999 and 2000
has been reclassified to conform to the current year presentation. For this reclassification certain corporate expenses have been moved
from the Other segment to the operating segments. After consideration of the reclassification and the effects of the change in
accounting method for membership revenue recognition, operating income for the segment in fiscal 2000 increased by 22.7%, from
$693 million in fiscal 1999 to $850 million in fiscal 2000. Operating income as a percentage of sales increased from 3.0% in fiscal 1999 to
3.4% in fiscal 2000. This improvement is primarily due to margin improvements. The pretax impact of the change in accounting method
would have been $57 million in fiscal 1999 and was $16 million in fiscal 2000. The impact of the accounting method change is greater on
fiscal 1999 due to an increase in the cost of SAM’S CLUB membership that occurred during that year. If the effect of this accounting
change were not considered, operating income as a percent of segment sales would have increased by 22 basis points when comparing
fiscal 1999 to fiscal 2000.
International
International sales accounted for approximately 17% of total Company sales in fiscal 2001 compared with 14% in fiscal 2000. The largest
portion of the increase in international sales is the result of the acquisition of the ASDA Group PLC (ASDA), which consisted of 229
stores when its acquisition was completed during the third quarter of fiscal 2000. International sales accounted for approximately 14% of
total Company sales in fiscal 2000 compared with 9% in fiscal 1999. The largest portion of this increase was also the result of the ASDA
acquisition. Additionally, fiscal 2000 was the first full year containing the operating results of the 74 units of the German Interspar
hypermarket chain, which were acquired in the fourth quarter of fiscal 1999.
For fiscal 2001 segment operating income increased by 36.1% from $817 million in fiscal 2000 to $1.1 billion in fiscal 2001. Segment
operating income as a percent of segment sales decreased by .13% when comparing fiscal 2000 and fiscal 2001. This decrease was
caused by the continued negative impact of store remodeling costs, costs related to the start-up of a new distribution system, excess
inventory and transition related expenses in the Company’s Germany units. Partially offsetting these negative impacts were operating
profit increases in Mexico, Canada and the United Kingdom. After consideration of the effects of the change of accounting method
for SAM’S CLUB membership revenues, the International segment’s operating income increased from $549 million in fiscal 1999 to
$817 million in fiscal 2000. The largest portion of the fiscal 2000 increase in international operating income is the result of the ASDA
acquisition. As a percent of segment sales, segment operating income decreased by .89% when comparing fiscal 1999 to fiscal 2000.
This decrease is the result of expense pressures coming from the Company’s units in Germany. The Company’s operations in Canada,
Mexico and Puerto Rico had operating income increases in fiscal 2000.
The Company’s foreign operations are comprised of wholly-owned operations in Argentina, Canada, Germany, Korea, Puerto Rico
and the United Kingdom; joint ventures in China; and majority-owned subsidiaries in Brazil and Mexico. As a result, the Company’s
financial results could be affected by factors such as changes in foreign currency exchange rates or weak economic conditions in
the foreign markets in which the Company does business. The Company minimizes exposure to the risk of devaluation of foreign
currencies by operating in local currencies and through buying forward contracts, where feasible, for certain known transactions.
In fiscal 2001, the foreign currency translation adjustment increased from the fiscal 2000 level by $229 million to $684 million,
primarily due to the dollar strengthening against the British pound and the German mark. In fiscal 2000, the foreign currency
translation adjustment decreased from the fiscal 1999 level by $54 million to $455 million primarily due to the United States dollar
weakening against the British pound and the Canadian dollar. This was partially offset by the United States dollar strengthening
against the Brazilian real.
For 2001, expansion in the International segment consisted of the opening of 77 units. Expansion in the International segment in
fiscal 2000 consisted of the opening or acquisition of 288 units. The Company also purchased an additional 6% ownership interest
in its Mexican subsidiary, Wal-Mart de Mexico S.A. de C.V. (formerly Cifra S.A. de C.V.) in fiscal 2001.
See Note 6 of Notes to Consolidated Financial Statements for additional information on acquisitions.
Liquidity and Capital Resources Cash Flows Information
Cash flows from operating activities were $9,604 million in fiscal 2001, up from $8,194 million in fiscal 2000. In fiscal 2001, the
Company invested $8,042 million in capital assets, paid dividends of $1,070 million, and had a cash outlay of $627 million primarily for
the acquisition of an additional 6% ownership in Wal-Mart de Mexico S.A. de C.V. See Note 6 of Notes to Consolidated Financial
Statements for additional information on acquisitions.
Market Risk
Market risks relating to the Company’s operations include changes in interest rates and changes in foreign exchange rates. The Company
enters into interest rate swaps to minimize the risk and costs associated with financing activities. The swap agreements are contracts to
exchange fixed or variable rates for variable or fixed interest rate payments periodically over the life of the instruments. The following
tables provide information about the Company’s derivative financial instruments and other financial instruments that are sensitive to
changes in interest rates. For debt obligations, the table presents principal cash flows and related weighted-average interest rates by
expected maturity dates. For interest rate swaps, the table presents notional amounts and interest rates by contractual maturity dates.
The applicable floating rate index is included for variable rate instruments. All amounts are stated in United States dollar equivalents.
19
5. Interest Rate Sensitivity As of January 31, 2001
Principal (Notional) Amount by Expected Maturity
Average Interest (Swap) Rate
Fair value
(Amounts in millions) 2002 2003 2004 2005 2006 Thereafter Total 1/31/01
Liabilities
US dollar denominated Long-term debt
including current portion
Fixed rate debt $ 4,223 $ 1,126 $ 809 $ 1,926 $ 750 $ 6,229 $ 15,063 $ 15,596
Average interest rate – USD rate 6.8% 6.8% 6.9% 6.9% 6.9% 6.9% 6.9%
Great Britain Pound denominated Long-term
debt including current portion
Fixed rate debt 11 236 – – – 1,425 1,672 1,670
Average interest rate 8.4% 8.4% 7.2% 7.2%
Interest Rate Derivative Financial
Instruments Related to Debt
Interest rate swap – Pay variable/receive fixed 250 – – – – 250 14
Average rate paid – Rate A
Fixed rate received – USD rate 6.9% – – – – 6.9%
Interest rate swap – Pay variable/receive fixed 250 – – – – 250 14
Average rate paid – Rate A
Fixed rate received – USD rate 6.9% – – – – 6.9%
Interest rate swap – Pay variable/receive fixed 59 63 68 72 78 41 381 17
Average rate paid – Rate B
Fixed rate received – USD rate 7.0% 7.0% 7.0% 7.0% 7.0% 7.0% 7.0%
Rate A – one month U.S. LIBOR minus .15%
Rate B – 30-day U.S. dollar commercial paper non financial
In addition to the interest rate derivative financial instruments listed in the table above, the Company holds an interest rate swap with a
notional amount of $500 million that is being marked to market through earnings. The fair value of this instrument was not significant at
January 31, 2001.
Interest Rate Sensitivity As of January 31, 2000
Principal (Notional) Amount by Expected Maturity
Average Interest (Swap) Rate
Fair value
(Amounts in millions) 2001 2002 2003 2004 2005 Thereafter Total 1/31/00
Liabilities
Long-term debt including current portion
Fixed rate debt $ 1,964 $ 2,070 $ 659 $ 742 $ 1,854 $ 8,347 $ 15,636 $ 14,992
Average interest rate – USD rate 6.9% 6.8% 6.8% 6.8% 6.8% 6.9% 6.9%
Interest Rate Derivative Financial
Instruments Related to Debt
Interest rate swap –
Pay variable/receive fixed 500 – – – – – 500 (1)
Average rate paid – Rate A plus .245%
Fixed rate received – USD rate 5.9% – – – – – 5.9%
Interest rate swap –
Pay variable/receive fixed 500 – – – – – 500 –
Average rate paid – Rate A plus .134%
Fixed rate received – USD rate 5.7% – – – – – 5.7%
Interest rate swap –
Pay variable/receive fixed 41 45 49 54 58 266 513 (7)
Average rate paid – Rate A
Fixed rate received – USD rate 7.0% 7.0% 7.0% 7.0% 7.0% 7.0% 7.0%
Interest rate paid –
Pay variable/receive fixed – – – – – 230 230 (14)
Floating rate paid – Rate B
Fixed rate received – USD rate – – – – – 7.0% 7.0%
Interest rate swap –
Pay fixed/receive variable – – – – – 151 151 (11)
Fixed rate paid – USD rate – – – – – 8.1% 8.1%
Floating rate received – Rate C
Rate A – 30-day U.S. dollar commercial paper non financial
Rate B – 6-month U.S. dollar LIBOR
Rate C – 3-month U.S. dollar LIBOR
20
6. The Company routinely enters into forward currency exchange contracts in the regular course of business to manage its exposure
against foreign currency fluctuations on cross-border purchases of inventory. These contracts are generally for durations of six months
or less. In addition, the Company holds currency swaps to hedge its net investments in Canada, Germany and the United Kingdom.
The following tables provide information about the Company’s derivative financial instruments, including foreign currency forward
exchange agreements and cross currency interest rate swap agreements by functional currency, and presents the information in United
States dollar equivalents. For foreign currency forward exchange agreements, the table presents the notional amounts and weighted
average exchange rates by contractual maturity dates. For cross currency interest rate swaps the table presents notional amounts,
exchange rates and interest rates by contractual maturity date.
Foreign Currency Exchange Rate Sensitivity As of January 31, 2001
Principal (Notional) Amount by Expected Maturity
Fair value
(Amounts in millions) 2002 2003 2004 2005 2006 Thereafter Total 1/31/2001
Forward Contracts to Sell Canadian
Dollars for Foreign Currencies
United States Dollars
Notional amount $ 63 – – – – – $ 63 $–
Average contract rate 1.5 – – – – – 1.5
Forward Contracts to Sell British
Pounds for Foreign Currencies
Hong Kong Dollars
Notional amount 52 – – – – – 52 1
Average contract rate 11.4 – – – – – 11.4
German Deutschemarks
Notional amount 86 – – – – – 33 4
Average contract rate 3.1 – – – – – 3.1
United States Dollars
Notional amount 50 – – – – – 50 1
Average contract rate 1.5 – – – – – 1.5
Other Currencies
Notional amount 42 – – – – – 42 –
Average contract rate Various – – – – – Various
Currency Swap Agreements
Payment of German Deutschemarks
Notional amount – 1,101 – – – – 1,101 186
Average contract rate – 1.8 – – – – 1.8
Fixed rate received – USD rate – 5.8% – – – – 5.8%
Fixed rate paid – DEM rate – 4.5% – – – – 4.5%
Payment of German Deutschemarks
Notional amount – – 809 – – – 809 180
Average contract rate – – 1.7 – – – 1.7
Fixed rate received – USD rate – – 5.2% – – – 5.2%
Fixed rate paid – DEM rate – – 3.4% – – – 3.4%
Payment of Great Britain Pounds
Notional amount – – – – – 4,750 4,750 659
Average contract rate – – – – – 0.6 0.6
Fixed rate received – USD rate – – – – – 7.0% 7.0%
Fixed rate paid – Great Britain Pound rate – – – – – 6.1% 6.1%
Payment of Canadian Dollars
Notional amount – – – 1,250 – – 1,250 57
Average contract rate – – – 1.5 – – 1.5
Fixed rate received – USD rate – – – 6.6% – – 6.6%
Fixed rate paid – CAD rate – – – 5.7% – – 5.7%
21
7. Foreign Currency Exchange Rate Sensitivity As of January 31, 2000
Principal (Notional) Amount by Expected Maturity
Average Interest (Swap) Rate
Fair value
(Amounts in millions) 2001 2002 2003 2004 2005 Thereafter Total 1/31/2000
Forward Contracts to Sell Canadian
Dollars for Foreign Currencies
United States Dollars
Notional amount $ 91 – – – – – $ 91 (1)
Average contract rate 1.5 – – – – – 1.5
Forward Contracts to Sell British
Pounds for Foreign Currencies
Hong Kong Dollars
Notional amount 70 – – – – – 70 1
Average contract rate 12.8 – – – – – 12.8
United States Dollars
Notional amount 40 – – – – – 40 1
Average contract rate 1.6 – – – – – 1.6
Other Currencies
Notional amount 45 – – – – – 45 (2)
Average contract rate Various – – – – – Various
Currency Swap Agreements
Payment of German Deutschemarks
Notional amount – – 1,101 – – – 1,101 90
Average contract rate – – 1.8 – – – 1.8
Fixed rate received – USD rate – – 5.8% – – – 5.8%
Fixed rate paid – DEM rate – – 4.5% – – – 4.5%
Payment of German Deutschemarks
Notional amount – – – 809 – – 809 112
Average contract rate – – – 1.7 – – 1.7
Fixed rate received – USD rate – – – 5.2% – – 5.2%
Fixed rate paid – DEM rate – – – 3.4% – – 3.4%
Payment of Great Britain Pounds
Notional amount – – – – – 3,500 3,500 (17)
Average contract rate – – – – – 0.6 0.6
Fixed rate received – USD rate – – – – – 6.9% 6.9%
Fixed rate paid – Great Britain Pound rate – – – – – 6.2% 6.2%
The fair values of the currency swap agreements are recorded in the consolidated balance sheets within the line “other assets and
deferred charges.” The increase in the asset recorded in fiscal 2001 over that recorded in fiscal 2000 is the result of an increased
amount of notional outstanding for fiscal 2001, as well as changes in currency exchange rates and market interest rates.
On February 1, 2001, the Company adopted Financial Accounting Standards Board (FASB) Statements No. 133, 137 and 138
(collectively “SFAS 133”) pertaining to the accounting for derivatives and hedging activities. SFAS 133 requires all derivatives to be
recorded on the balance sheet at fair value and establishes accounting treatment for three types of hedges: hedges of changes in the
fair value of assets, liabilities, or firm commitments; hedges of the variable cash flows of forecasted transactions; and hedges of foreign
currency exposures of net investments in foreign operations. As of January 31, 2001, the majority of the Company’s derivatives are
hedges of net investments in foreign operations, and as such, the fair value of these derivatives has been recorded on the balance sheet
as either assets or liabilities and in other comprehensive income under the current accounting guidance. As the majority of the
Company’s derivative portfolio is already recorded on the balance sheet, adoption of SFAS 133 will not have a material impact on the
Company’s Consolidated Financial Statements taken as a whole. However, assuming that the Company’s use of derivative instruments
does not change, and unless SFAS 133 is amended further, the Company believes that the application of SFAS 133 could result in more
pronounced quarterly and yearly fluctuation in earnings in future periods. Additionally, unless SFAS 133 is further amended, certain
swap cash flows currently being recorded in the income statement will be recorded in other comprehensive income after
implementation. For the fiscal year ended January 31, 2001, the Company has recorded $112 million of earnings benefit from the
receipt of these cash flows.
Company Stock Purchase and Common Stock Dividends
In fiscal 2001 and 2000, the Company repurchased over 4 million and 2 million shares of its common stock for $193 million and
$101 million, respectively. The Company paid dividends totaling $.24 per share in fiscal 2001. In March 2001, the Company increased
its dividend 17% to $.28 per share for fiscal 2002. The Company has increased its dividend every year since its first declared dividend
in March 1974.
22
8. Borrowing Information
At January 31, 2001, the Company had committed lines of credit with 78 firms and banks, aggregating $5,032 million, which were used
to support commercial paper. These lines of credit and their anticipated cyclical increases combined with commercial paper borrowings
should be sufficient to finance the seasonal buildups in merchandise inventories and other cash requirements. If the operating cash
flow generated by the Company is not sufficient to pay the increased dividend and to fund all capital expenditures, the Company
anticipates funding any shortfall in these expenditures with a combination of commercial paper and long-term debt. The Company
plans to refinance existing long-term debt as it matures and may desire to obtain additional long-term financing for other uses of cash
or for strategic reasons. The Company anticipates no difficulty in obtaining long-term financing in view of an excellent credit rating and
favorable experiences in the debt market in the recent past. During fiscal 2001, the Company issued $3.7 billion of debt. The proceeds
from the issuance of this debt were used to reduce short-term borrowings. After the $3.7 billion of debt issued in fiscal 2001, the
Company is permitted to sell up to $1.4 billion of public debt under shelf registration statements previously filed with the United States
Securities and Exchange Commission.
At January 31, 2001, the Company’s ratio of debt to total capitalization, including commercial paper borrowings, was 41.6%.
Management’s objective is to maintain a debt to total capitalization ratio of approximately 40%.
Expansion
Domestically, the Company plans to open approximately 40 new Wal-Mart stores and approximately 170 to 180 new Supercenters in
fiscal 2002. Relocations or expansions of existing discount stores will account for 100 to 110 of the new Supercenters, with the balance
being new locations. The Company plans to further expand its Neighborhood Market concept by adding 15 to 20 units during fiscal
2002. The SAM’S CLUB segment plans to open 40 to 50 Clubs during fiscal 2002, approximately half of which will be relocations or
expansions of existing clubs. The SAM’S segment will also continue its remodeling program, with approximately 80 projects expected
during fiscal 2002. In order to serve these and future developments, the Company plans to construct seven new distribution centers in
the next fiscal year. Internationally, the Company plans to open 100 to 110 units. Projects are scheduled to open in each of the existing
countries, and will include new stores and clubs as well as relocations of a few existing units. The units also include several restaurants,
department stores and supermarkets in Mexico. In addition, the Company’s German operation will continue to remodel the acquired
hypermarkets. Total Company planned growth represents approximately 40 million square feet of net additional retail space. Total
planned capital expenditures for fiscal 2002 approximate $9 billion. The Company plans to finance our expansion primarily with
operating cash flows and commercial paper borrowings.
Forward-Looking Statements
The Private Securities Litigation Reform Act of 1995 provides a safe harbor for forward-looking statements made by or on behalf of the
Company. Certain statements contained in Management’s Discussion and Analysis, in other parts of this report and in other Company
filings are forward-looking statements. These statements discuss, among other things, expected growth, future revenues, future cash
flows and future performance. The forward-looking statements are subject to risks and uncertainties including but not limited to the
cost of goods, competitive pressures, inflation, consumer debt levels, currency exchange fluctuations, trade restrictions, changes in
tariff and freight rates, interest rate fluctuations and other capital market conditions, and other risks indicated in the Company’s filings
with the United States Securities and Exchange Commission. Actual results may materially differ from anticipated results described in
these statements.
23
9. Consolidated Statements of Income
(Amounts in millions except per share data)
Fiscal years ended January 31, 2000 1999
2001
Revenues:
Net sales $ 165,013 $ 137,634
$ 191,329
Other income-net 1,796 1,574
1,966
166,809 139,208
193,295
Costs and Expenses:
Cost of sales 129,664 108,725
150,255
Operating, selling and general and administrative expenses 27,040 22,363
31,550
Interest Costs:
Debt 756 529
1,095
Capital leases 266 268
279
157,726 131,885
183,179
Income Before Income Taxes, Minority Interest and
9,083 7,323
Cumulative Effect of Accounting Change 10,116
Provision for Income Taxes
Current 3,476 3,380
3,350
Deferred (138) (640)
342
3,338 2,740
3,692
Income Before Minority Interest and
5,745 4,583
Cumulative Effect of Accounting Change 6,424
(129) (170) (153)
Minority Interest
5,575 4,430
Income Before Cumulative Effect of Accounting Change 6,295
(198) –
Cumulative Effect of Accounting Change, net of tax benefit of $119 –
$ 5,377 $ 4,430
Net Income $ 6,295
Net Income Per Common Share:
Basic Net Income Per Common Share:
Income before cumulative effect of accounting change $ 1.25 $ 0.99
$ 1.41
Cumulative effect of accounting change, net of tax (0.04) –
–
$ 1.21 $ 0.99
Net Income Per Common Share $ 1.41
4,451 4,464
Average Number of Common Shares 4,465
Diluted Net Income Per Common Share:
Income before cumulative effect of accounting change $ 1.25 $ 0.99
$ 1.40
Cumulative effect of accounting change, net of tax (0.04) –
–
$ 1.20 $ 0.99
Net Income Per Common Share $ 1.40
4,474 4,485
Average Number of Common Shares 4,484
Pro forma amounts assuming accounting change had been in
effect in fiscal 2001, 2000 and 1999:
Net Income $ 5,575 $ 4,393
$ 6,295
Net income per common share, basic $ 1.25 $ 0.98
$ 1.41
Net income per common share, diluted $ 1.25 $ 0.98
$ 1.40
See accompanying notes.
24
10. Consolidated Balance Sheets
(Amounts in millions)
January 31, 2000
2001
Assets
Current Assets:
Cash and cash equivalents $ 1,856
$ 2,054
Receivables 1,341
1,768
Inventories
At replacement cost 20,171
21,644
Less LIFO reserve 378
202
Inventories at LIFO cost 19,793
21,442
Prepaid expenses and other 1,366
1,291
24,356
Total Current Assets 26,555
Property, Plant and Equipment, at Cost:
Land 8,785
9,433
Building and improvements 21,169
24,537
Fixtures and equipment 10,362
12,964
Transportation equipment 747
879
41,063
47,813
Less accumulated depreciation 8,224
10,196
Net property, plant and equipment 32,839
37,617
Property Under Capital Lease:
Property under capital lease 4,285
4,620
Less accumulated amortization 1,155
1,303
Net property under capital leases 3,130
3,317
Other Assets and Deferred Charges:
Net goodwill and other acquired intangible assets 9,392
9,059
Other assets and deferred charges 632
1,582
$ 70,349
Total Assets $ 78,130
Liabilities and Shareholders’ Equity
Current Liabilities:
Commercial paper $ 3,323
$ 2,286
Accounts payable 13,105
15,092
Accrued liabilities 6,161
6,355
Accrued income taxes 1,129
841
Long-term debt due within one year 1,964
4,234
Obligations under capital leases due within one year 121
141
25,803
Total Current Liabilities 28,949
Long-Term Debt 13,672
12,501
Long-Term Obligations Under Capital Leases 3,002
3,154
Deferred Income Taxes and Other 759
1,043
Minority Interest 1,279
1,140
Shareholders’ Equity
Preferred stock ($0.10 par value; 100 shares authorized, none issued)
Common stock ($0.10 par value; 11,000 shares authorized, 4,470
and 4,457 issued and outstanding in 2001 and 2000, respectively) 446
447
Capital in excess of par value 714
1,411
Retained earnings 25,129
30,169
Other accumulated comprehensive income (455)
(684)
25,834
Total Shareholders’ Equity 31,343
$ 70,349
Total Liabilities and Shareholders’ Equity $ 78,130
See accompanying notes.
25
11. Consolidated Statements of Shareholders’ Equity
Other
Capital in accumulated
Number Common excess of Retained comprehensive
(Amounts in millions except per share data) of shares stock par value earnings income Total
2,241 $ 224 $ 585 $ 18,167 ($ 473) $ 18,503
Balance – January 31, 1998
Comprehensive Income
Net income 4,430 4,430
Other accumulated comprehensive income
Foreign currency translation adjustment (36) (36)
Total Comprehensive Income $ 4,394
Cash dividends ($.16 per share) (693) (693)
Purchase of Company stock (21) (2) (37) (1,163) (1,202)
Two-for-one stock split 2,224 223 (223) –
Stock options exercised and other 4 110 110
4,448 445 435 20,741 (509) 21,112
Balance – January 31, 1999
Comprehensive Income
Net income 5,377 5,377
Other accumulated comprehensive income
Foreign currency translation adjustment 54 54
Total Comprehensive Income $ 5,431
Cash dividends ($.20 per share) (890) (890)
Purchase of Company stock (2) (2) (99) (101)
Stock options exercised and other 11 1 281 282
4,457 446 714 25,129 (455) 25,834
Balance – January 31, 2000
Comprehensive Income
Net income 6,295 6,295
Other accumulated comprehensive income
Foreign currency translation adjustment (229) (229)
Total Comprehensive Income $ 6,066
Cash dividends ($.24 per share) (1,070) (1,070)
Purchase of Company stock (4) (8) (185) (193)
Issuance of Company stock 11 1 580 581
Stock options exercised and other 6 125 125
4,470 $ 447 $ 1,411 $ 30,169 ($ 684) $ 31,343
Balance – January 31, 2001
See accompanying notes.
26
12. Consolidated Statements of Cash Flows
(Amounts in millions)
Fiscal years ended January 31, 2000 1999
2001
Cash flows from operating activities
Net Income $ 5,377 $ 4,430
$ 6,295
Adjustments to reconcile net income to net cash
provided by operating activities:
Depreciation and amortization 2,375 1,872
2,868
Cumulative effect of accounting change, net of tax 198 –
–
Increase in accounts receivable (255) (148)
(422)
Increase in inventories (2,088) (379)
(1,795)
Increase in accounts payable 1,849 1,108
2,061
Increase in accrued liabilities 1,015 1,259
11
Deferred income taxes (138) (640)
342
Other (139) 78
244
Net cash provided by operating activities 8,194 7,580
9,604
Cash flows from investing activities
Payments for property, plant and equipment (6,183) (3,734)
(8,042)
Investment in international operations (net of cash acquired,
$195 million in Fiscal 2000) (10,419) (855)
(627)
Other investing activities (244) 171
(45)
Net cash used in investing activities (16,846) (4,418)
(8,714)
Cash flows from financing activities
Increase/(decrease) in commercial paper 4,316 –
(2,022)
Proceeds from issuance of long-term debt 6,000 536
3,778
Purchase of Company stock (101) (1,202)
(193)
Dividends paid (890) (693)
(1,070)
Payment of long-term debt (863) (1,075)
(1,519)
Payment of capital lease obligations (133) (101)
(173)
Proceeds from issuance of common stock – –
581
Other financing activities 224 (221)
176
Net cash provided by (used in) financing activities 8,553 (2,756)
(442)
Effect of exchange rate changes on cash 76 26
(250)
Net increase/(decrease) in cash and cash equivalents (23) 432
198
Cash and cash equivalents at beginning of year 1,879 1,447
1,856
Cash and cash equivalents at end of year $ 1,856 $ 1,879
$ 2,054
Supplemental disclosure of cash flow information
Income tax paid $ 2,780 $ 3,458
$ 3,509
Interest paid 849 805
1,319
Capital lease obligations incurred 378 347
576
Property, plant and equipment acquired with debt 65 –
–
ASDA acquisition cost satisfied with debt 264 –
–
ASDA acquisition cost satisfied with Company stock 175 –
–
See accompanying notes.
27
13. Notes to Consolidated Financial Statements
1 Summary of Significant Accounting Policies
Consolidation
The consolidated financial statements include the accounts of subsidiaries. Significant intercompany transactions have been
eliminated in consolidation.
Cash and cash equivalents
The Company considers investments with a maturity of three months or less when purchased to be cash equivalents.
Inventories
The Company uses the retail last-in, first-out (LIFO) method for the Wal-Mart Stores segment, cost LIFO for the SAM’S CLUB
segment, and other cost methods, including the retail first-in, first-out (FIFO) and average cost methods, for the International
segment. Inventories are not recorded in excess of market value.
Pre-opening costs
The costs of start-up activities, including organization costs, are expensed as incurred.
Interest during construction
In order that interest costs properly reflect only that portion relating to current operations, interest on borrowed funds during the
construction of property, plant and equipment is capitalized. Interest costs capitalized were $93 million, $57 million, and $41 million
in 2001, 2000 and 1999, respectively.
Financial Instruments
The Company uses derivative financial instruments for purposes other than trading to reduce its exposure to fluctuations in
foreign currencies and to minimize the risk and cost associated with financial and global operating activities. Contracts that
effectively meet risk reduction and correlation criteria are recorded using hedge accounting. Unrealized gains and losses
resulting from market movements are not recognized. Hedges of firm commitments are deferred and recognized when the
hedged transaction occurs.
Advertising costs
Advertising costs are expensed as incurred and were $574 million, $523 million and $405 million in 2001, 2000 and 1999,
respectively.
Operating, selling and general and administrative expenses
Buying, warehousing and occupancy costs are included in operating, selling and general and administrative expenses.
Depreciation and amortization
Depreciation and amortization for financial statement purposes are provided on the straight-line method over the estimated useful
lives of the various assets. Depreciation expense, including amortization of property under capital lease, for the years 2001, 2000
and 1999 was $2,387 million, $1,998 million and $1,648 million, respectively. For income tax purposes, accelerated methods are
used with recognition of deferred income taxes for the resulting temporary differences. Estimated useful lives for financial
statements purposes are as follows:
Building and improvements 5 – 50 years
Fixtures and equipment 5 – 12 years
Transportation equipment 2 – 5 years
Internally developed software 3 years
Costs of computer software
During fiscal 2000, the Company adopted the Accounting Standards Executive Committee Statement of Position (SOP) 98-1,
“Accounting For the Costs of Computer Software Developed For or Obtained For Internal Use.” This SOP requires the capitalization
of certain costs incurred in connection with developing or obtaining software for internal use. Previously, costs related to
developing internal-use software were expensed as incurred. Under the new method these costs are capitalized and amortized
over a three year life. The impact of the adoption of SOP 98-1 was to capitalize $27 million and $32 million of costs in fiscal 2001
and 2000, respectively, which would have previously been expensed. The impact of the change would not have a material effect
on fiscal 1999.
28
14. Accounting for derivative instruments and hedging activities
On February 1, 2001, the Company adopted Financial Accounting Standards Board (FASB) Statements No. 133, 137 and 138
(collectively “SFAS 133”) pertaining to the accounting for derivatives and hedging activities. SFAS 133 requires all derivatives to
be recorded on the balance sheet at fair value and establishes accounting treatment for three types of hedges: hedges of changes
in the fair value of assets, liabilities, or firm commitments; hedges of the variable cash flows of forecasted transactions; and hedges
of foreign currency exposures of net investments in foreign operations. As of January 31, 2001, the majority of the Company’s
derivatives are hedges of net investments in foreign operations, and as such, the fair value of these derivatives has been recorded
on the balance sheet as either assets or liabilities and in other comprehensive income under the current accounting guidance. As
the majority of the Company’s derivative portfolio is already recorded on the balance sheet, the adoption of SFAS 133 will not have
a material impact on the Company’s Consolidated Financial Statements taken as a whole.
Goodwill and other acquired intangible assets
Goodwill and other acquired intangible assets are amortized on a straight-line basis over the periods that expected economic
benefits will be provided. This amortization period ranges from 20 to 40 years. Management estimates such periods of economic
benefits using factors such as entry barriers in certain countries, operating rights and estimated lives of other operating assets
acquired. The realizability of goodwill and other intangibles is evaluated periodically when events or circumstances indicate a
possible inability to recover the carrying amount. Such evaluation is based on cash flow and profitability projections that
incorporate the impact of existing Company businesses. The analyses necessarily involve significant management judgment to
evaluate the capacity of an acquired business to perform within projections. Historically, the Company has generated sufficient
returns from acquired businesses to recover the cost of the goodwill and other intangible assets.
Long-lived assets
The Company periodically reviews long-lived assets, if indicators of impairments exist and if the value of the assets is impaired, an
impairment loss would be recognized.
Stock split
On March 4, 1999, the Company announced a two-for-one stock split in the form of a 100% stock dividend. The date of record was
March 19, 1999, and it was distributed April 19, 1999. Consequently, the stock option data and per share data for fiscal 1999 and
prior has been restated to reflect the stock split.
Net income per share
Basic net income per share is based on the weighted average outstanding common shares. Diluted net income per share is based
on the weighted average outstanding shares adjusted for the dilutive effect of stock options (19 million, 23 million and 21 million
shares in 2001, 2000 and 1999, respectively) (see note 7). The Company had approximately 2 million, .5 million and 6 million option
shares outstanding at January 31, 2001, 2000 and 1999, respectively, that were not included in the dilutive earnings per share
calculation because they would have been antidilutive.
Foreign currency translation
The assets and liabilities of all foreign subsidiaries are translated at current exchange rates and any related translation adjustments
are recorded as a component of other accumulated comprehensive income.
Estimates and assumptions
The preparation of consolidated financial statements in conformity with generally accepted accounting principles requires
management to make estimates and assumptions. These estimates and assumptions affect the reported amounts of assets and
liabilities and disclosure of contingent assets and liabilities at the date of the consolidated financial statements and the reported
amounts of revenues and expenses during the reporting period. Actual results could differ from those estimates.
New accounting pronouncement
In March 2000, the FASB issued Interpretation No. 44 (“FIN 44”), “Accounting for Certain Transactions involving Stock
Compensation - An Interpretation of APB Opinion No. 25.” FIN 44 clarifies the application of Opinion 25 for: (a) the definition of
employee for purposes of applying Opinion 25, (b) the criteria for determining whether a plan qualifies as a noncompensatory plan,
(c) the accounting consequence of various modifications to the terms of a previously fixed stock option or award, and (d) the
accounting for an exchange of stock compensation awards in a business combination. FIN 44 became effective July 1, 2000, but
certain conclusions cover specific events that occur after either December 15, 1998, or January 12, 2000. FIN 44 did not have a
material effect on the financial position or results of operations of the Company.
29
15. Accounting principle change
In December 1999, the Securities and Exchange Commission issued Staff Accounting Bulletin No. 101, “Revenue Recognition in
Financial Statements” (SAB 101). This SAB deals with various revenue recognition issues, several of which are common within
the retail industry. As a result of the issuance of SAB 101, the Company changed its method of accounting for SAM’S CLUB
membership fee revenue both domestically and internationally in fiscal 2000. Previously the Company had recognized
membership fee revenues when received. Under the new accounting method the Company recognizes membership fee revenues
over the term of the membership, which is 12 months. The Company recorded a non-cash charge of $198 million (after reduction
for income taxes of $119 million), or $.04 per share, to reflect the cumulative effect of the accounting change as of the beginning of
the fiscal year. The effect of this change on the year ended January 31, 2000, before the cumulative effect of the accounting change
was to decrease net income $12 million, or almost $.01 per share. If the new accounting method had been in effect in fiscal 1999,
net income would have been $4,393 million, or $.98 per basic or dilutive share.
The following table provides unearned revenues, membership fees received from members and the amount of revenues
recognized in earnings for each of the fiscal years ended 1999, 2000 and 2001 as if the accounting change had been in effect for
each of those years (in millions):
Deferred revenue January 31, 1998 $ 258
The Company’s deferred revenue is included in accrued Membership fees received 600
liabilities in the January 31, 2001 consolidated balance Membership revenue recognized (541)
sheet. The Company’s analysis of historical membership Deferred revenue January 31, 1999 317
fee refunds indicates that such refunds have been de Membership fees received 646
minimis. Accordingly, no reserve has been established Membership revenue recognized (626)
for membership fee refunds at January 31, 2001. Deferred revenue January 31, 2000 337
Membership fees received 706
An additional requirement of SAB 101 is that layaway Membership revenue recognized (674)
transactions be recognized upon delivery of the Deferred revenue January 31, 2001 $ 369
merchandise to the Customer rather than at the time that
the merchandise is placed on layaway. The Company offers
a layaway program that allows Customers to purchase certain items and make payments on these purchases over a specific
period. Until the first quarter of fiscal 2001, the Company recognized revenues from these layaway transactions at the time that
the merchandise was placed on layaway. During the first quarter of fiscal 2001, the Company changed its accounting method
for layaway transactions so that the revenue from these transactions is not recognized until the Customer satisfies all payment
obligations and takes possession of the merchandise. Layaway transactions are a small portion of the Company’s revenue,
therefore, due to the de minimis impact of this accounting change, prior fiscal year results have not been restated.
Revenue recognition
The Company recognizes sales revenue at the time the sale is made to the Customer, except for layaway transactions, which are
recognized when the Customer satisfies all payment obligations and takes possession of the merchandise. Effective as of the first
quarter of fiscal 2000, the Company began recognizing SAM’S CLUB membership fee revenue over the term of the membership,
which is 12 months.
Reclassifications
Certain reclassifications have been made to prior periods to conform to current presentations.
2 Defined Contribution Plans
The Company maintains profit sharing plans under which most full-time and many part-time associates become participants
following one year of employment and 401(k) plans to which associates may elect to contribute a percentage of their earnings.
During fiscal 2001 participants could contribute up to 15% of their pretax earnings, but not more than statutory limits.
The Company made annual contributions to these plans on behalf of all eligible associates, including those who have not elected to
contribute to the 401(k) plan.
Annual Company contributions are made at the sole discretion of the Company, and were $486 million, $429 million and
$388 million in 2001, 2000 and 1999, respectively.
30
16. 3 Commercial Paper and Long-term Debt
Information on short-term borrowings and interest rates is as follows (dollar amounts in millions):
Fiscal years ended January 31, 2000 1999
2001
Maximum amount outstanding at month-end $ 6,588 $ 1,976
$ 6,732
Average daily short-term borrowings 2,233 256
4,528
Weighted average interest rate 5.4% 5.1%
6.4%
At January 31, 2001, short-term borrowings consisting of $2,286 million of commercial paper were outstanding. At January 31, 2000,
short-term borrowings consisting of $3,323 million of commercial paper were outstanding. At January 31, 2001, the Company had
committed lines of $5,032 million with 78 firms and banks, which were used to support commercial paper.
Long-term debt at January 31, consist of (amounts in millions):
2000
2001
6.875% Notes due August 2009 $ 3,500
$ 3,500
6.550% Notes due August 2004 1,250
1,250
6.150% Notes due August 2001 1,250
–
8.625% Notes due April 2001 750
–
5.750% Notes due December 2030 –
714
5.875% Notes due October 2005 597
597
7.500% Notes due May 2004 500
500
7.550% Notes due February 2030 498
500
7.550% Notes due February 2030 495
500
6.875% Notes due August 2002 –
500
6.500% Notes due June 2003 454
454
7.250% Notes due June 2013 445
445
7.800% – 8.250% Obligations from sale/leaseback transactions due 2014 398
373
6.750% Notes due May 2002 300
300
7.000% – 8.000% Obligations from sale/leaseback transactions due 2013 275
257
8.500% Notes due September 2024 250
250
6.750% Notes due October 2023 250
250
8.000% Notes due September 2006 250
250
6.375% Notes due March 2003 228
228
6.750% Eurobond due May 2002 200
200
7.290% Notes due July 2006 435
324
4.410% – 10.880% Notes acquired in ASDA acquisition due 2002-2015 1,026
948
Other 321
161
$ 13,672
$ 12,501
The Company has two separate issuances of $500 million debt with imbedded put options. For the first issuance, beginning
June 2001, and each year thereafter, the holders of $500 million of the debt may require the Company to repurchase the debt
at face value, in addition to accrued and unpaid interest. The holders of the other $500 million issuance may put the debt back to
the Company at any time. Both of these issuances have been classified as a current liability in the January 31, 2001 consolidated
balance sheet.
Long-term debt is unsecured except for $155 million, which is collateralized by property with an aggregate carrying value of
approximately $327 million. Annual maturities of long-term debt during the next five years are (in millions):
Fiscal year ended January 31, Annual maturity
2002 $ 4,234
2003 1,362
2004 809
2005 1,926
2006 750
Thereafter 7,654
31
17. The Company has agreed to observe certain covenants under the terms of its note agreements, the most restrictive of which
relates to amounts of additional secured debt and long-term leases.
The Company has entered into sale/leaseback transactions involving buildings while retaining title to the underlying land. These
transactions were accounted for as financings and are included in long-term debt and the annual maturities schedules on the
previous page. The resulting obligations are amortized over the lease terms.
Future minimum lease payments for each of the five succeeding years as of January 31, 2001, are (in millions):
Fiscal year ended January 31, Minimum payments
2002 $ 94
2003 98
2004 93
2005 130
2006 94
Thereafter 499
At January 31, 2001 and 2000, the Company had letters of credit outstanding totaling $1,129 million and $902 million, respectively.
These letters of credit were issued primarily for the purchase of inventory.
Under shelf registration statements previously filed with the Securities and Exchange Commission, the Company is permitted to
issue debt securities aggregating $1.4 billion.
4 Financial Instruments
Interest rate instruments
The Company enters into interest rate swaps to minimize the risks and costs associated with its financial activities. The swap
agreements are contracts to exchange fixed or variable rate interest for variable or fixed interest rate payments periodically
over the life of the instruments. The notional amounts are used to measure interest to be paid or received and do not represent
the exposure due to credit loss. Settlements of interest rate swaps are accounted for by recording the net interest received or
paid as an adjustment to interest expense on a current basis.
Fair value Fair value
USD notional Fiscal 1/31/2001 1/31/2000
(amounts maturity Rate Rate (amounts (amounts
in millions) date received paid in millions) in millions)
Interest Rate Instruments
$ 500 2001 5.9% (USD rate) Rate A plus .245% N/A ($1)
500 2001 5.7% (USD rate) Rate A plus .134% N/A –
381 ($513 in FYE 2000) 2007 7.0% (USD rate) Rate A $ 17 (7)
250 2003 6.9% (USD rate) Rate D minus .15% 14 N/A
250 2003 6.9% (USD rate) Rate D minus .15% 14 N/A
230 2027 7.0% (USD rate) Rate B N/A (14)
151 2027 Rate C 8.1% (USD rate) N/A (11)
Rate A – 30-day U.S. dollar commercial paper non-financial
Rate B – 6-month U.S. dollar LIBOR
Rate C – 3-month U.S. dollar LIBOR
Rate D – 1-month U.S. dollar LIBOR
32