Uae-NO1 Kala Jadu specialist Expert in Pakistan kala ilam specialist Expert i...
tjx Annual Reports2001
1. T H E T J X C O M PA NI ES, IN C.
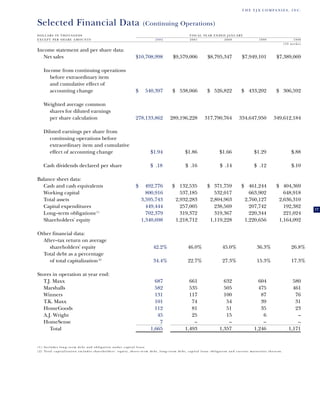
Selected Financial Data (Continuing Operations)
D OLLA RS IN THO US AN DS F IS CAL YE AR EN DE D JA NU AR Y
EX CE PT PER SHA RE A MOU NT S 2002 2001 2000 1999 1998
( 53 we ek s)
Income statement and per share data:
Net sales $10,708,998 $9,579,006 $8,795,347 $7,949,101 $7,389,069
Income from continuing operations
before extraordinary item
and cumulative effect of
accounting change $ 540,397 $ 538,066 $ 526,822 $ 433,202 $ 306,592
Weighted average common
shares for diluted earnings
per share calculation 278,133,862 289,196,228 317,790,764 334,647,950 349,612,184
Diluted earnings per share from
continuing operations before
extraordinary item and cumulative
effect of accounting change $1.94 $1.86 $1.66 $1.29 $.88
Cash dividends declared per share $ .18 $ .16 $ .14 $ .12 $.10
Balance sheet data:
Cash and cash equivalents $ 492,776 $ 132,535 $ 371,759 $ 461,244 $ 404,369
Working capital 800,916 537,185 532,017 663,902 648,918
Total assets 3,595,743 2,932,283 2,804,963 2,760,127 2,636,310
Capital expenditures 449,444 257,005 238,569 207,742 192,382 17
Long–term obligations (1) 702,379 319,372 319,367 220,344 221,024
Shareholders' equity 1,340,698 1,218,712 1,119,228 1,220,656 1,164,092
Other financial data:
After–tax return on average
shareholders' equity 42.2% 46.0% 45.0% 36.3% 26.8%
Total debt as a percentage
of total capitalization (2) 34.4% 22.7% 27.3% 15.3% 17.3%
Stores in operation at year end:
T.J. Maxx 687 661 632 604 580
Marshalls 582 535 505 475 461
Winners 131 117 100 87 76
T.K. Maxx 101 74 54 39 31
HomeGoods 112 81 51 35 23
A.J. Wright 45 25 15 6 –
HomeSense 7 – – – –
Total 1,665 1,493 1,357 1,246 1,171
( 1 ) I n c l u d e s l o n g – t e r m d e b t a n d o b li g a t i o n u n d e r c a p i t a l l e a s e .
( 2 ) To t a l c a p i t a l i z a t i o n i nc l u d e s s h a r e ho l d e r s ’ e q u i t y, s h o r t – t e r m d e b t , l o n g – t e r m d e b t, c a p it a l l e a s e ob l i g a t i o n a n d c u r r e n t m a t u r i t i e s t h e r e on .
2. T H E T J X C O M PANI E S, IN C .
Consolidated Statements of Income
F IS CAL Y EAR E ND ED
DOL LA RS IN THO USA ND S J A N U A R Y 2 6, JANUAR Y 27, JANUAR Y 29,
EX CE PT PER SHA RE A MOU NT S 2002 2001 2000
Net sales $10,708,998 $9,579,006 $8,795,347
Cost of sales, including buying and occupancy costs 8,122,922 7,188,124 6,579,400
Selling, general and administrative expenses 1,686,389 1,503,036 1,354,665
Interest expense, net 25,643 22,904 7,345
Income from continuing operations before income taxes
and cumulative effect of accounting change 874,044 864,942 853,937
Provision for income taxes 333,647 326,876 327,115
Income from continuing operations before
cumulative effect of accounting change 540,397 538,066 526,822
(Loss) from discontinued operations, net of income taxes (40,000) – –
Income before cumulative effect of accounting change 500,397 538,066 526,822
Cumulative effect of accounting change, net of income taxes – – (5,154)
Net income $ 500,397 $ 538,066 $ 521,668
Basic earnings per share:
Income from continuing operations before
cumulative effect of accounting change $1.96 $1.87 $1.67
Net income $1.82 $1.87 $1.66
Weighted average common shares — basic 275,323,741 287,440,637 314,577,145
18
Diluted earnings per share:
Income from continuing operations before
cumulative effect of accounting change $1.94 $1.86 $1.66
Net income $1.80 $1.86 $1.64
Weighted average common shares — diluted 278,133,862 289,196,228 317,790,764
Cash dividends declared per share $ .18 $ .16 $ .14
T h e a c c o m p a n yi n g n o t e s ar e a n i n t e g r a l p a r t o f t h e f i n a n c i a l s t a t e m e n t s .
3. T H E T J X C O M PA NI ES, IN C.
Consolidated Balance Sheets
JANUAR Y 2 6, JANUAR Y 27,
I N T H O U S AN D S 2002 2001
Assets
Current assets:
Cash and cash equivalents $ 492,776 $ 132,535
Accounts receivable, net 69,209 61,845
Merchandise inventories 1,456,976 1,452,877
Prepaid expenses and other current assets 84,962 74,690
Current deferred income taxes, net 12,003 43,997
Total current assets 2,115,926 1,765,944
Property at cost:
Land and buildings 144,958 133,714
Leasehold costs and improvements 880,791 704,011
Furniture, fixtures and equipment 1,210,366 984,848
2,236,115 1,822,573
Less accumulated depreciation and amortization 1,076,196 914,590
1,159,919 907,983
Property under capital lease, net of accumulated
amortization of $1,489 31,083 –
Other assets 83,139 69,976
Non–current deferred income taxes, net 26,575 3,394
Goodwill and tradename, net of amortization 179,101 184,986
Total Assets $3,595,743 $2,932,283
19
Liabilities
Current liabilities:
Current installments of long–term debt $ – $ 73
Obligation under capital lease due within one year 1,244 –
Short–term debt – 39,000
Accounts payable 761,546 645,672
Accrued expenses and other current liabilities 552,220 544,014
Total current liabilities 1,315,010 1,228,759
Other long–term liabilities 237,656 165,440
Obligation under capital lease, less portion due within one year 30,336 –
Long–term debt, exclusive of current installments 672,043 319,372
Commitments and contingencies – –
Shareholders’ Equity
Common stock, authorized 1,200,000,000 shares,
par value $1, issued and outstanding 271,537,653
and 280,378,675 shares, respectively 271,538 280,379
Additional paid–in capital – –
Accumulated other comprehensive income (loss) (6,755) (3,288)
Retained earnings 1,075,915 941,621
Total shareholders’ equity 1,340,698 1,218,712
Total Liabilities and Shareholders’ Equity $3,595,743 $2,932,283
T h e acc o mpa nyi n g no tes ar e a n i nt egra l pa rt o f t he f i nan ci al s ta te me nt s.
4. T H E T J X C O M PANI E S, IN C .
Consolidated Statements of Cash Flows
FI S CAL Y EAR E ND ED
JANUAR Y 2 6, JANUAR Y 27, J A N U A R Y 2 9,
I N T H O U S AN D S 2002 2001 2000
Cash flows from operating activities:
Net income $500,397 $538,066 $521,668
Adjustments to reconcile net income to net cash
provided by operating activities:
Loss from discontinued operations, net of tax 40,000 – –
Cumulative effect of accounting change – – 5,154
Depreciation and amortization 204,081 175,781 160,466
Property disposals and impairments 6,832 4,559 4,624
Tax benefit of employee stock options 30,644 15,941 11,736
Deferred income tax provision (benefit) 35,230 (24,235) 1,790
Changes in assets and liabilities:
(Increase) in accounts receivable (7,615) (6,501) (8,137)
(Increase) in merchandise inventories (13,292) (232,031) (26,856)
(Increase) in prepaid expenses and other current assets (1,273) (12,083) (15,519)
Increase (decrease) in accounts payable 120,770 34,158 (2,747)
Increase (decrease) in accrued expenses
and other liabilities 16,054 69,134 (35,673)
Other, net (19,382) (6,026) (21,282)
Net cash provided by operating activities 912,446 556,763 595,224
Cash flows from investing activities:
Property additions (449,444) (257,005) (238,569)
Issuance of note receivable (5,402) (23,100) (5,848)
Proceeds from sale of other assets – 9,183 –
20
Net cash (used in) investing activities (454,846) (270,922) (244,417)
Cash flows from financing activities:
Proceeds from borrowings of short–term debt, net – 39,000 –
Proceeds from borrowings of long–term debt 347,579 – 198,060
Principal payments on long–term debt (73) (100,203) (695)
Payments on short–term debt (39,000) – –
Payments on capital lease obligation (992) – –
Proceeds from sale and issuance of common stock, net 65,202 26,101 9,312
Cash payments for repurchase of common stock (424,163) (444,105) (604,560)
Cash dividends paid (48,290) (44,693) (42,739)
Net cash (used in) financing activities (99,737) (523,900) (440,622)
Effect of exchange rate changes on cash 2,378 (1,165) 330
Net increase (decrease) in cash and cash equivalents 360,241 (239,224) (89,485)
Cash and cash equivalents at beginning of year 132,535 371,759 461,244
Cash and cash equivalents at end of year $492,776 $132,535 $371,759
T h e a c c o m p a n y i n g n o t e s ar e a n i n t e g r a l p a r t o f t h e f i n a n c i a l s t a t e m e n t s .
5. T H E T J X C O M PA N I E S , I N C .
Consolidated Statements of Shareholders’ Equity
A C C U M U L AT E D
COMMON ADDITIONAL OTHER
S T O C K , PA R PAID–IN COMPREHENSIVE R E TA I N E D
I N T H O U S AN D S VA L U E $ 1 C A P I TA L I N C OM E ( L O S S ) EARNINGS T O TA L
Balance, January 30, 1999 $322,141 $ – $(1,529) $ 900,044 $1,220,656
Comprehensive income:
Net income – – – 521,668 521,668
Gain due to foreign currency
translation adjustments – – 1,134 – 1,134
(Loss) on net investment hedge contracts – – (905) – (905)
Unrealized (loss) on securities – – (133) – (133)
Total comprehensive income 521,764
Cash dividends declared on common stock – – – (43,716) (43,716)
Common stock repurchased (23,578) (20,368) – (557,314) (601,260)
Issuance of common stock under stock
incentive plans and related tax benefits 1,416 20,368 – – 21,784
Balance, January 29, 2000 299,979 – (1,433) 820,682 1,119,228
Comprehensive income:
Net income – – – 538,066 538,066
(Loss) due to foreign currency
translation adjustments – – (11,860) – (11,860)
Gain on net investment hedge contracts – – 11,547 – 11,547
Minimum pension liability adjustment – – (1,675) – (1,675)
Reclassification of prior unrealized loss
on securities – – 133 – 133
Total comprehensive income 536,211
Cash dividends declared on common stock – – – (45,266) (45,266) 21
Common stock repurchased (22,233) (40,736) – (371,861) (434,830)
Issuance of common stock under stock
incentive plans and related tax benefits 2,633 40,736 – – 43,369
Balance, January 27, 2001 280,379 – (3,288) 941,621 1,218,712
Comprehensive income:
Net income – – – 500,397 500,397
Cumulative effect of accounting
change (SFAS No. 133) – – (1,572) – (1,572)
(Loss) due to foreign currency
translation adjustments – – (8,185) – (8,185)
Gain on net investment hedge contracts – – 8,190 – 8,190
Minimum pension liability adjustment – – (2,151) – (2,151)
Amounts reclassified from other
comprehensive income to net income – – 251 – 251
Total comprehensive income 496,930
Cash dividends declared on common stock – – – (49,295) (49,295)
Common stock repurchased (13,168) (94,187) – (316,808) (424,163)
Issuance of common stock under stock
incentive plans and related tax benefits 4,327 94,187 – – 98,514
Balance, January 26, 2002 $271,538 $ – $(6,755) $1,075,915 $1,340,698
T h e a cc o m p a n yi n g n o t e s ar e a n i n t e g r a l p a r t o f t h e f i n a n c i a l s t a t e m e n t s .
6. T H E T J X C O M PANI ES , INC .
Notes to Consolidated Financial Statements
A. SUMMARY OF ACCOUNTING POLICIES
B A S I S O F P R E S E N T A T I O N : The consolidated financial statements of The TJX Companies, Inc. (TJX) include the
financial statements of all of TJX’s subsidiaries, including its foreign subsidiaries, all of which are wholly owned. All
of TJX’s activities are conducted within its subsidiaries and are consolidated in these financial statements. All inter-
company transactions have been eliminated in consolidation. The notes pertain to continuing operations except
where otherwise noted.
F I S C A L Y E A R : TJX’s fiscal year ends on the last Saturday in January. The fiscal years ended January 26, 2002 (fiscal
2002), January 27, 2001 and January 29, 2000 each included 52 weeks.
U S E O F E S T I M A T E S : The preparation of the financial statements, in conformity with accounting principles generally
accepted in the United States, requires management to make estimates and assumptions that affect the reported amounts
of assets and liabilities, and disclosure of contingent liabilities, at the date of the financial statements as well as the reported
amounts of revenues and expenses during the reporting period. TJX considers the more significant accounting policies
that involve management estimates and judgments to be those relating to inventory valuation, accounting for taxes and to
reserves for discontinued operations. Actual results could differ from those estimates.
R E V E N U E R E C O G N I T I O N : TJX records revenue at the time of sale and receipt of merchandise by the customer, net
of a reserve for estimated returns. TJX estimates returns based upon its historical experience.
C A S H , C A S H E Q U I V A L E N T S A N D S H O R T – T E R M I N V E S T M E N T S : TJX generally considers highly liquid investments
with an initial maturity of three months or less to be cash equivalents. TJX’s investments are primarily high–grade
commercial paper, institutional money market funds and time deposits with major banks. The fair value of cash
equivalents approximates carrying value. During September 1999, TJX received 693,537 common shares of Manulife
Financial Corporation (Manulife). The shares reflected ownership interest in the demutualized insurer due to poli-
cies held by TJX. These securities were recorded at market value upon receipt resulting in an $8.5 million pre–tax
gain. TJX classified the Manulife common shares as available–for–sale at January 29, 2000 and included them in
other current assets on the balance sheets. During fiscal 2001, TJX sold the Manulife shares for $9.2 million and real-
22
ized a gain of $722,000. Available–for–sale securities are stated at fair market value with unrealized gains or losses,
net of income taxes, included as a component of accumulated other comprehensive income (loss). Gains or losses
are included in net income when the securities are sold, disposed of or permanently impaired, resulting in a related
reclassification adjustment to accumulated other comprehensive income (loss).
Inventories are stated at the lower of cost or market. TJX uses the retail method for
MERCHANDIS E IN VENTORIES:
valuing inventories on the first–in first–out basis. TJX almost exclusively utilizes a permanent markdown strategy and
lowers the cost value of the inventory at the time the retail prices are lowered in its stores.
TJX’s interest expense, net was $25.6 million, $22.9 million and $7.3 million in fiscal years 2002, 2001 and
I N T E R E S T:
2000, respectively. Interest expense is presented net of interest income of $15.0 million, $11.8 million and $13.1 million
in fiscal years 2002, 2001 and 2000, respectively. TJX capitalizes interest on borrowings during the active construction
period of major capital projects. Capitalized interest is added to the cost of the related assets. TJX capitalized interest
of $222,000 and $311,000 in fiscal 2002 and 2001, respectively. No interest was capitalized in fiscal 2000.
D E P R E C I A T I O N A N D A M O R T I Z AT I O N : For financial reporting purposes, TJX provides for depreciation and
amortization of property by the use of the straight–line method over the estimated useful lives of the assets.
Buildings are depreciated over 33 years, leasehold costs and improvements are generally amortized over the lease
term (typically 10 years) or their estimated useful life, whichever is shorter, and furniture, fixtures and equip-
ment are depreciated over 3 to 10 years. Depreciation and amortization expense for property was $183.1 million
for fiscal year 2002, $169.1 million for fiscal year 2001, and $154.2 million for fiscal year 2000. Amortization
expense for property held under a capital lease was $1.5 million in fiscal year 2002. Maintenance and repairs are
charged to expense as incurred. Significant costs incurred for internally developed software are capitalized and
amortized over three to five years. Upon retirement or sale, the cost of disposed assets and the related accumu-
lated depreciation are eliminated and any gain or loss is included in net income. Debt discount and related issue
expenses are amortized to interest expense over the lives of the related debt issues or to the first date the holders
of the debt may request TJX to repurchase such debt. Pre–opening costs are expensed as incurred.
7. T H E T J X C O M PA N I E S , I N C .
Goodwill is primarily the excess of the purchase price incurred over the carrying
GOODWILL AND TR ADENAM E:
value of the minority interest in TJX’s former 83%–owned subsidiary acquired in fiscal 1990 and represents goodwill
associated with the T.J. Maxx chain. In addition, goodwill includes the excess of cost over the estimated fair market
value of the net assets of Winners acquired by TJX in fiscal 1991. Goodwill, net of amortization, totaled $71.4 million
and $74.1 million as of January 26, 2002 and January 27, 2001, respectively, and is being amortized over 40 years on
a straight–line basis. Annual amortization of goodwill was $2.6 million in fiscal years 2002, 2001 and 2000. Cumula-
tive amortization as of January 26, 2002 and January 27, 2001 was $32.9 million and $30.3 million, respectively.
Tradename is the value assigned to the name “Marshalls” as a result of TJX’s acquisition of the Marshalls chain
in fiscal 1996. The value of the tradename was determined by the discounted present value of assumed after–tax
royalty payments, offset by a reduction for its pro–rata share of the total negative goodwill acquired. The final
purchase price allocated to the tradename amounted to $128.3 million. The tradename is being amortized over 40
years. Amortization expense was $3.2 million for fiscal years 2002, 2001 and 2000. Cumulative amortization as of
January 26, 2002 and January 27, 2001 was $20.6 million and $17.4 million, respectively.
Effective with the fiscal year ended January 25, 2003, TJX will no longer amortize goodwill or the Marshalls trade-
name due to a change in accounting for intangible assets as discussed under “New Accounting Standards” below.
I M PA I R M E N T O F L O N G – L I V E D A S S E T S : TJX periodically reviews the value of its property and intangible assets in
relation to the current and expected operating results of the related business segments in order to assess whether
there has been a permanent impairment of their carrying values. An impairment exists when the undiscounted cash
flow of an asset is less than the carrying cost of that asset. Store by store impairment analysis is performed, at a
minimum, on an annual basis. TJX recorded an impairment loss of $3.1 million in fiscal 2001 as a component of the
$6.3 million estimated cost of closing its three T.K. Maxx stores in the Netherlands.
TJX expenses advertising costs as incurred. Advertising expense was $128.5 million,
A D V E RT I S IN G C OS T S:
$121.8 million and $114.7 million for fiscal years ended 2002, 2001 and 2000, respectively.
All earnings per share amounts refer to diluted earnings per share unless otherwise indi-
EAR NINGS PER SHAR E:
cated. All historical earnings per share amounts reflect the June 1998 two–for–one stock split.
TJX’s foreign assets and liabilities are
F O R EI G N C U R RE N CY T R AN S L ATI O N A N D RE LATE D HE DG I N G A CT I V I TY:
23
translated at the year–end exchange rate. Activity of the foreign operations that affect the statements of income and
cash flows are translated at the average exchange rates prevailing during the year. A large portion of TJX’s net invest-
ment in foreign operations is hedged with foreign currency forward contracts and swap agreements. The translation
adjustments associated with the foreign operations and the related hedging instruments are included in share-
holders’ equity as a component of accumulated other comprehensive income (loss). Cumulative foreign currency
translation adjustments, net of hedging activity, included in shareholders’ equity amounted to losses of $2.9 million
and $1.6 million as of January 26, 2002 and January 27, 2001, respectively.
Effective January 28, 2001, TJX implemented Statement of Financial Accounting Standards (SFAS) No. 133,
“Accounting for Derivative Instruments and Hedging Activities.” This Statement, as amended, established
accounting and reporting standards for derivative instruments, including certain derivative instruments embedded
in other contracts, and for hedging activities. This Statement requires that an entity recognize all derivatives as either
assets or liabilities in the statements of financial position and measure those instruments at fair value. This Statement
also requires that companies recognize adjustments to the fair value of derivatives in earnings when they occur, if
they do not qualify for hedge accounting. For derivatives that qualify for hedge accounting, changes in the fair value
of the derivatives can be recognized currently in earnings, along with an offsetting adjustment against the basis of
the underlying hedged item, or can be deferred in accumulated other comprehensive income.
This Statement affects the accounting for TJX’s hedging contracts. As described in Note D, TJX periodically
enters into forward foreign currency exchange contracts to hedge certain merchandise purchase commitments,
intercompany balances, including intercompany debt, and to hedge its net investment in and between foreign
subsidiaries. Through January 27, 2001, TJX applied hedge accounting to these contracts. Upon adoption of SFAS
No. 133, TJX prospectively elected not to apply the hedge accounting rules to its merchandise purchase commitment
and intercompany balance (excluding intercompany debt) related contracts, even though these contracts effectively
function as an economic hedge of the underlying exposure. Thus, the changes in fair value of the merchandise
purchase commitment and intercompany balance (excluding intercompany debt) related contracts affect earnings
in the period of change with no offset for marking the underlying exposure to fair value. TJX continues to apply
hedge accounting to its net investment hedge contracts, and changes in fair value of these contracts, as well as gains
and losses upon settlement, are recorded in accumulated other comprehensive income offsetting changes in the
8. T H E T J X C O M PA N I E S , I N C .
cumulative foreign translation adjustments of TJX’s foreign divisions. TJX also applies hedge accounting to its inter-
company debt hedge contracts and changes in fair value of these contracts are recorded in the statement of income
and offset by marking the underlying item to fair value in the same period. Upon settlement, the realized gains and
losses on these contracts are offset by the realized gains and losses of the underlying item in the statement of income.
At implementation of SFAS No. 133, the fair value of all of TJX’s hedge contracts amounted to a net asset of
$10.0 million, most of which related to net investment hedge contracts. The carrying value of all hedging contracts
before adoption was $12.8 million. TJX also wrote off a net deferred credit of $1.2 million related to premiums on
existing contracts and thus recorded a charge to accumulated other comprehensive income for the cumulative effect
of an accounting change of $1.6 million effective January 28, 2001.
In July 2001, the Financial Accounting Standards Board (FASB) issued State-
N E W A C C O U N T I N G S TA N D A R D S :
ment of Financial Accounting Standards (SFAS) No. 141, “Business Combinations,” and SFAS No. 142,
“Goodwill and Other Intangible Assets.” SFAS No. 141 requires the use of the purchase method of accounting
for all business combinations initiated after June 30, 2001, thereby eliminating use of the pooling–of–interests
method. Goodwill will no longer be amortized but will be tested for impairment. Additionally, new criteria
have been established to determine whether an acquired intangible asset should be recognized separately
from goodwill. SFAS No. 142 addresses how goodwill and other intangible assets should be accounted for after
they have been initially recognized in the financial statements. TJX is required to implement SFAS No. 142 for
the fiscal year beginning January 27, 2002 and will no longer amortize goodwill or the Marshalls tradename,
which has an indefinite life, but will periodically test them for impairment. During fiscal 2002, amortization
of goodwill and tradename amounted to $2.6 million and $3.2 million, respectively.
In July 2001, the FASB issued SFAS No. 143, “Accounting for Obligations Associated with the Retirement of
Long–Lived Assets.” The provisions of SFAS No. 143 apply to all entities that incur obligations associated with the
retirement of tangible long–lived assets. SFAS No. 143 is effective for financial statements issued for fiscal years begin-
ning after June 15, 2002 and will become effective for TJX beginning in the first quarter of fiscal 2004. This accounting
pronouncement is not expected to have a significant impact on TJX’s financial position or results of operations.
In August 2001, the FASB issued SFAS No. 144, “Accounting for the Impairment or Disposal of Long–Lived
Assets.” The objectives of SFAS No. 144 are to address the implementation of SFAS No. 121, “Accounting for the
Impairment of Long–Lived Assets and for Long–Lived Assets to Be Disposed Of,” and to develop a model for
24
long–lived assets to be disposed of by sale, whether previously held and used or newly acquired. SFAS No. 144 is
effective for financial statements issued for fiscal years beginning after December 15, 2001 and will become effec-
tive for TJX beginning in the first quarter of fiscal 2003. This accounting pronouncement is not expected to have
a significant impact on TJX’s financial position or results of operations.
Certain amounts in prior years’ financial statements have been reclassified for comparative
R E C L A S S I F I C AT I O N S :
purposes. The deferred income tax asset (liability) in the prior year’s balance sheet and selected financial data has
been reclassified into a current and non–current portion to be consistent with the current year’s presentation.
B. CHA NGE IN ACCOUN TING PRIN CIPLE
Effective January 31, 1999, TJX changed its method of accounting for layaway sales in compliance with Staff
Accounting Bulletin No. 101, “Revenue Recognition in Financial Statements,” issued by the Securities and
Exchange Commission during the fourth quarter of fiscal 2000. Under this accounting method, TJX defers recog-
nition of a layaway sale and its related profit to the accounting period when the customer receives layaway
merchandise. The cumulative effect of this change for periods prior to January 31, 1999 of $5.2 million (net of
income taxes of $3.4 million), or $.02 per share, was treated as a cumulative effect of accounting change in the
consolidated statements of income. The accounting change has virtually no impact on annual sales and earnings
in subsequent years. However, due to the seasonal influences of the business, the accounting change results in a
shift of sales and earnings among quarterly periods.
9. T H E T J X C O M PA NIES , I NC .
C. LONG–TERM DEBT AND CR EDIT LINES
The table below presents long-term debt, exclusive of current installments, as of January 26, 2002 and January 27, 2001.
Capital lease obligations are separately presented in Note E.
J A N U A R Y 2 6, JANUAR Y 27,
I N T H O U S AN D S 2002 2001
General corporate debt:
Medium term notes, interest at 5.87% on $15,000 maturing October 21, 2003
and interest at 7.97% on $5,000 maturing September 20, 2004 $ 20,000 $ 20,000
7% unsecured notes, maturing June 15, 2005 (effective interest rate of
7.02% after reduction of the unamortized debt discount of $47
and $61 in fiscal 2002 and 2001, respectively) 99,953 99,939
7.45% unsecured notes, maturing December 15, 2009 (effective interest
rate of 7.50% after reduction of unamortized debt discount of
$503 and $567 in fiscal 2002 and 2001, respectively) 199,497 199,433
Total general corporate debt 319,450 319,372
Subordinated debt:
Zero coupon convertible subordinated notes due February 13, 2021,
after reduction of unamortized debt discount of $164,907 352,593 –
Total subordinated debt 352,593 –
Long–term debt, exclusive of current installments $672,043 $319,372
The aggregate maturities of long–term debt, exclusive of current installments at January 26, 2002 are as follows:
LONG
TERM
I N T H O U S AN D S DEBT
Fiscal Year
2004 $ 15,000
2005 5,000
25
2006 99,953
2007 –
Later years 552,090
Aggregate maturities of long–term debt, exclusive of current installments $672,043
The zero coupon covertible debt securities are included in “later years” and assumes that the note holders will not
exercise the put option available to them in fiscal year 2005.
In February 2001, TJX issued $517.5 million zero coupon convertible subordinated notes due in February 2021
and raised gross proceeds of $347.6 million. The issue price of the notes represents a yield to maturity of 2% per year.
Due to provisions of the first put option on February 13, 2002, TJX amortized the debt discount assuming a 1.5% yield
for fiscal 2002. The notes are subordinated to all existing and future senior indebtedness of TJX. The notes are
convertible into 8.5 million shares of common stock of TJX if the sale price of the common stock reaches specified
thresholds, if the credit rating of the notes is below investment grade, if the notes are called for redemption or if
certain specified corporate transactions occur. The holders have the right to require TJX to purchase the notes for
$369.0 million, $391.7 million and $441.3 million on February 13, 2004, 2007 and 2013, respectively. The repurchase
amounts represent original purchase price plus accrued original issue discount. TJX may pay the purchase price in
cash, Company stock, or a combination of the two. If the holders exercise this option, TJX expects to fund the
payment with cash, financing from its short–term credit facility, new long–term borrowings or a combination thereof.
At the first put date of February 13, 2002, no holders exercised the purchase option. In addition, if a change in control
of TJX occurs on or before February 13, 2007, each holder may require TJX to purchase for cash, all or a portion of
such holder’s notes. TJX may redeem for cash all, or a portion of, the notes at any time on or after February 13, 2007
for the original purchase price plus accrued original issue discount. TJX used the proceeds to fund its accelerated
store roll–out program, investment in its distribution center network, its common stock repurchase program and for
general corporate purposes.
10. T H E T J X C O M PA N I E S , I N C .
In December 1999, TJX issued $200 million of 7.45% ten–year notes. The proceeds were used for general
corporate purposes, including TJX’s stock repurchase program.
TJX periodically enters into financial instruments to manage its cost of borrowing. In December 1999,
TJX entered into a rate–lock agreement to hedge the underlying treasury rate of the $200 million ten–year notes,
prior to their issuance. The cost of this agreement has been deferred and is being amortized to interest expense over
the term of the notes and results in an effective rate of 7.60% on the debt.
In September 1997, TJX entered into a five–year $500 million revolving credit facility. In addition, in July 2000,
TJX entered into a $250 million, 364–day revolving credit agreement which was renewed in July 2001. The agreements
have similar terms which include financial covenants requiring that TJX maintain specified fixed charge coverage and
leverage ratios. The Company’s ability to borrow under the agreements is not limited by its debt rating level. The
revolving credit facilities are used as backup to TJX’s commercial paper program. As of January 26, 2002, all $750
million of the revolving credit facilities were available for use. Interest is payable on borrowings at rates equal to or less
than prime. The maximum amount of TJX’s U.S. short–term borrowings was $39 million, $330 million and $108
million in fiscal 2002, 2001 and 2000, respectively. The weighted average interest rate on TJX’s U.S. short–term
borrowings was 5.32%, 6.82% and 6.06% in fiscal 2002, 2001 and 2000, respectively. TJX does not have any compen-
sating balance requirements under these arrangements. Subsequent to the fiscal year ended January 26, 2002, TJX
entered into new revolving credit agreements, see Note P for additional information.
TJX also has a C$20 million credit line for its Canadian subsidiary that had been fully utilized during
fiscal 2002. The maximum amount outstanding under all of its Canadian credit lines in prior years was
C$15.2 million in fiscal 2001 and C$19.2 million in fiscal 2000. Interest on its current credit line is at the
Canadian prime lending rate.
D. FINA NCIAL INST RUMENTS
Effective January 28, 2001, TJX implemented Statement of Financial Accounting Standards (SFAS) No. 133,
“Accounting for Derivative Instruments and Hedging Activities.” This Statement requires that all derivatives be
recorded on the balance sheets at fair value. See Note A for a description of TJX’s foreign currency translation and
related hedging activity policy.
TJX periodically enters into forward foreign currency exchange contracts to obtain an economic hedge on firm
U.S. dollar and Euro merchandise purchase commitments made by its foreign subsidiaries. The contracts
26
outstanding at January 26, 2002, cover certain commitments for the first and second quarters of fiscal 2003. TJX
elected not to apply hedge accounting rules to these contracts and therefore includes the change in the market value
of these derivatives in current earnings as a component of selling, general and administrative expenses.
TJX enters forward foreign currency exchange contracts to obtain an economic hedge on certain foreign inter-
company payables, primarily license fees, for which TJX elected not to apply hedge accounting rules. Such contracts
outstanding at January 26, 2002 cover intercompany payables for the first quarter of fiscal 2003. The change in fair value
of these contracts is reflected in current period earnings as a component of selling, general and administrative expenses.
TJX also has entered into several foreign currency forward and swap contracts in both Canadian dollars and British
pound sterling and accounts for them as a hedge of the investment in and between our foreign subsidiaries. Foreign
exchange gains and losses as well as fair value adjustments on the agreements are recognized in other comprehensive
income, thereby offsetting translation adjustments associated with TJX’s investment in its foreign subsidiaries.
The change in fair value of the contracts designated as a hedge of the net investment in foreign operations
resulted in a gain of $8.2 million that was credited to other comprehensive income in fiscal 2002. The change in the
cumulative foreign currency translation adjustment resulted in a loss of $8.2 million that was also included as a
component of other comprehensive income in fiscal 2002.
TJX also enters derivative contracts, designated as fair value hedges, to hedge certain foreign intercompany payables,
primarily debt and related interest. The net impact of hedging activity and these intercompany payables resulted in a loss
of $220,000 which is reflected in fiscal 2002 earnings as a component of selling, general and administrative expenses.
The fair market value of the derivatives are classified as assets or liabilities, current and non–current, depending on
the valuation results and the maturity of the individual contracts. At January 26, 2002, the majority of the contracts were
included in prepaid expenses and other current assets.
11. T H E T J X C O M PA NIES , I NC.
Following is a summary of TJX’s derivative financial instruments and related fair values, outstanding at
January 26, 2002:
BLENDED FA I R VA L U E AT
CONTRACT J A N U A R Y 2 6,
I N THOUSANDS PAY RECEIVE R AT E 2002
Fair value hedges:
Intercompany balances, primarily debt
and related interest C$128,207 U.S.$79,830 0.6227 U.S.$ 226
£ 27,415 U.S.$38,639 1.4094 U.S.$ 633
Net asset hedges: C$ 78,532 U.S.$53,667 0.6834 U.S.$3,844
£ 50,125 U.S.$75,846 1.5131 U.S.$6,029
£ 32,048 C$73,084 2.2805 U.S.$ 478
Hedge accounting not elected:
Merchandise purchase commitments and
intercompany balances, primarily license fees C$ 85,793 U.S.$54,140 0.6311 U.S.$ 855
£ 9,245 U.S.$13,200 1.4278 U.S.$ 208
£ 5,561 9,000 1.6184 U.S.$ (41)
TJX’s forward foreign currency exchange and swap contracts require TJX to make payments of certain foreign
currencies for receipt of U.S. dollars, Canadian dollars or Euros. All contracts excepting the net asset hedges mature
during fiscal 2003. The British pound net asset hedges mature during fiscal 2003, the Canadian dollar net asset
hedges have maturities from fiscal 2003 to fiscal 2005.
The counterparties to the forward exchange contracts and swap agreements are major international financial
institutions, and the contracts contain rights of offset which minimize TJX’s exposure to credit loss in the event of
nonperformance by one of the counterparties. TJX does not require counterparties to maintain collateral for these
contracts; however, TJX periodically monitors its position and the credit ratings of the counterparties and does not
anticipate losses resulting from the nonperformance of these institutions.
The fair value of TJX’s general corporate debt, including current installments, is estimated using discounted 27
cash flow analysis based upon TJX’s current incremental borrowing rates for similar types of borrowing arrange-
ments. The fair value of TJX’s zero coupon convertible subordinated notes is estimated by obtaining market quotes.
The fair value of general corporate debt, including current installments, at January 26, 2002 approximates the
carrying value of $319.5 million. The fair value of the zero coupon convertible subordinated notes is $399.4 million
versus a carrying value of $352.6 million. These estimates do not necessarily reflect certain provisions or restrictions
in the various debt agreements which might affect TJX’s ability to settle these obligations.
E. COMMITMENTS
TJX is committed under long–term leases related to its continuing operations for the rental of real estate and fixtures
and equipment. Most of TJX’s leases are store operating leases with a ten–year initial term and options to extend for one
or more five–year periods. Certain Marshalls leases, acquired in fiscal 1996, had remaining terms ranging up to
twenty–five years. Leases for T.K. Maxx are generally for fifteen to twenty–five years with ten–year kick–out options. Many
of the leases contain escalation clauses and early termination penalties. In addition, TJX is generally required to pay
insurance, real estate taxes and other operating expenses including, in some cases, rentals based on a percentage of sales.
Following is a schedule of future minimum lease payments for continuing operations as of January 26, 2002:
C A P I TA L O P E R AT I N G
I N T H O U S AN D S LEASE LEASES
Fiscal Year
2003 $ 3,726 $ 477,679
2004 3,726 451,234
2005 3,726 415,572
2006 3,726 372,335
2007 3,726 332,016
Later years 34,123 1,477,248
Total future minimum lease payments 52,753 $3,526,084
Less amount representing interest 21,173
Net present value of minimum capital lease payments $31,580
12. T H E T J X C O M PANI E S, IN C .
The capital lease commitments relate to a 283,000 square foot addition to TJX’s home office facility. Rental
payments commenced June 1, 2001, and TJX recognized a capital lease asset and related obligation equal to the
present value of the lease payments of $32.6 million.
The rental expense under operating leases for continuing operations amounted to $446.6 million, $390.6 million
and $352.6 million for fiscal years 2002, 2001 and 2000, respectively. Rent expense includes contingent rent and is net
of sublease income, both of which are immaterial. The total net present value of TJX’s minimum operating lease obli-
gations approximates $2,493.1 million as of January 26, 2002, including a current portion of $295.3 million.
TJX had outstanding letters of credit totaling $23.9 million as of January 26, 2002 and $31.6 million as of
January 27, 2001. Letters of credit are issued by TJX primarily for the purchase of inventory.
F. S T O C K C O M P E N S A T I O N P L A N S
TJX has a stock incentive plan under which options and other stock awards may be granted to its directors, officers
and key employees. This plan has been approved by TJX’s shareholders and all stock compensation awards, except
for the awards made under a deferred stock compensation plan for its outside directors discussed below, are made
under this plan. The Stock Incentive Plan, as amended with shareholder approval, provides for the issuance of up to
54.7 million shares with 16.0 million shares available for future grants as of January 26, 2002. In June 2001, share-
holders approved an amendment to the Stock Incentive Plan to provide for grants to directors and suspended future
grants of options with respect to the 38,000 shares reserved under the former Directors’ Stock Option Plan at January
27, 2001.
Under these stock option plans, TJX has granted options for the purchase of common stock, generally within
ten years from the grant date at option prices of 100% of market price on the grant date. Most options outstanding
vest over a three–year period starting one year after the grant, and are exercisable in their entirety three years after
the grant date. Options granted to directors become fully exercisable one year after the date of grant.
A summary of the status of TJX’s stock options and related Weighted Average Exercise Prices (WAEP) is
presented below (shares in thousands):
FIS C AL Y EAR E ND ED
J A N U A R Y 2 6 , 20 0 2 JANUAR Y 27 , 20 01 JANUAR Y 29 , 200 0
SHARES WAEP SHARES WA E P SHARES WA E P
Outstanding at beginning of year 14,037 $19.69 11,832 $17.06 10,105 $12.04
28
Granted 5,371 34.95 5,178 20.75 3,164 29.26
Exercised (4,216) 15.94 (2,724) 9.85 (1,275) 7.13
Forfeitures (380) 24.54 (249) 24.59 (162) 20.52
Outstanding at end of year 14,812 26.19 14,037 19.69 11,832 17.06
Options exercisable at end of year 5,797 $20.40 5,880 $15.98 5,980 $10.77
TJX realizes an income tax benefit from the exercise of stock options which results in a decrease in current income
taxes payable and an increase in additional paid–in capital. Such benefits amounted to $30.6 million, $15.9 million
and $11.7 million for the fiscal years ended January 26, 2002, January 27, 2001 and January 29, 2000, respectively.
TJX has adopted the disclosure–only provisions of the Statement of Financial Accounting Standards (SFAS) No. 123,
“Accounting for Stock–Based Compensation,” and continues to apply the provisions of Accounting Principles Board
(APB) Opinion No. 25, “Accounting for Stock Issued to Employees,” in accounting for compensation expense under its
stock option plans. TJX grants options at fair market value on the date of the grant; accordingly, no compensation expense
has been recognized for the stock options issued during fiscal years 2002, 2001 or 2000. Compensation expense deter-
mined in accordance with SFAS No. 123, net of related income taxes, would have amounted to $27.8 million, $19.2 million
and $12.9 million for fiscal 2002, 2001 and 2000, respectively. Income from continuing operations before cumulative effect
of accounting change, net income and related earnings per share amounts, presented on a pro forma basis, are as follows:
U N A U D I T E D P R O F O R MA F I S C A L Y E A R E N D E D
D OLLA RS IN THO US AND S JANUAR Y 26, JANUAR Y 27, J A N U A R Y 2 9,
EX CE PT PER SHA RE A MOU NT S 2002 2001 2000
Income from continuing operations before
cumulative effect of accounting change $512,598 $518,837 $513,862
Per diluted share $ 1.84 $ 1.79 $ 1.62
Net income $472,598 $518,837 $508,708
Per diluted share $ 1.70 $ 1.79 $ 1.60
13. T H E T J X C O M PAN IES , I NC.
For purposes of applying the provisions of SFAS No. 123 for the pro forma calculations, the fair value of each option
grant issued during fiscal 2002, 2001 and 2000 is estimated on the date of grant using the Black–Scholes option pricing
model with the following assumptions: dividend yield of .5% in fiscal 2002, 1% in fiscal 2001 and 2000, expected volatility
of 46%, 48%, and 46% in fiscal 2002, 2001 and 2000, respectively, a risk–free interest rate of 5.0% in fiscal 2002, 5.2% in
fiscal 2001 and 6.4% in fiscal 2000, and expected holding periods of six years in all fiscal periods. The weighted average
fair value of options granted during fiscal 2002, 2001 and 2000 was $16.92, $10.07 and $14.38 per share, respectively.
The following table summarizes information about stock options outstanding as of January 26, 2002 (shares in thousands):
O P T I O N S O U T S TA N D I N G O PTI O NS EXER C ISA BL E
WEIGHTED WEIGHTED WEIGHTED
AV E R A G E AV E R A G E AV E R A G E
R AN GE OF REMAINING EXERCISE EXERCISE
EX ER CI SE P RI CE S SHARES CO N TR ACT LIF E PRICE SHARES PRICE
$ 2.5625 – $ 6.3125 363 2.7 Years $ 4.73 363 $ 4.73
$ 6.3126 – $10.6875 813 4.9 Years 9.93 813 9.93
$10.6876 – $14.4688 489 5.6 Years 14.44 489 14.44
$14.4689 – $21.7500 5,250 8.2 Years 20.93 2,396 21.15
$21.7501 – $30.5000 2,576 7.6 Years 29.22 1,736 29.21
$30.5001 – $34.9500 5,321 9.6 Years 34.95 – N/A
Total 14,812 8.2 Years $26.19 5,797 $20.40
Due to the events of September 11, TJX modified certain option grants granted to the associates lost in the tragedy.
Unvested awards were vested, and the families were allowed to realize the full economic benefit of the original grants
in addition to other benefits granted to the families. The Company recorded additional compensation expense related
to these option grants and benefit modifications. The Company does not typically modify awards after the date of grant.
TJX was subject to income statement charges for changes in the fair market value of its common stock due to a
special executive deferred compensation award, granted in fiscal 1998 under the Stock Incentive Plan, that was
initially denominated in shares of TJX common stock. TJX recorded compensation expense of $1.1 million in fiscal
2000 due to the increase in market value of the shares of TJX. During fiscal 2000, all of the shares were denominated
into other investments. TJX separately transferred funds to a trust in an amount equal to the value of the new invest-
ment elections at the time such elections were made by the executive. Thus, deferred compensation obligation 29
adjustments due to the change in the executive’s deferred compensation account were offset by similar amounts due
to gains or losses on the trust assets. During July 2001, the assets in the trust were sold and the proceeds were distrib-
uted to the executive in settlement of the deferred obligation. The trust assets were included in other current assets
on the balance sheet as of January 27, 2001.
TJX has also issued restricted stock and performance–based stock awards under the Stock Incentive Plan.
Restricted stock awards are issued at par value, or at no cost, and have restrictions which generally lapse over three
years from date of grant. Performance–based shares have restrictions that generally lapse over one to three years
when and if specified criteria are met. The market value in excess of cost is charged to income ratably over the period
during which these awards vest. Such pre–tax charges amounted to $2.7 million, $1.4 million and $1.1 million in
fiscal years 2002, 2001 and 2000, respectively. The market value of the awards is determined at date of grant for
restricted stock awards and at the date shares are earned for performance–based awards.
There has been a combined total of 225,000 shares, 135,000 shares and 131,480 shares for deferred, restricted
and performance–based awards issued in the fiscal years ended January 2002, 2001 and 2000, respectively. No shares
were forfeited during the fiscal year ended January 26, 2002; there were 33,000 and 3,000 shares forfeited during the
fiscal years ended January 2001 and 2000, respectively. The weighted average market value per share of these stock
awards at grant/earned date was $30.00, $29.60 and $29.55 for fiscal 2002, 2001 and 2000, respectively.
TJX maintains a deferred stock compensation plan for its outside directors. Deferred share awards valued at
$10,000 are issued annually to each outside director. Currently, there are 20,827 deferred shares outstanding; actual
shares will be issued at retirement. TJX has 87,638 shares held in treasury from which such shares will be issued.
14. T H E T J X C O M PANI E S, IN C .
G . C A P I TA L S TO C K AN D EA R N I N GS P E R SH A R E
During fiscal 2001, TJX completed a $750 million stock repurchase program and announced a new
C A P I TA L S TO C K :
multi–year, $1 billion stock repurchase program. These stock repurchase programs followed two separate $250 million
stock repurchase programs in fiscal 1999 and 1998. TJX had cash expenditures, under all of its programs, of $424.2
million, $444.1 million and $604.6 million in fiscal 2002, 2001 and 2000, respectively, funded primarily by excess cash
generated from operations. The total common shares repurchased and retired amounted to 13.2 million shares in
fiscal 2002, 22.2 million in fiscal 2001 and 23.6 million in fiscal 2000. As of January 26, 2002, TJX has repurchased
and retired 32.7 million shares of its common stock at a cost of $805.8 million under the current $1 billion stock
repurchase program.
TJX is authorized to issue up to 5 million shares of preferred stock, par value $1. There was no preferred stock
issued or outstanding at January 26, 2002.
The following schedule presents the calculation of basic and diluted earnings per share for
EARNINGS PER SHA RE:
income from continuing operations:
F IS CAL Y EAR E NDE D
DOL LA RS IN THO USA ND S J A N U A R Y 2 6, JANUAR Y 27, JANUAR Y 29,
EX CE PT PER SHA RE A MOU NT S 2002 2001 2000
Basic earnings per share:
Income from continuing operations before
cumulative effect of accounting change $540,397 $538,066 $526,822
Weighted average common stock outstanding
for basic earnings per share calculation 275,323,741 287,440,637 314,577,145
Basic earnings per share $1.96 $1.87 $1.67
Diluted earnings per share:
Income from continuing operations before
cumulative effect of accounting change $540,397 $538,066 $526,822
Weighted average common stock outstanding
30 for basic earnings per share calculation 275,323,741 287,440,637 314,577,145
Assumed exercise of stock options and awards 2,810,121 1,755,591 3,213,619
Weighted average common shares for diluted
earnings per share calculation 278,133,862 289,196,228 317,790,764
Diluted earnings per share $1.94 $1.86 $1.66
The weighted average common shares for the diluted earnings per share calculation exclude the incremental effect
related to outstanding stock options, the exercise price of which is in excess of the related fiscal years’ average price of
TJX’s common stock. Such options are excluded because they would have an antidilutive effect. These options
amounted to 5.3 million as of January 26, 2002, 4.6 million as of January 27, 2001 and 3.1 million as of January 29, 2000.
The 8.5 million shares attributable to the zero coupon convertible debt were also excluded from the diluted earnings
per share calculation because criteria for conversion had not been met during the fiscal year.
H. INCOM E TAXES
The provision for income taxes includes the following:
FIS C AL Y EAR E ND ED
JANUAR Y 2 6, JANUAR Y 27, J A N U A R Y 2 9,
I N T H O U S AN D S 2002 2001 2000
Current:
Federal $236,070 $272,075 $255,277
State 44,228 51,217 49,836
Foreign 18,119 27,819 20,212
Deferred:
Federal 28,133 (22,359) 3,885
State 4,071 (2,269) 1,984
Foreign 3,026 393 (4,079)
Provision for income taxes $333,647 $326,876 $327,115
15. T H E T J X C O M PA NI ES, IN C.
In addition to the above provision, in fiscal 2002 TJX also recorded deferred income tax benefits of $26.5 million
as a component of the $40 million after–tax charge relating to discontinued operations (see Note L).
TJX had a net deferred tax asset as follows:
J A N U A R Y 2 6, J A N U A R Y 2 7,
I N T H O U S AN D S 2002 2001
Deferred tax assets:
Loss on investment in foreign subsidiary $ – $ 7,013
Foreign net operating loss carryforward 14,546 17,998
Reserve for discontinued operations 35,277 10,129
Reserve for closed store and restructuring costs 5,824 6,443
Pension, postretirement and employee benefits 34,493 53,487
Leases 21,076 19,455
Other 29,591 29,111
Valuation allowance – (3,396)
Total deferred tax assets 140,807 140,240
Deferred tax liabilities:
Property, plant and equipment 21,143 17,211
Safe harbor leases 13,395 16,274
Tradename 42,873 44,140
Other 24,818 15,224
Total deferred tax liabilities 102,229 92,849
Net deferred tax asset $ 38,578 $ 47,391
The fiscal 2002 total net deferred tax asset is presented on the balance sheet as a current asset of $12.0 million and
a non–current asset of $26.6 million. For fiscal 2001, these amounts are $44.0 million and $3.4 million, respectively.
TJX has, for tax purposes, repatriated the current year’s and all prior years’ earnings of its Canadian subsidiary. All
earnings of TJX’s other foreign subsidiaries are indefinitely reinvested and no deferred taxes have been provided for
on those earnings. 31
TJX has a United Kingdom operating loss carryforward of $47 million that may be applied against future
taxable income in the U.K., all of which has been recognized for financial reporting purposes. During fiscal 2002,
TJX recognized $2.3 million of tax benefits relating to the current years’ operating loss in the U.K. The U.K. net
operating loss does not expire under current tax law. Due to the closing of TJX’s Netherlands operation during
fiscal 2001, TJX recognized U.S. tax benefits associated with the write–off of its total investment in the Netherlands.
TJX also has a Puerto Rico net operating loss carryforward of approximately $1 million which was acquired in the
Marshalls acquisition and expires in fiscal 2003. The valuation allowance in fiscal 2001 relates to TJX’s Puerto Rico
net operating losses that had not been recognized and subsequently expired.
TJX’s worldwide effective income tax rate was 38.2% for the fiscal year ended January 26, 2002, 37.8% for the
fiscal year ended January 27, 2001, and 38.3% for the fiscal year ended January 29, 2000. The difference between the
U.S. federal statutory income tax rate and TJX’s worldwide effective income tax rate is reconciled below:
FIS C AL Y EAR E ND ED
JANUAR Y 2 6, JANUAR Y 27, J A N U A R Y 2 9,
2002 2001 2000
U.S. federal statutory income tax rate 35.0% 35.0% 35.0%
Effective state income tax rate 3.8 4.0 4.2
Impact of foreign operations (.4) (1.0) (1.0)
All other (.2) (.2) .1
Worldwide effective income tax rate 38.2% 37.8% 38.3%
I. PENSION PLANS AND OT HER RET IREME NT BENEFITS
TJX has a non–contributory defined benefit retirement plan covering the majority of its full–time U.S. employees.
Employees who have attained twenty–one years of age and have completed one year of service are covered under the
plan. Benefits are based on compensation earned in each year of service. TJX also has an unfunded supplemental
retirement plan which covers key employees of TJX and provides additional retirement benefits based on average
compensation; and an unfunded postretirement medical plan which provides limited postretirement medical and
life insurance benefits to employees who participate in TJX’s retirement plan and who retire at age fifty–five or older
16. T H E T J X C O M PANI E S, IN C .
with ten or more years of service. TJX’s funded defined benefit retirement plan assets are invested primarily in stock
and bonds of U.S. corporations, excluding TJX stock, as well as various investment funds.
Presented below is financial information relating to TJX’s funded defined benefit retirement plan and its unfunded
supplemental pension plan (Pension) and its unfunded postretirement medical plan for the fiscal years indicated:
PENSION POST RE TIR E MEN T M ED ICA L
FI S CAL Y EAR E ND ED FI SCA L YE AR END E D
J A N U A R Y 2 6, JANUAR Y 2 7, JANUAR Y 26, J A N U A R Y 2 7,
D OLLA RS IN THO US AN DS 2002 2001 2002 2001
Change in benefit obligation:
Benefit obligation at beginning of year $177,361 $140,010 $24,762 $18,529
Service cost 14,145 10,734 1,911 1,353
Interest cost 13,214 11,560 1,816 1,624
Participants’ contributions – – 46 42
Amendments – 1,080 – –
Actuarial losses 22,465 22,564 1,639 4,376
Settlement – (1,141) – –
Benefits paid (7,562) (6,616) (1,285) (1,162)
Expenses paid (633) (830) – –
Benefit obligation at end of year $218,990 $177,361 $28,889 $24,762
Change in plan assets:
Fair value of plan assets at beginning of year $149,942 $140,191 $ – $ –
Actual return on plan assets (9,805) 1,665 – –
Employer contribution 48,619 15,532 1,239 1,120
Participants’ contributions – – 46 42
Benefits paid (7,562) (6,616) (1,285) (1,162)
Expenses paid (633) (830) – –
Fair value of plan assets at end of year $180,561 $149,942 $ – $ –
Reconciliation of funded status:
32
Benefit obligation at end of year $218,990 $177,361 $28,889 $24,762
Fair value of plan assets at end of year 180,561 149,942 – –
Funded status – excess obligations 38,429 27,419 28,889 24,762
Unrecognized prior service cost 190 218 614 946
Unrecognized actuarial losses 53,022 11,554 2,033 394
Net (asset) liability recognized $(14,783) $ 15,647 $26,242 $23,422
Amount recognized in the statements of
financial position consists of:
Net (asset) accrued liability $(20,093) $ 12,215 $26,242 $23,422
Intangible asset 1,484 1,757 – –
Reduction to accumulated other comprehensive income 3,826 1,675 – –
Net amount recognized $(14,783) $ 15,647 $26,242 $23,422
Weighted average assumptions:
Discount rate 6.90% 7.41% 7.00% 7.50%
Expected return on plan assets 9.00% 9.00% N/A N/A
Rate of compensation increase 4.00% 4.00% 4.00% 4.00%
The projected benefit obligation and accumulated benefit obligation of TJX’s unfunded supplemental retirement
plan was $32.8 million and $23.3 million, respectively, as of January 26, 2002 and $23.8 million and $18.2 million,
respectively, as of January 27, 2001. The increase in the projected benefit obligation as of January 26, 2002 reflects
actuarial losses due to a decrease in the discount rate for valuation purposes.
The portion of the net (asset) accrued liability attributable to TJX’s unfunded supplemental retirement plan
amounted to $23.3 million at January 26, 2002 and $18.2 million at January 27, 2001 and is included in other long–term
liabilities on the balance sheets. The balance of the net amount recognized is a net asset relating to the funded defined
benefit plan of $38.1 million and $2.6 million at January 26, 2002 and January 27, 2001, respectively. These net assets are
included in prepaid and other current assets except for the long–term portion of $21.1 million as of January 26, 2002,