(INDIRA) Call Girl Mumbai Call Now 8250077686 Mumbai Escorts 24x7
anheuser-busch 2005AR_FinancialSummaries
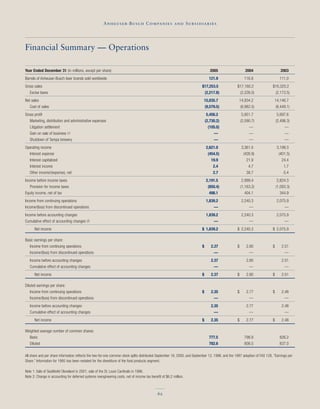
1. Anheuser-Busch Companies and Subsidiaries
Financial Summary — Operations
Year Ended December 31 (in millions, except per share) 2005 2004 2003
Barrels of Anheuser-Busch beer brands sold worldwide 121.9 116.8 111.0
Gross sales $17,253.5 $17,160.2 $16,320.2
Excise taxes (2,217.8) (2,226.0) (2,173.5)
Net sales 15,035.7 14,934.2 14,146.7
Cost of sales (9,579.5) (8,982.5) (8,449.1)
Gross profit 5,456.2 5,951.7 5,697.6
Marketing, distribution and administrative expenses (2,730.2) (2,590.7) (2,498.3)
Litigation settlement (105.0) — —
Gain on sale of business (1) — — —
Shutdown of Tampa brewery — — —
Operating income 2,621.0 3,361.0 3,199.3
Interest expense (454.5) (426.9) (401.5)
Interest capitalized 19.9 21.9 24.4
Interest income 2.4 4.7 1.7
Other income/(expense), net 2.7 38.7 0.4
Income before income taxes 2,191.5 2,999.4 2,824.3
Provision for income taxes (850.4) (1,163.2) (1,093.3)
Equity income, net of tax 498.1 404.1 344.9
Income from continuing operations 1,839.2 2,240.3 2,075.9
Income/(loss) from discontinued operations — — —
Income before accounting changes 1,839.2 2,240.3 2,075.9
Cumulative effect of accounting changes (2) — — —
Net income $ 1,839.2 $ 2,240.3 $ 2,075.9
Basic earnings per share:
Income from continuing operations $ 2.37 $ 2.80 $ 2.51
Income/(loss) from discontinued operations — — —
Income before accounting changes 2.37 2.80 2.51
Cumulative effect of accounting changes — — —
Net income $ 2.37 $ 2.80 $ 2.51
Diluted earnings per share:
Income from continuing operations $ 2.35 $ 2.77 $ 2.48
Income/(loss) from discontinued operations — — —
Income before accounting changes 2.35 2.77 2.48
Cumulative effect of accounting changes — — —
Net income $ 2.35 $ 2.77 $ 2.48
Weighted average number of common shares:
Basic 777.5 798.9 826.2
Diluted 782.6 808.5 837.0
All share and per share information reflects the two-for-one common stock splits distributed September 18, 2000, and September 12, 1996, and the 1997 adoption of FAS 128, ”Earnings per
Share.” Information for 1995 has been restated for the divestiture of the food products segment.
Note 1: Sale of SeaWorld Cleveland in 2001; sale of the St. Louis Cardinals in 1996.
Note 2: Change in accounting for deferred systems reengineering costs, net of income tax benefit of $6.2 million.
62
2. Anheuser-Busch Companies and Subsidiaries
2002 2001 2000 1999 1998 1997 1996 1995
109.8 107.2 105.6 102.9 99.8 96.6 95.1 90.9
$15,686.8 $14,973.0 $14,534.2 $13,914.5 $13,342.5 $12,936.0 $12,721.8 $12,100.1
(2,120.4) (2,061.5) (2,034.8) (2,019.6) (1,962.1) (1,766.2) (1,737.8) (1,664.0)
13,566.4 12,911.5 12,499.4 11,894.9 11,380.4 11,169.8 10,984.0 10,436.1
(8,131.3) (7,950.4) (7,829.9) (7,445.6) (7,297.1) (7,200.5) (7,064.9) (6,886.6)
5,435.1 4,961.1 4,669.5 4,449.3 4,083.3 3,969.3 3,919.1 3,549.5
(2,455.4) (2,255.9) (2,174.8) (2,147.0) (1,958.0) (1,916.3) (1,890.0) (1,756.6)
— — — — — — — —
— 17.8 — — — — 54.7 —
— — — — — — — (160.0)
2,083.8 (3) 1,632.9 (4)
2,979.7 2,723.0 2,494.7 2,302.3 2,125.3 2,053.0
(368.7) (361.2) (348.2) (307.8) (291.5) (261.2) (232.8) (225.9)
17.7 26.9 33.3 18.2 26.0 42.1 35.5 24.3
1.3 1.1 1.1 4.3 5.8 7.9 9.4 9.9
(6.4) (12.2) (1.0) (9.4) (13.0) (9.3) (3.0) 20.5
1,892.9 (3) 1,461.7 (4)
2,623.6 2,377.6 2,179.9 2,007.6 1,852.6 1,832.5
(1,041.5) (927.5) (874.3) (784.1) (732.2) (715.2) (736.8) (575.1)
351.7 254.4 246.0 178.7 112.9 61.9 — —
1,156.1 (3) 886.6 (4)
1,933.8 1,704.5 1,551.6 1,402.2 1,233.3 1,179.2
— — — — — — 33.8 (244.3)
1,933.8 1,704.5 1,551.6 1,402.2 1,233.3 1,179.2 1,189.9 642.3
— — — — — (10.0) — —
$ 1,933.8 $ 1,704.5 $ 1,551.6 $ 1,402.2 $ 1,233.3 $ 1,169.2 $ 1,189.9 $ 642.3
$ 2.23 $ 1.91 $ 1.71 $ 1.49 $ 1.28 $ 1.19 $ 1.16 $ .86
— — — — — — .03 (.23)
2.23 1.91 1.71 1.49 1.28 1.19 1.19 .63
— — — — — (.01) — —
$ 2.23 $ 1.91 $ 1.71 $ 1.49 $ 1.28 $ 1.18 $ 1.19 $ .63
1.14 (3) .85 (4)
$ 2.20 $ 1.89 $ 1.69 $ 1.47 $ 1.27 $ 1.18 $ $
— — — — — — .03 (.23)
2.20 1.89 1.69 1.47 1.27 1.18 1.17 .62
— — — — — (.01) — —
$ 2.20 $ 1.89 $ 1.69 $ 1.47 $ 1.27 $ 1.17 $ 1.17 $ .62
866.0 890.1 906.1 939.0 964.2 985.3 998.2 1,021.7
878.9 901.6 919.7 953.7 975.0 999.4 1,021.2 1,048.8
Note 3: 1996 results include the impact of the one-time gain on the sale of the St. Louis Cardinals. Excluding the Cardinals gain, operating income, pretax income, income from continuing oper-
ations, and diluted earnings per share would have been $2,029.1 million, $1,838.2 million, $1,122.7 million, and $1.10, respectively.
Note 4: 1995 results include the impact of the one-time pretax charge of $160.0 million for the closure of the Tampa brewery, and the $74.5 million pretax impact of the beer wholesaler inven-
tory reduction. Excluding these one-time items, operating income, pretax income, income from continuing operations, and diluted earnings per share would have been $1,867.4 million,
$1,696.2 million, $1,032.3 million, and $.99, respectively.
63
3. Anheuser-Busch Companies and Subsidiaries
Financial Summary — Balance Sheet and Other Information
Year Ended December 31 (in millions, except per share) 2005 2004 2003
Balance Sheet Information:
Working capital (deficit) $ (223.9) $ (150.6) $ (226.9)
Current ratio 0.9 0.9 0.9
Debt $ 7,972.1 $ 8,278.6 $ 7,285.4
Shareholders equity $ 3,343.3 $ 2,668.1 $ 2,711.7
Return on shareholders equity 61.2% 83.3% 72.0%
Book value per share $ 4.30 $ 3.40 $ 3.33
Total assets $ 16,555.0 $16,173.4 $14,689.5
Other Information:
Operating cash flow before changes in working capital $ 2,677.5 $ 3,121.9 $ 2,938.3
Capital expenditures $ 1,136.7 $ 1,089.6 $ 993.0
Operating cash flow after capital expenditures (Anheuser-Busch free cash flow) $ 1,591.1 $ 1,850.7 $ 1,977.9
Common dividends paid $ 800.8 $ 742.8 $ 685.4
Per share $ 1.03 $ .93 $ .83
Price/earnings ratio 18.3 18.3 21.2
High and low closing price of BUD shares $50.52-$40.57 $54.29-$49.45 $53.69-$45.92
All share and per share information reflects the two-for-one common stock splits distributed September 18, 2000, and September 12, 1996. Information for 1995 has been restated for the divestiture
of the food products segment.
64
4. Anheuser-Busch Companies and Subsidiaries
2002 2001 2000 1999 1998 1997 1996 1995
$ (283.0) $ (186.1) $ (127.8) $ (350.4) $ (89.9) $ 83.2 $ 34.9 $ 268.6
0.8 0.9 0.9 0.8 0.9 1.1 1.0 1.2
$ 6,603.2 $ 5,983.9 $ 5,362.7 $ 5,122.9 $ 4,718.6 $ 4,365.6 $ 3,270.9 $ 3,270.1
$ 3,052.3 $ 4,061.5 $ 4,128.9 $ 3,921.5 $ 4,216.0 $ 4,041.8 $ 4,029.1 $ 4,433.9
29.2% (1) 30.0% (2) 25.0% (3)
54.4% 41.6% 38.5% 34.5% 29.9%
$ 3.61 $ 4.62 $ 4.57 $ 4.25 $ 4.42 $ 4.15 $ 4.05 $ 3.61
$ 14,119.5 $13,944.9 $ 13,148.3 $ 12,680.5 $12,504.5 $ 11,738.4 $ 10,463.6 $ 10,590.9
$ 2,624.3 $ 2,316.0 $ 2,230.0 $ 2,141.6 $ 1,977.2 $ 1,839.0 $ 1,751.7 $ 1,700.5
$ 834.7 $ 1,022.0 $ 1,074.5 $ 865.3 $ 817.5 $ 1,199.3 $ 1,084.6 $ 952.5
$ 1,930.5 $ 1,338.6 $ 1,183.0 $ 1,270.6 $ 1,395.9 $ 644.4 $ 909.2 $ 494.5
$ 649.5 $ 614.1 $ 571.0 $ 544.7 $ 521.0 $ 492.6 $ 458.9 $ 429.5
$ .75 $ .69 $ .63 $ .58 $ .54 $ .50 $ .46 $ .42
18.6 (1) 17.6 (2) 19.6 (3)
22.0 23.9 26.9 24.1 25.9
$54.97-$44.00 $46.51-$38.50 $49.81-$27.47 $40.81-$32.59 $34.13-$21.72 $23.94-$19.75 $21.44-$16.25 $17-$12.69
Note 1: Ratios calculated based on income from continuing operations before the cumulative effect of accounting changes.
Note 2: Ratios calculated based on reported income from continuing operations, which includes the one-time $54.7 million pretax gain on the sale of the St. Louis Cardinals. Excluding the
Cardinals gain, return on shareholders equity would have been 29.2% and the price/earnings ratio would have been 18.1.
Note 3: Ratios calculated based on reported income from continuing operations. Excluding the two one-time 1995 items ($160 million pretax charge for closure of the Tampa
brewery and $74.5 million pretax impact of the beer wholesaler inventory reduction), return on shareholders equity would have been 29.1% and the price/earnings ratio
would have been 16.8.
65