VIP Independent Call Girls in Mira Bhayandar 🌹 9920725232 ( Call Me ) Mumbai ...
4Q 06 Ttranscriptprerecordcoments
1. PPG Industries, Inc., Fourth Quarter 2006 Financial Results
William H. Hernandez, Senior Vice President, Finance, January 18, 2007, Recorded Comments
Welcome and first thank you for your interest in PPG. In the next few minutes, I’ll review our
fourth quarter performance and also mention a few full year achievements. I’ll comment on
various industry and economic trends underlying our performance and also discuss a few
key issues relative to year 2007. Before getting into all the details, let me quickly
characterize the quarter for you.
• PPG delivered all-time record fourth quarter sales, and our annual sales broke through
the $11 billion mark for the first time ever. This is the 15th consecutive quarter where we
delivered an all-time quarterly sales record. Annual sales grew by over 8 percent,
marking the fourth consecutive year where we delivered sales growth of between 7 and
9 percent.
• Record quarterly sales were achieved in all six of our coatings businesses and our
optical business. Annual sales records were recognized in eight of our 15 businesses.
Our coatings segment easily broke through the $6 billion sales level for the first time
ever, and our optical sales grew by 16 percent in 2006.
• Our annual sales growth was broad-based both by geography and source.
Geographically, cumulative U.S. and Canadian sales increased by about 4 percent, while
double-digit-percentage sales growth was posted in both Europe and Latin America. In
Asia our sales increased by 45 percent. With respect to sources of growth, each source
– pricing, volume and acquisition – contributed between 2 to 4 percent year over year.
• With respect to earnings, during the quarter we delivered a double-digit-percentage
increase versus last year’s fourth quarter, despite weakness in certain U.S. end markets
and related customer downtime. On an annual basis our adjusted earnings-per-share
increased by 14 percent versus the adjusted full year 2005 results.
• In chemicals, as we announced in mid-November, our fourth quarter chlor-alkali volumes
and resultant operating earnings were negatively impacted by customer outages which
took place over the last six to eight weeks of the year. However, our optical business
continued to post excellent growth, supported by strong demand and the positive impact
of business acquisitions.
• In coatings, fourth quarter operating earnings expanded by 14 percent versus last year,
primarily a result of our strong volume gains. Higher selling prices once again outpaced
the impacts of inflation.
• Fourth quarter glass margins improved year over year. This is despite several market
sectors, such as housing and autos, which are experiencing difficult times. This recovery
is a result of lower energy costs, our continued cost focus and various actions we have
taken to improve profitability in several of these businesses.
2. 2
• Looking at a few annual trends, coatings raw material costs escalated in 2006 versus
2005, but the rate of escalation slowed dramatically. On the energy front, our full year
2006 natural gas costs were down slightly versus 2005’s all-time high levels.
• And as no surprise to those of you who know us well, we generated over $1 billion in
cash from operations for the year. And again as no surprise, we have put that cash to
use in ways that benefit shareholders, both now and in the future.
• Specifically, this year we completed 13 acquisitions that are intended to strengthen our
coatings and optical businesses by broadening their product offering and geographic
breadth. While these acquisitions added about $375 million to sales and were just
slightly accretive to earnings in 2006, in 2007 we expect them to deliver $700 to $800
million in full year sales and, more importantly, achieve industry margins.
• Continuing our long heritage, we increased our annual dividend payout, marking the 35th
consecutive year of increasing dividend payments. Additionally, we repurchased 2.3
million shares of PPG stock during the year.
Now let me just expand a bit on some of the key points:
• This year PPG sales increased by over 8 percent with each one of our coatings
businesses delivering a minimum of 9 percent sales growth. Our optical business grew
sales by 16 percent, marking the fifth consecutive year this business has delivered sales
percentage growth topping at least 14 percent. Our overall and consistent sales growth
continues to demonstrate the successful execution of our growth strategies.
• That being said, our growth strategies would not be successful without the
accompanying earnings impact. Our 2006 adjusted earnings-per-share of $5.16 are a
record for PPG, easily eclipsing the previous all-time mark.
• Both cost management and cash generation are hallmarks of PPG’s operational
excellence, and 2006 was no exception. We once again generated about $70 million in
cost reductions. Regarding cash from operations our consistency remains stellar, as
over the past 11 years we have generated $11 billion in cash from operations.
• We have deployed this cash in a balanced manner to reward shareholders today and
build for the future. This year we spent about $470 million on dividends and share
repurchases. Additionally, we acquired businesses for a total of $480 million including
assumed debt.
To quickly summarize our outstanding 2006 performance, we delivered strong growth and
broke various records in both sales and earnings. We continue to be driven by our heritage
values of meeting customer requirements and rewarding shareholders. We have executed
on our profitable organic growth initiatives, which will build an even stronger PPG in the
future, and we prudently deployed our strong cash generation to accelerate our future
growth.
3. 3
Now let’s discuss some of details.
Fourth Quarter and Full Year Sales Comparisons
3
Our fourth quarter and annual sales results are
Business Segment Sales illustrated on slide number three.
4th Quarter Year-to-Date
For the quarter our overall sales increased 11
%
%
Sales 2006 2005 Change 2006 2005 Change
percent. Our U.S. volumes slowed in the quarter,
Coatings $1,675 $1,388 21% $ 6,299 $ 5,566 13%
Chemicals 585 569 3% 2,485 2,398 4%
Glass 513 548 -6% 2,253 2,237 1%
reflecting several sluggish U.S. markets. The
Total PPG $2,773 $2,505 11% $ 11,037 $ 10,201 8%
sluggish U.S. results were more than offset by our
ever-increasing global footprint, which produced
volume growth in both Europe and Asia, coupled with
the performance of the acquisitions we made this
past year. Currency also was a help.
For the quarter coatings sales increased by a robust 21 percent year over year. We
continue to deliver broad growth in coatings, with every business posting gains of at least
15 percent year over year. Leading the way was our aerospace business, where we posted
sales gains of about 38 percent.
Our glass segment sales declined by 6 percent. This was primarily a result of a significant
decline in automotive OEM glass sales, where we continued to see domestic carmakers
reduce production to manage high inventory levels. Our fiber glass sales were also
negatively impacted by this end market.
Our fourth quarter chemical sales were up 3 percent versus 2005, as we continued to
realize strong sales growth particularly in our specialty chemical businesses. As I
mentioned previously, our chlor-alkali volumes were adversely impacted by customer
outages in the quarter.
Regarding the year-over-year chemical sales comparison, let me remind you that our 2005
fourth quarter chlor-alkali sales were reduced by Hurricane Rita, which resulted in the
shutdown of our Lake Charles, Louisiana, facility for a portion of the fourth quarter of 2005.
We estimated a negative fourth quarter 2005 sales impact to PPG of about $40 million
relating to the hurricane.
To quickly summarize the quarter, our glass and chemical results were adversely impacted
by several slowing U.S. end markets, as customers managed inventory levels. However,
we more than offset those impacts due to high growth levels in both coatings and optical.
This is a testament to our continued focus and success on globally growing coatings and
optical.
Now shifting to our annual sales results:
Annual PPG sales grew by 8 percent, with growth realized in all business segments, all
regions, and by all sources. This broad growth profile was led by excellent volume growth in
both Europe and Asia, and by the performance of the acquisitions we made this year. Also,
price increases remained a focal point, as our coatings businesses continued to work to
offset the raw materials inflation we experienced over the past few years.
4. 4
Coatings sales exceeded $6 billion for the first time ever on sales growth of 13 percent,
about one-half of which resulted from the acquisitions we completed this year. Our
exceptional results in Asia continued, as Asian coatings sales grew by 45 percent year over
year. Exiting the year, Asia now represents 13 percent of our total coatings profile.
Meanwhile, European sales rose 12 percent on strong volume growth, while North American
sales increased 9 percent, both well ahead of the regions’ economic statistics. Latin
American sales advanced 14 percent. By nearly any measure 2006 sales growth in
coatings was excellent.
Glass sales increased about 1 percent for the year, as the full year results were negatively
impacted by notably lower fourth quarter volumes. For the year, our performance glazings
architectural glass business posted an increase of about 8 percent, as we continue to
benefit from a robust commercial construction market. These gains were offset by
weakness in our automotive OEM glass business, where our primary customers are the
U.S. domestic automakers.
In chemicals, our sales grew by about 4 percent, driven primarily by a 16 percent gain in
optical sales, which was due to a combination of organic growth and business acquisitions.
Full year chlor-alkali sales were down, as record full year ECU pricing was offset by softer
volumes.
To summarize our excellent annual sales performance, we achieved near double-digit
annual sales growth despite significant slowing in several economic sectors and moderate
slowing in the overall U.S. economy. This was accomplished due to our global presence,
deployment of cash on a series of well-positioned acquisitions, and continued strengthening
of our position in industries such as optical and aerospace, where we have broadened our
product offering. Achieving percentage increases in the teens for our largest business
segment – coatings – and our most profitable business unit – optical – reflects the
successful fulfillment of our most critical growth strategies for 2006.
I will discuss our results in some of our individual business units later. Now let’s quickly take
a look at our overall sales growth trends graphically.
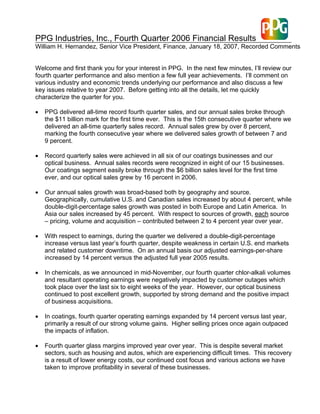
Quarterly Volume Change – Total PPG
4
As slide number 4 clearly illustrates, for the past
Quarterly Volume Change – Total PPG
several years – except for the second half of 2005,
From Prior Year Quarter
which was negatively impacted by several U.S.
10
N.A.
Asia U.S.
Industrial
8 Decline
Hurricanes
hurricanes – each quarter, we have consistently
Decline
6
Percent
4
delivered year-over-year organic sales growth.
2
0
-2
For the past two years we said volume growth would
-4
-6
moderate but be at a more sustainable level. This
-8
1998 1999 2000 2001 2002 2003 2004 2005 2006
expectation, including the sustainability, was evident
1st Qtr 2nd Qtr 3rd Qtr 4th Qtr
in 2006, as growth remained fairly consistent despite
a variety of economic shocks, including consistently high consumer and business energy
costs and reductions in both housing and autos.
5. 5
As mentioned previously, in 2006 we saw the U.S. growth rate slow during the year,
including several of the markets we serve. We expect 2007 to begin with continued modest
overall U.S. growth, with the growth rate accelerating in the second half of the year. On a
global basis, our outlook is for organic growth rates to once again remain stable.
Quarterly Volume Change – Europe
5
The next slide depicts our European volumes, where
Quarterly Volume Change – Europe
this past quarter continues a very positive trend
From Prior Year Quarter
20
which began in the fourth quarter of last year. As I
15
will discuss in a few minutes, some of the 2006
10
Percent
5
acceleration in the third and fourth quarters was
0
likely due to a pre-buy ahead of a 2007 German VAT
-5
increase.
-10
-15
2006
2004 2005
2000 2001 2003
2002
1st Qtr 2nd Qtr 3rd Qtr 4th Qtr
However, the overall underlying factor driving our
performance trend was a more solid European
economic environment, coupled with additional
6
market share growth by PPG in the region.
Quarterly Volume Change – Asia
From Prior Year Quarter
25
Quarterly Volume Change - Asia
20
Moving to our Asian volume slide, our excellent
15
Percent
organic growth in this region continues, with each
10
5
quarter this year posting at or near double-digit
0
volume growth. On an annual basis, we have
-5
2000 2001 2002 2003 2005 2006
2004
delivered consistently high growth rates for the past
1st Qtr 2nd Qtr 3rd Qtr 4th Qtr
five years.
While not depicted on this slide, during the fourth quarter our total Asian sales grew
impressively, by almost 75 percent year over year, as our strong volume growth was
supplemented by acquisitions.
For the next several years we expect our organic growth prospects in this region to remain
robust, supporting continued high economic activity in the region.
Now we have said on many occasions that our goal was not just growth but profitable
growth, so let’s move to our earnings performance.
Fourth Quarter Earnings Comparison
7
As depicted on slide number 7, we reported fourth
Fourth Quarter Comparisons
quarter earnings-per-share of $0.94 in the quarter
that included a reduction of $3 million aftertax, or two
2005
2006
cents a share related to our proposed asbestos
Million EPS Million EPS
Net Income As Reported $ 157 $ 0.94 $ 113 $ 0.68
settlement. During the quarter we did receive some
Net Income Includes the Following Charges:
Asbestos Settlement - Net 3 0.02 3 0.02
Non-Cash Asset Impairments - - 17 0.10
news on this proposed settlement, and I will discuss
Direct Hurricane Costs - - 10 0.06
Adjusted $ 160 $ 0.96 $ 143 $ 0.86
that shortly. Our fourth quarter tax rate was about
31.5 percent, within the range we indicated last
quarter.
6. 6
Last year our reported earnings-per-share was $0.68. This figure included charges of $0.02
a share for the asbestos settlement, $0.10 per share relating to a non-cash asset
impairment, and $0.06 a share stemming from direct costs associated with the 2005 U.S.
hurricanes Katrina and Rita. The tax rate was 32 percent.
As I mentioned previously, our results were tempered by lower volumes, primarily in chlor-
alkali and glass, as several large customers took significant downtime, especially in the last
six to eight weeks of the year. That being said, our adjusted earnings-per-share increased
by about 12 percent year over year.
8
Full Year Earnings Comparison
Full Year Comparisons Moving to slide number 8, full year reported earnings
were $4.27 a share in 2006. This includes
2006 2005
Million EPS Million EPS
reductions of $0.10 for our proposed asbestos
Net Income As Reported $ 711 $ 4.27 $ 596 $ 3.49
Net Income Includes the Following Charges:
settlement, $0.15 for legal settlements, $0.64 for
Asbestos Settlement - Net 17 0.10 13 0.08
Legal Settlements 26 0.15 128 0.74
legacy environmental charges, $0.14 for business
Insurance Recoveries (24) (0.14) (11) (0.06)
Environmental Remediation 106 0.64 - -
Business Restructuring 23 0.14 - -
restructuring, and an addition of $0.14 due to
Debt Refinancing Costs - - 12 0.07
Non Cash Asset Impairment - - 17 0.10
Direct Hurricane Costs - - 21 0.12
insurance recoveries. Our adjusted earnings-per-
Adjusted $ 859 $ 5.16 $ 776 $ 4.54
share was $5.16.
Last year our reported earnings were $3.49 a share.
This includes an addition of $0.06 for insurance recoveries and reductions of $0.08 for the
asbestos settlement, $0.74 for legal settlements, $0.07 relating to debt refinancing costs,
$0.10 for a non-cash impairment charge and $0.12 for direct hurricane costs. 2005 adjusted
earnings-per-share was $4.54.
Our full year 2006 tax rate was about 26 percent, while our 2005 tax rate was about 30
percent. Both of these rates were impacted by various charges and adjustments. Our
ongoing tax rate in both years was about 31.5 percent, and we expect our 2007 tax rate to
be in the same range.
Once again, PPG’s full year adjusted earnings-per-share represented about a 14 percent
increase over last year’s adjusted figure. Earnings-per-share remains one of our key
performance metrics, and we are very proud to have delivered double-digit-percentage
growth in 2006 and honored our commitment of profitable growth. I will discuss some of the
key drivers of this growth as we walk through the results of each of the businesses later.
Lastly, we once again surpassed $1 billion in cash from operations, which includes a
reduction for the $100 million contribution we made to our U.S. pension funds this year.
Let me summarize our full year 2006 financial results. In the wake of a slowing U.S.
economy, with notable declines in both housing and automotive production, I am sure many
folks would have doubted our ability to match our excellent 2005 results. Well, we not only
matched them, despite these macro challenges; we surpassed many of them by a double-
digit-percentage increase.
7. 7
Our performance is a reflection of our diverse and global business mix, our ever-present
diligence and commitment to focus on costs, and our continued pricing discipline. These
are certainly not new traits for PPG, but as we demonstrate time and again, they yield
excellent earnings performance.
We are pleased by the financial results we achieved in 2006, as we continued to make
progress in restoring our industry-leading coatings margins back to historical levels; drove
double-digit-percentage increases in our top line in both coatings and optical; and generated
cash and, more importantly, used that cash to either strengthen our businesses or return it
to our shareholders.
Economic Indicators
9
The next slide provides an overview of either our or
Economic Indicators
Global Insight’s estimates of the relevant historical
4Q 2006 Year 2006
(change from 4Q (change from 2005)
economic statistics. I typically cover at length many
2005)
2.7% 3.2%
U.S. Real GDP*
of these macroeconomic metrics and trends. Given
4.1% 4.3%
U.S. Industrial Production*
2.9% 2.7%
EEC Real GDP*
China Real GDP* 10% 10%
that I already touched upon some of them, I’ll be
-7.6% -2.9%
N.A. Vehicle Production
N.A. Light Vehicle Sales -1.1% -2.6%
brief. I will also provide our current outlook on the
1% -2%
Western Europe Auto Production*
Western Europe, New Registrations 2% 1%
economy as we enter 2007.
U.S. Housing Starts* -28% -13%
U.S. Commercial Const. (Real Inv.)* 12% 9%
*Estimates
First let’s discuss automotive production. As we
have stated many times, global automotive
production continues to expand. Global Insight estimates that global vehicle builds grew by
4 percent in 2006 and about 12.5 percent over the past three years. This consistent growth
is driven by substantial growth in emerging regions, while production in mature regions has
varied only slightly, either up or down.
Global Insight estimates that in 2006, annual vehicle production grew in China and Eastern
Europe about 28 percent and 18 percent respectively. China is now the world’s third largest
country in terms of automotive production. The growth trend remains robust, as production
has grown nearly 400 percent since year 2000. Our recent OEM coatings acquisition in
Asia will result in an approximate 150 percent increase in our sales from that region as we
purchased the remaining interest of our Korean joint venture.
In the more mature markets, Western European automobile production was down 1.5
percent for the year but up just slightly in the fourth quarter. In North America, full year
production declined about 3 percent, with the fourth quarter results off nearly 8 percent.
This past quarter, North American auto production was one of the more pronounced lagging
sectors of the U.S. economy.
Our overall automotive businesses remained fairly consistent with the macro trends as, on
an annual basis, our North American-based auto OEM glass business recognized volume
declines of about 5 percent, while our global auto OEM coatings business grew volumes by
4 percent.
Our view remains very positive on growth in the overall global automotive market. Entering
2007, we do expect continued softness early in the year in North America. We also see
softness in Western Europe due to the pull forward of sales in 2006, due in part to the
German VAT increase. We expect emerging regions to continue to grow rapidly and expect
full year global growth rates to be in sync with recent history.
8. 8
Moving to industrial production, we are seeing similar global trends as many industries
continue to consolidate and globalize. Given we remain primarily a specialty materials
company, our overall volume growth patterns, over time, closely resemble that of the various
regions, exclusive of changes in our customer portfolio. Most of the industrial growth is
occurring in emerging regions where lower labor rates are available. We have been
focusing our investments in growth, both acquisitions and expansions of existing
businesses, in these emerging economies.
North American industrial production is estimated to have been up about 4 percent in 2006,
with a fairly comparable figure for the fourth quarter. Industrial production in Western
Europe also improved in 2006, especially in the fourth quarter, and was boosted by the
impact of the VAT pre-buy. Industrial activity continued to flourish in the emerging regions
such as China, where growth rates were in the mid-teens.
During 2006 in our global coatings business, our volumes in the U.S. and Canada were flat,
up 7 percent in both Europe and Latin America, and improved 13 percent in Asia.
Looking ahead, we certainly expect the emerging regions to continue to post high industrial
growth as these economies continue to expand. High-labor-content products remain the
focal point, while products with much lower labor content, such as coatings where labor
content is typically less than 10 percent of the cost, will remain more regional with
transportation costs acting as a sturdy barrier to globalization.
Finally, both U.S. commercial and U.S. residential construction markets have certainly
experienced their share of the spotlight this past year.
Residential construction dramatically slowed during 2006, with some signs of a possible
plateau occurring late in the fourth quarter. This contradicts the prior two years, where
speculation and historically low interest rates drove 20 to 30 percent increases in the build
rates.
In 2006, the decline of our supply into this particular end-market has matched the market
decline, especially in the fourth quarter, as many customers have also opted to reduce
inventory levels in anticipation of a new, lower annual build rate. Conversely, commercial
construction has grown about 9 percent for the year, with growth the past two quarters of
over 10 percent.
As we have reiterated many times, our performance glazings architectural glass business,
with its value-added product focus, is more highly correlated to commercial construction.
Also, our architectural coatings business continues to expand our share of the professional
paint market. For the year, our volumes in both these businesses grew by about 5 percent
despite the significant residential slowdown.
As we peer into 2007, we choose to first look at history. From an historical perspective, the
five-year average annual housing start rate for the eight years prior to year 2004 was about
1.6 million units. This period even included a mild recession. We expect that supply and
demand will eventually result in this general build rate once again, but only after high
inventory levels are reduced. Meanwhile, more important to PPG, the life cycle of the
9. 9
Average-size commercial construction project is about 14 months. Therefore, we fully
expect the 2006 activity increases to carry forward well into 2007 for the products we supply.
Now let’s discuss our overall economic outlook and several other key topics.
Key Topics and Outlook
10
Let me begin with the overall economic environment.
Key Topics
Our forecast a year ago was that in 2006, growth in
the U.S. economy would moderate. We also
• Economy mentioned that the economy would weather the
shocks of high energy costs and residential housing,
• Energy & Raw Materials
and would maintain a stable and solid, albeit slower,
• Legacy Issues
growth rate. Also, as we entered 2006, we noted
• Business Performance
that commercial construction was showing signs of a
recovery. Lastly, we indicated that the European
economy was promising and, as nearly all
economists predicted, Asia’s robust growth would continue.
Now in looking back, 2006 did unfold in a manner similar to this forecast. However, as with
most forecasts, there were certain areas that exceeded and others that fell below our
expectations.
Automotive production was slightly slower than expected, driven primarily by second half of
year softness in the U.S. market. Also, high inventories in the U.S. residential construction
sector have produced an economic and volume drag more substantial than we initially
believed, especially in the last quarter of the year. With respect to these two areas, our
global footprint and customer mix in automotive OEM coatings and excellent penetration in
the commercial construction market have offset, and in some cases surpassed, the impact
of these U.S. sector drags.
Outside the U.S., Europe economic activity grew throughout the year, including a very
robust fourth quarter. Since early in the year, we forecasted a pull-forward of activity from
year 2007 due to the pending German VAT increase, and still believe a portion of the
strength we saw in third and fourth quarters was a result of this event. That being said, the
European economy has improved in several critical areas including employment rates and
consumer spending.
In Asia, Japan has demonstrated a few signs of economic growth following 10 years of low
economic activity. In our opinion, this growth trend, while welcomed, has not yet stabilized.
China and India, on the other hand, have consistently produced fairly high growth rates.
GDP growth in China and India was about 10 percent and 9 percent respectively, but more
important to industrial companies such as PPG is industrial growth. In 2006, China’s
industrial production grew by over 15 percent, and infrastructure growth topped 25 percent.
Other emerging regions such as Latin America also produced growth rates at or above their
historical norm.
So how did all this translate for PPG? While reflecting back to our organic volume growth
we covered earlier, I think you will agree that our 2006 performance exemplifies our ability to
10. 10
take advantage of the continued industrial globalization and our capability to mitigate
negative shocks of any one region or industry.
Now, as we enter 2007, let me provide our outlook on the economy.
In North America, we expect GDP growth to remain at generally the same levels as the
second half of 2006. For the first half of 2007, we expect that the housing slowdown will
continue to act as a notable drag on the overall economy, as will U.S. automobile
production. These same factors will continue to have somewhat similar impacts on our
volumes in the businesses that supply these sectors. Meanwhile other market sectors, such
as aerospace and commercial construction, will continue to experience high activity levels.
Overall we remain confident that the economy is on sound footing, as employment figures
are good and fairly stable and consumer spending remains consistent. Any downturn in
these statistics would give us reason for concern, but the most recent data indicates these
statistics are actually improving slightly.
Many other economic statistics also remain favorable. While corporate profit growth is
expected to slow, corporate balance sheets remain sound and the export market will likely
expand given lower U.S. energy costs and the current foreign exchange environment.
In general, in North America we expect 2007 to be comparable on a full year basis to 2006,
except we expect economic acceleration to occur in the second half of year 2007. This
overall forecast remains consistent with our debated ‘soft patch’ forecast we made at the
end of 2005.
Moving to Europe we see several headwinds, especially in the first half of the year, with the
change in taxation that likely pulled forward some sales into 2006, a stronger Euro which
changes import/export economics, higher interest rates, and slower first half growth in the
North American economy which will impact the European export market.
However, in comparison, the European consumer has improved both in balance sheet and
sentiment, and many businesses are beginning to take steps to become more efficient and
competitive in the global economy. As a result, when compared with 2006, we see
comparatively consistent economic prospects with good activity levels in the region for the
full year of 2007. We expect growth in Eastern Europe to continue to outperform Western
Europe by roughly two-to-one.
While we could spend a great deal of time discussing Asia, simply put, we see a
continuation of a very high growth rate, especially as China prepares for the 2008 Olympics
in Beijing. Meanwhile, we remain hopeful, but less enthusiastic about the sustainability of
the recent but slight growth rate in Japan.
Overall, we expect global GDP growth to continue to be in the range of about 4 percent, with
the North American growth rate similar to 2006. Naturally, our performance and execution
over the past few years in a similar environment give us continued reason for optimism
regarding our future global growth prospects.
Now let’s shift our discussion to energy costs and raw materials.
11. 11
For the full year, our primary energy cost – natural gas – declined slightly below record 2005
levels due in large part to a significant cost difference in the fourth quarter. In the fourth
quarter of 2005, immediately following the two U.S. hurricanes Katrina and Rita, PPG
natural gas costs spiked to an all-time high of about $12.50 per MMBTU. In the fourth
quarter of 2006, our natural gas costs were about $7.75. Our full year energy costs were
about $8.50 in 2005 and in 2006 they were roughly $8.
For those of you who may not know us well, we use 60 to 70 trillion BTUs of natural gas a
year to generate power for the production of chlorine and caustic soda, and to produce glass
and fiber glass. So if natural gas costs change by a dollar per million BTUs, our pretax
costs change by about $60 to $70 million on an annual basis. Our year-over-year natural
gas costs were down about $35 million for the full year.
In addition to natural gas, for over two years we have experienced increases related to
coatings raw material costs. These costs, which include petroleum-based materials, are the
largest component of production costs for coatings. In 2006, these raw materials costs
remained stubbornly high as a result of, among many other things, consistently high oil
prices through year-end.
For the full year, coatings raw material costs increased by about 3 percent or just about $75
million, which is on top of an approximate 10 percent rise in 2005. Our fourth quarter 2006
costs were up about 2 percent.
Moving ahead, we believe that we will continue to see erratic price changes in the energy
markets as shifts occur in global supply and demand, and we also believe speculation
remains a prevalent factor in pricing.
Regarding natural gas costs, we have hedged the cost of about 35 percent of our first
quarter 2007 natural gas purchases at a price of about $8.35, and for the full year we have
hedged about 30 percent of our annual take at a price of about $8.
With respect to coatings raw materials, many raw materials suppliers believe that the
business cycle has peaked. Additionally, recent oil price trends and lower demand due to a
slower U.S. economy all favor an eventual buyers’ market. As a worst-case scenario, we
expect only slight raw material escalation in 2007, as a few raw materials remain in scarce
supply. However, for a variety of reasons, transportation cost pressures remain.
We made excellent progress as we continued to return back to our industry-leading
historical coatings margins in 2006. As we move into 2007, year-over-year coatings margin
comparisons will become exceedingly difficult as we anniversary our 2006 acquisitions
throughout the year.
Now, prior to discussing our business performance, let me talk about a few legacy topics.
First, in the third quarter we recorded a pretax charge of $173 million relating to legacy
environmental costs. Additionally, outside of this specific charge, other pretax
environmental costs accrued this year totaled about $35 million, still within our historical
annual range over the past 15 years of $10 to $49 million. As I stated last quarter, the large
third quarter charge represents meaningful progress toward the resolution of longstanding
12. 12
legacy issues detailed in our financial filings for many years. Our expectations for 2007 are
to return to a level of annual remediation costs consistent within our previous annual
historical range.
Next, regarding our proposed asbestos settlement, as we recently communicated, the
bankruptcy judge provided her opinion on the Pittsburgh Corning bankruptcy reorganization
plan in late December of last year. While we were disappointed the plan did not receive
confirmation, we view many facets of her opinion as favorable. We are currently analyzing a
variety of options, which may include plan modifications and reconsideration or appeals of
the bankruptcy court opinion.
Given that this event just recently transpired, along with the overall complexity of the issue,
we are not able to offer any timeline upon which any next step will be taken. For those not
familiar with the details of the proposed settlement, please refer to page 18 of our third
quarter 2006 Form 10-Q and our press release filed on Form 8-K on December 22, 2006, for
more information.
Now let’s discuss our businesses performance.
Business Segment Earnings
11
Shifting to slide number 11, first let’s look at our
Business Segment Earnings
glass business, where in 2005 we recorded a slight
fourth quarter operating loss. In 2006, we posted a
4th Quarter Year-to-Date
$20 million operating profit.
2006 2005 Change 2006 2005 Change
Operating Earnings
Coatings $ 205 $ 180 $ 25 $ 829 $ 609 $ 220
Chemicals 79 23 56 314 451 (137)
Glass 20 (1) 21 140 56 84
In the quarter, sales and earnings declined versus
$ 304 $ 202 $ 102 $ 1,283 $ 1,116 $ 167
(1)
last year due to the considerable downturn in both
Includes charges of $27 million for asset impairment.
(1)
Includes charges of $16 million for direct costs related to hurricanes.
North American autos and U.S. housing. However,
this decline was more than offset by solid
manufacturing improvements, lower year-over-year
natural gas costs, our excellent commercial construction value-added products in our
performance glazings business, and as a result of actions we have undertaken in several of
these businesses to improve profitability.
For the full year, our glass segment operating profits improved notably. I will remind you
that the 2005 results were reduced by the impact of a pretax $61 million legal charge. Our
2006 earnings increase is on only slightly lower full year natural gas costs, and despite a
significant slower U.S. housing market and a slower U.S. auto market.
While we still have room to go in improving our glass business profitability, and we remain
keenly cost focused, our 2006 performance in light of the economic environment
demonstrates some of the considerable actions we have taken are gaining traction. That
being said, it is fully recognized that several of our glass businesses still need to
substantially improve their financial performance to meet our corporate objectives.
13. 13
Shifting to our chemical segment, we achieved good fourth quarter results despite the
notable customer-related volume declines I noted a few minutes ago. For clarity in
understanding both the quarter and full year results, let me remind you of some of the
unusual items included in the earnings.
In the fourth quarter of 2005, we recorded pretax charges of $16 million relating to the direct
impact of the hurricanes and $27 million stemming from the impairment of certain fine
chemicals assets. For the full year 2005, direct hurricane-related costs totaled $34 million.
In 2006 we had no unusual adjustments in the fourth quarter. For the full year, we recorded
a pretax legacy environmental charge of $173 million and also realized a pretax insurance
recovery of $11 million resulting from the 2005 hurricanes.
On an adjusted basis, our fourth quarter earnings compared favorably versus last year. For
the full year, on an adjusted basis, our chemical earnings dropped primarily on lower chlor-
alkali volumes and higher manufacturing costs. Despite a challenging fourth quarter, chlor-
alkali did post another excellent year. Chemical full year results were assisted by continued
growth in our specialty chemical sales and earnings.
Now in reviewing our coatings earnings, in the fourth quarter we delivered a double-digit-
percentage increase in earnings. Our $205 million of operating profits were 14 percent
higher than the 2005 figure. This earnings growth is largely due to strong volume growth
and price actions which more than offset 2006 inflation.
For annual comparison purposes, let me once again detail for you some of the unusual
charges we had in coatings during both years. For the full year of 2005, we had a net
charge of $132 million relating to net legal and insurance matters. In 2006, we recorded
restructuring costs of $32 million and a legal settlement of $23 million, which were partially
offset by insurance recoveries of $28 million.
When you exclude the respective adjustments from both years, you will see the magnitude
by which our ongoing coatings earnings improved. Profitable organic growth was once
again the main driver in this increase.
Now to summarize both the quarter and the year earnings results.
In the fourth quarter, even though certain business volumes were tempered by customers’
inventory management in several U.S. market sectors, we still posted very high year-over-
year adjusted earnings. Additionally, all three business segments grew operating earnings.
This growth was the result of profitable organic growth in coatings and specialty chemicals
and the improvement actions in our glass businesses.
On an annual basis, our strong earnings growth in coatings was supplemented by continued
gains in our optical and performance glazings businesses. These businesses led the way to
us achieving a full year record adjusted earnings-per-share that was well in excess of our
prior record. We are very proud of delivering these results, as they came at a time of slower
U.S. economic growth and reinforced that we are delivering on our strategy of profitable
global growth.
14. 14
Now let me discuss our sales growth results by business unit.
Approximate Trend in Outside Sales – PPG
12
Slide number 12 depicts our fourth quarter and full
Approx. Trends in Outside Sales - Total PPG
year sales results. I already discussed many of
these previously. Focusing on the full year results,
4Q 2006
Acq./Other
(change from 4Q Sales Volume/Mix Price Curr.
let me just reiterate how broad-based our sales
2005)
7%
11% 2% -1% 3%
growth was, with each source delivering positive
growth. Once again, our total sales growth of 8
Year 2006
Acq./Other
(change from 2005) Sales Volume/Mix Price Curr.
percent was the fourth consecutive year of growth
4%
8% 2% 2% 0%
between 7 percent and 9 percent, certainly
demonstrating our consistency of growing well ahead
of GDP figures.
Now let’s review some of the business-specific results.
Approximate Trend in Outside Sales – Glass
13
As detailed on slide number 13, glass sales dropped
Approx. Trends in Outside Sales - Glass
6 percent in the fourth quarter, primarily on lower
4Q 2006
volumes. Pricing also declined 1 percent in the
(change from 4Q 2005) Sales Volume/Mix Price Curr. Acq./Other
GLASS -6% -7% -1% 1% 1%
quarter.
Automotive OEM -12% -11%
Automotive ARG -2% -9%
Insurance & Services -22% -22%
Fiber Glass -4% -5%
Performance Glazings -3% -1%
For the full year glass sales advanced 1 percent, due
Year 2006
(change from 2005) Sales Volume/Mix Price Curr. Acq./Other
in large part to strong volume gains in performance
GLASS 1% 0% -1% 1% 1%
Automotive OEM -6% -5%
glazings and automotive replacement glass, nearly
Automotive ARG 4% -1%
Insurance & Services -10% -10%
equally offset by volume shortfalls in OEM glass.
Fiber Glass 0% 1%
Performance Glazings 8% 5%
Regarding automotive OEM glass, for the quarter volumes dropped 11 percent, generally in
sync with our domestic U.S. automotive customers. Both DaimlerChrysler and General
Motors took significant production downtime during the quarter.
On an annual basis OEM glass sales declined 6 percent, once again reflecting industry
trends relating to its major customers, the domestic automakers, and downward pricing
pressure was strong. We expect these trends to continue in the first part of 2007.
Automotive replacement glass sales also fell during the quarter, dropping 2 percent. This
drop is in part a reflection of warmer weather throughout most of the U.S.
Full year auto replacement glass sales rose 4 percent, and we raised our percentage of
product sourced from low-cost regions to 21 percent. This market is highly competitive, and
we see this challenging competitive landscape continuing in 2007.
Fiber glass quarterly sales fell 4 percent as we experienced lower U.S. volumes, particularly
into the U.S. auto and housing markets. On an annual basis, fiber glass sales where flat.
Not detailed here is the significant growth in our Asian fiber glass joint ventures. We have
made considerable progress in our sourcing strategies to better position this business
globally that yielded significant year-over-year earnings improvements.
15. 15
Next, performance glazings sales declined 3 percent during the quarter on slightly lighter
volumes. Price declined slightly as well, due to a lower energy surcharge as natural gas
pricing declined.
On an annual basis, sales grew 8 percent on strong volume growth of 5 percent and price
gains of 2 percent. The volume growth was despite a considerable drop in residential
housing. As we stated many times, this business is much more closely aligned to
commercial construction, and our full year results in the wake of a serious housing downturn
certainly confirm our assertion.
Lastly, our energy surcharge in performance glazings is applied on a quarter lag, and it was
significantly beneficial in the first quarter of 2006, reflecting all-time high natural gas prices
at the end of 2005. Given fourth quarter 2006 natural gas pricing dropped considerably, this
will result in a negative year-over-year price comparison in this business of about $10 million
in the first quarter of 2007.
In summary for glass, our overall sales increase of 1 percent for the year was indicative of
the North American end markets we serve. As I mentioned earlier, we have taken several
actions in these businesses, and in 2006 we recognized some related improvement in glass
earnings. However, a great deal of work remains to bring underperforming businesses to
acceptable PPG financial measures.
Now let’s shift our discussion to chemicals.
Approximate Trend in Outside Sales – Chemicals
14
Slide number 14 illustrates our chemical sales
Approx. Trends in Outside Sales - Chemicals
results. Overall fourth quarter chemicals sales
4Q 2006
increased 3 percent as higher volumes were offset
(chg. from 4Q 2005) Sales Volume/Mix Price Curr. Acq./Other
CHEMICALS 3% 9% -10% 1% 3%
by lower pricing, while optical acquisitions added 2
Chlor-Alkali/Commodity -5% 11%
Specialty 15% 6%
percent. Our 2006 fourth quarter sales were a
record for any fourth quarter in our history. Also, our
Year 2006
(chg. from 2005) Sales Volume/Mix Price Curr. Acq./Other
full year sales were a record as well.
CHEMICALS 4% 1% 1% 0% 2%
Chlor-Alkali/Commodity -3% -4%
Specialty 15% 10%
In chlor-alkali, as we announced in mid-November,
our fourth quarter sales volumes were negatively
impacted by several customer outages. Despite this, our year-over-year volumes increased,
as our 2005 volumes were also reduced as Hurricane Rita resulted in the shutdown for part
of the quarter of our largest facility. Chlor-alkali pricing fell 16 percent from last year’s
levels, reflecting in part a 40 percent decline in natural gas prices.
On an annual basis, we realized full year record ECU prices, but volume was off slightly at
about 4 percent. Despite the sluggish fourth quarter, 2006 was one of our best years ever in
chlor-alkali.
Looking ahead to 2007, we see a dynamic environment. In the early portion of the year, we
expect our chlor-alkali demand to remain below historical levels due to certain sectors of the
economy and continued, select customer downtime. Conversely, we expect already
completed permanent industry supply reductions to impact the overall supply/demand
16. 16
balance. We have already seen inventory reductions in our chlor-alkali inventory position
beyond those driven by our lower fourth quarter operating rates, resulting in inventory levels
drastically below our mid-2006 levels. Finally, as mentioned earlier, the current forward
market on natural gas pricing is certainly more favorable than it was last year at this time.
Specialty chemical volumes were up once again during the quarter, as we had continued
growth in optical supplemented by growth in fine chemicals.
On an annual basis, specialty chemical sales grew 15 percent, led by optical sales growth of
16 percent as organic growth was accompanied by sales from businesses acquired.
We continue to extend our optical advertising in order to continue to build our brand globally,
and our growth in sales and earnings validates the success of this expansion. Looking into
2007, we expect to extend this even further and will likely incur higher year-over-year
advertising expenses in the first quarter, which will assist us in achieving our full year growth
objectives.
To summarize our 2006 chemical results, our chlor-alkali business had another excellent
year, and optical once again delivered sales growth of over 15 percent. We are proud to
say that for the second consecutive year, this culminated in our achievement of both fourth
quarter and full year sales records.
Now let’s discuss our strong coatings sales, which are depicted on slide number 15.
Approximate Trend in Outside Sales – Coatings
15
In the quarter, coatings sales grew a robust 21
Approx. Trends in Outside Sales - Coatings
percent, easily eclipsing our prior fourth quarter
4Q 2006
(change from 4Q 2005) Sales Volume/Mix Price Curr. Acq./Other
record of last year. Our sales results also beat our
COATINGS 21% 3% 3% 4% 11%
Automotive OEM 18% 5%
all-time quarterly record, despite a traditionally
Refinish 20% 3%
Industrial 15% -3%
Aerospace 38% 14%
slower quarter seasonally. The growth remained
Architectural 27% -2%
Packaging 19% 11%
broad-based, including 3 percent for both price and
Year 2006
(change from 2005) Sales Volume/Mix Price Curr. Acq./Other
volume plus 11 percent related to our 2006
COATINGS 13% 3% 3% 1% 6%
Automotive OEM 9% 3%
acquisitions. Currency, primarily the strong Euro,
Refinish 10% 0%
Industrial 13% 2%
Aerospace 17% 10%
also added 4 percent.
Architectural 24% 5%
Packaging 12% 9%
Annual coatings sales grew 13 percent, as both price and volume once again added 3
percent each. Acquisitions added 6 percent, as several acquisitions were completed
throughout the year.
In the fourth quarter, our automotive OEM sales increased 18 percent to a new fourth
quarter record and new record for any quarter. This included volume gains of 5 percent,
despite a very sluggish North American vehicle market. Our global breadth and customer
portfolio remained keys toward achieving these results. Also, Asian acquisitions added
about 7 percent as we expanded our operations to take advantage of the rapid growth in this
region, which I described earlier.
On a full year basis, we achieved record sales on 9 percent sales growth. Volume gains
continued, up about 3 percent, on the strength of global industry growth. Acquisition sales
were the other major factor in our results.
17. 17
Refinish sales for the quarter increased 20 percent, as business acquisitions were
supplemented by volume and pricing gains. The result is a new fourth quarter record sales
level, as well as a new record for any quarter.
Record annual sales were also achieved, due to both the acquisitions we completed along
with pricing gains.
Industrial coatings also produced a new fourth quarter sales record despite sluggish
volumes in North America due to autos and housing. Pricing and acquisition growth more
than offset the end-market impacts.
Also, a new full year record was achieved as we continued to expand our industrial business
globally. Our Asian industrial sales grew 60 percent this past year, including the impact of
acquisitions, and now are just under 25 percent of our global industrial coatings sales – a
percentage that will grow even further in 2007.
Aerospace sales grew just under 40 percent in the quarter and are, naturally, a new fourth
quarter record and new record for any quarter. Excellent volume growth and good results
from our acquisitions paved the way for the stellar performance.
Annual sales for aerospace grew 17 percent as volumes grew 10 percent. Needless to say,
the global aerospace market remains strong, and we continue to grow in this market by
providing leading technologies and services.
Architectural sales also grew substantially for the quarter with a 27 percent gain. Volumes
were down, but just slightly – a reflection of much weaker residential housing and do-it-
yourself markets. Acquisitions and pricing gains advanced sales for the quarter.
An annual sales record was also achieved as our architectural sales grew by 24 percent,
with acquisitions a key driver in this growth. We now have just about 450 company-owned
service centers supporting professional painting contractors. This helped us deliver annual
volume growth of about 5 percent despite continually dropping residential construction.
Packaging sales grew 19 percent for the quarter and 12 percent annually. Sales records
were eclipsed for both the quarter and the full year.
In total coatings, our annual sales growth of 13 percent is broad-based by source, as growth
was achieved in volumes, price and acquisitions. Also, geographically we grew coatings
sales by 9 percent in the U.S. and Canada, 12 percent in Europe and 45 percent in Asia. As
I stated earlier, these growth results are outstanding by any measure and continue to reflect
the successful execution of profitable growth initiatives.
Now let me shift gears and discuss something equally impressive: our results in the area of
cash generation.
18. 18
Use of Cash
16
Our track record of consistently generating cash
Uses of Cash continues. For the year, we once again generated
over $1 billion in cash from operations. This includes
• Prudently Fund Businesses
a reduction of $100 million for a voluntary U.S.
• Dividends pension fund contribution.
• Debt
Many of you have heard us discuss for some time
Pensions
how we prioritize our uses of cash. This prioritization
• Acquisitions
is detailed on slide number 16. The overriding goals
• Stock Repurchase for our cash deployment are to strengthen our
businesses and provide for sustainable benefits to
shareholders.
First is prudently funding our businesses through organic capital spending necessary to
keep the businesses healthy and competitive. In 2006, our capital spending excluding
acquisitions was about $375 million, well within our annual target of 3 percent to 4 percent of
sales. Our annual target remains unchanged for 2007.
Next, we continue our tradition of rewarding shareholders with annual returns in the form of
dividends, as evidenced by the fact that we have paid uninterrupted dividends for 107 years.
Also, this year marks the 35th consecutive year of increasing dividend payments – a heritage
we are very proud to continue.
Regarding debt, our debt-to-capital closed this year at about 28.6 percent, and our debt
level remains fairly consistent with last year. Looking ahead, our debt profile provides us
with continued flexibility for many years to come, as we have only about $250 million in debt
coming due over the next eight years. This figure is certainly manageable given our cash-
generation abilities.
With respect to pensions, as I mentioned earlier, we made a $100 million voluntary
contribution to our U.S. pension fund in 2006. Looking ahead, our U.S. pension plans do
not require mandatory funding until at least 2009, using conservative assumptions
concerning pension fund investment returns. Given our financial flexibility, we may opt to
make a voluntary, tax-effective contribution in 2007 of up to $200 million.
Next on our list are acquisitions that are related to our current businesses and that are at the
right price. In 2006 they totaled about $480 million in cash and assumed debt, with the
focus remaining on coatings and optical. There remains an active pipeline of possibilities in
2007, although not as voluminous in numbers as there was entering 2006. As many of you
know, and as our 2006 actions proved, we will remain very fiscally disciplined in this area.
Regarding our last prioritized use of cash, share repurchases, in 2006 we spent about $150
million in repurchasing a little over 2.3 million shares of PPG stock. We currently have over
7.6 million shares remaining on our current board-authorized share repurchase program.
Given our consistency of annual cash generation, we have and will utilize excess cash in a
given year to repurchase stock.
19. 19
Let me conclude our discussion on cash by summarizing our balanced 2006 cash
deployment. We spent about $500 million in combined organic capital spending, debt
repayment and U.S. pension contributions. We returned $470 million in cash to our
shareholders in the form of dividends and share buybacks, and our acquisitions and
assumed debt totaled about $480 million. Remarkably, after completing all these activities,
our year-end cash balance was nearly exactly the same as our 2005 year-end balance, at
about $450 million.
Conclusion
In conclusion, 2006 was an outstanding year by nearly every financial measure. Let me
quickly summarize a few of the year’s major financial accomplishments:
• We profitably grew our coatings and optical businesses by double-digit-percentage
increases.
• We greatly extended our footprint in Asia and other emerging regions of the world.
• We easily weathered a significant U.S. downturn in housing and slower North American
automotive production.
• We delivered another $70 million in manufacturing improvements, primarily in glass, as a
result of our continued actions.
• We completed coatings and optical acquisitions that will produce meaningful returns in
2007 and beyond.
• We generated another $1 billion in cash from operations and deployed that cash in a
balanced manner.
• And we once again rewarded shareholders with growing dividends and share
repurchases.
This is not to say that 2006 didn’t have its share of obstacles, but we overcame those
obstacles by remaining committed to delivering new technologies and services, growing
organically, remaining cost-focused and properly managing our financial flexibility.
While the outlook for 2007 looks equally challenging, our prospects for continued growth
look just as exciting as well. Let me articulate just a few items:
• We expect our coatings and optical businesses to continue to become larger portions of
our portfolio.
• In addition, we expect our organic growth to continue, especially in emerging regions.
• We have placed increased scrutiny on underperforming businesses and are currently
aggressively exploring, with the assistance of outside advisors, a variety of alternatives
for these businesses.
• We will continue to opportunistically explore acquisitions, but we will remain fiscally
disciplined.
• And, we fully expect our excellent heritages of cash generation and rewarding
shareholders to continue.
20. 20
Let me conclude by saying the primary focus of all these action plans is to provide
sustainable benefits for our shareholders.
21. 21
PPG INDUSTRIES, INC.
Condensed Statement of Operations
4th Quarter Results
(Millions of Dollars)
2006 Results 4th Quarter Results
2006 2005 % Change 2006 2005 % Change
Net Sales $ 11,037 $ 10,201 8.2 $ 2,773 $ 2,505 10.7
Cost of Sales 7,036 6,473 1,807 1,651
Selling and Other 2,298 2,080 10.5 612 502 21.9
Depreciation 337 340 (0.9) 86 84 2.4
Interest 83 81 20 19
Amortization 43 32 34.4 11 8 37.5
Asbestos Settlement - Net 28 22 5 6
Business restructuring 37 - - -
Other expense (income)- net (a) 115 226 (21) 48
Income Before Income Taxes,
And Minority Interest 1,060 947 253 187
278
Income Tax Expense 282 (1.4) 80 60 33.3
71
Minority Interest 69 16 14
Net Income (b) $ 711 $ 596 $ 157 $ 113
19.3 38.9
Earnings per common share $ 4.29 $ 3.51 $ 0.95 $ 0.68
22.2 39.7
Earnings per common share --
assuming dilution $ 4.27 $ 3.49 $ 0.94 $ 0.68
22.3 38.2
Average shares outstanding 165.7 169.6 165.3 166.0
(2.3) (0.4)
Average shares outstanding --
assuming dilution 166.5 170.9 166.5 167.1
(2.6) (0.4)
(a) The twelve months ended December 31, 2006 includes pretax charges of $173 million for estimated environmental remediation
costs at sites in New Jersey and Louisiana, pretax charges of $42 million for legal settlements and pretax earnings of
$39 million for insurance recoveries. The three months ended December 31, 2005 included pretax charges of $27 million
related to impairment of certain assets in our specialty chemicals business and $16 million for direct costs related to hurricanes.
The twelve months ended December 31, 2005 included pretax charges of $211 million for legal settlements, $34 million for
direct costs related to hurricanes, $27 million related to impairment of certain assets in our specialty chemicals business and
$19 million for debt refinancing costs. The twelve months ended December 31, 2005 also included pretax earnings of $18
million for an insurance recovery.
(b) The twelve months ended December 31, 2006, includes aftertax charges of $106 million for estimated environmental
remediation costs at sites in New Jersey and Louisiana, aftertax charges of $26 million for legal settlements and aftertax
earnings of $24 million for insurance recoveries. The three months ended December 31, 2005 included aftertax charges of
$17 million related to impairment of certain assets in our specialty chemicals business and $10 million for direct costs related to
hurricanes. The twelve months ended December 31, 2005 included aftertax charges of $128 million for legal settlements,
$21 million for direct costs related to hurricanes, $17 million related to impairment of certain assets in our specialty chemicals
business and $12 million for debt refinancing costs. The twelve months ended December 31, 2005 also included aftertax
earnings of $11 million for an insurance recovery.
22. 22
Business Segment Information
4th Quarter Results
(Millions of Dollars)
Net Sales Segment Income (Loss)
2006 2005 2006 2005
COATINGS $ 1,675 $ 1,388 $ 205 $ 180
GLASS 513 548 20 (1)
CHEMICALS (a) 585 569 79 23
SUBTOTAL $ 2,773 $ 2,505 $ 304 $ 202
INTEREST EXPENSE - NET (16) (16)
ASBESTOS SETTLEMENT - NET (5) (6)
COMPENSATION COST ASSOCIATED WITH
STOCK OPTIONS (7) (6)
OTHER UNALLOCATED CORP. EXPENSE - NET (23) 13
INCOME BEFORE INCOME TAXES AND
MINORITY INTEREST $ 253 $ 187
23. 23
2006 RESULTS
(Millions of Dollars)
Net Sales Segment Income
2006 2005 2006 2005
COATINGS (b) $ 6,299 $ 5,566 $ 829 $ 609
GLASS (c) 2,253 2,237 140 56
CHEMICALS (d) 2,485 2,398 314 451
SUBTOTAL $ 11,037 $ 10,201 $ 1,283 $ 1,116
INTEREST EXPENSE - NET (69) (68)
ASBESTOS SETTLEMENT - NET (28) (22)
COMPENSATION COST ASSOCIATED WITH
STOCK OPTIONS (31) (28)
OTHER UNALLOCATED CORP. EXPENSE - NET (e) (95) (51)
INCOME BEFORE INCOME TAXES AND
MINORITY INTEREST
$ 1,060 $ 947
a. Segment income for the three months ended December 31, 2005 included pretax charges of $16 million for
direct costs related to hurricanes and $27 million related to impairment of certain assets in our specialty
chemicals business.
b. Segment income for the twelve months ended December 31, 2006, includes pretax charges of $32 million for
business restructuring, pretax charges of $23 million for a legal settlement, and pretax earnings of $28 million
for insurance recoveries. Segment income for the twelve months ended December 31, 2005, included pretax
charges of $150 million for legal a settlement and pretax earnings of $18 million for an insurance recovery.
c. Segment income for the twelve months ended December 31, 2006, includes pretax charges of $4 million for
business restructuring. Segment income for the twelve months ended December 31, 2005, included pretax
charges of $61 million for a legal settlement.
d. Segment income for the twelve months ended December 31, 2006, included pretax charges of $173 million for
environmental remediation, pretax charges of $1 million for business restructuring, and pretax earnings
of $11 million for an insurance recovery. Segment income for the three months ended December 31, 2005
included pretax charges of $16 million for direct costs related to hurricanes and $27 million related to impairment
of certain assets in our specialty chemicals business. Segment income for the twelve months ended
December 31, 2005, included pretax charges of $34 million for direct costs related to hurricanes and $27 million
related to impairment of certain assets in our specialty chemicals business.
e. Other unallocated corporate (expense) income for the three months ended December 31, 2006 increased
in part due to higher compensation, medical and pension costs and a reduction in the amount of insurance
recoveries. Other unallocated corporate (expense) income for the twelve months ended December 31,
2006 increased in part due to higher compensation, medical, pension and legal costs and a reduction in the
amount of insurance recoveries. In addition, other unallocated corporate (expense) income for the twelve
months ended December 31, 2005 included pretax charges of $19 million for debt refinancing costs that
did not recur in 2006.
24. 24
Forward-Looking Statement
Statements contained herein relating to matters that are not historical facts are
forward-looking statements reflecting PPG’s current view with respect to future events
or objectives and financial or operational performance or results. These matters involve
risks and uncertainties, as discussed in PPG’s filings with the Securities and Exchange
Commission pursuant to Sections 13(a), 13(c) or 15(d) of the Securities Exchange Act
of 1934, as amended, and the rules and regulations promulgated thereunder.
Accordingly, many factors may cause actual results to differ materially from the
forward-looking statements contained herein.
Such factors include increasing price and product competition by foreign and domestic
competitors, fluctuations in cost and availability of raw materials and energy, the ability
to maintain favorable supplier relationships and arrangements, economic and political
conditions in international markets, foreign exchange rates and fluctuations in such
rates, and the unpredictability of existing and possible future litigation, including
litigation that could result if the asbestos settlement discussed in PPG's filings with the
SEC does not become effective. However, it is not possible to predict or identify all
such factors. Consequently, while the list of factors presented here is considered
representative, no such list should be considered to be a complete statement of all
potential risks and uncertainties. Unlisted factors may present significant additional
obstacles to the realization of forward-looking statements.
Consequences of material differences in results compared with those anticipated in the
forward-looking statements could include, among other things, business disruption,
operational problems, financial loss, legal liability to third parties and similar risks, any
of which could have a material adverse effect on PPG’s consolidated financial
condition, operations or liquidity.