1. DANAHER CORPORATION AND SUBSIDIARIES
SUPPLEMENTAL FINANCIAL INFORMATION
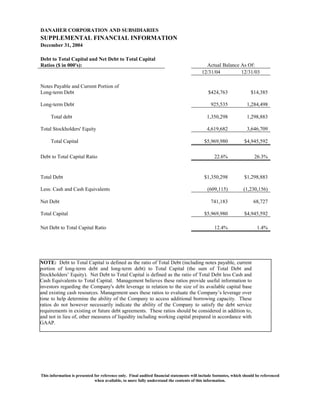
December 31, 2004
Debt to Total Capital and Net Debt to Total Capital
Actual Balance As Of:
Ratios ($ in 000's):
12/31/04 12/31/03
Notes Payable and Current Portion of
Long-term Debt $424,763 $14,385
Long-term Debt 925,535 1,284,498
Total debt 1,350,298 1,298,883
Total Stockholders' Equity 4,619,682 3,646,709
Total Capital $5,969,980 $4,945,592
Debt to Total Capital Ratio 22.6% 26.3%
Total Debt $1,350,298 $1,298,883
Less: Cash and Cash Equivalents (609,115) (1,230,156)
Net Debt 741,183 68,727
Total Capital $5,969,980 $4,945,592
Net Debt to Total Capital Ratio 12.4% 1.4%
NOTE: Debt to Total Capital is defined as the ratio of Total Debt (including notes payable, current
portion of long-term debt and long-term debt) to Total Capital (the sum of Total Debt and
Stockholders’ Equity). Net Debt to Total Capital is defined as the ratio of Total Debt less Cash and
Cash Equivalents to Total Capital. Management believes these ratios provide useful information to
investors regarding the Company's debt leverage in relation to the size of its available capital base
and existing cash resources. Management uses these ratios to evaluate the Company’s leverage over
time to help determine the ability of the Company to access additional borrowing capacity. These
ratios do not however necessarily indicate the ability of the Company to satisfy the debt service
requirements in existing or future debt agreements. These ratios should be considered in addition to,
and not in lieu of, other measures of liquidity including working capital prepared in accordance with
GAAP.
This information is presented for reference only. Final audited financial statements will include footnotes, which should be referenced
when available, to more fully understand the contents of this information.
2. DANAHER CORPORATION AND SUBSIDIARIES
SUPPLEMENTAL FINANCIAL INFORMATION
December 31, 2004
Year Ended
Free Cash Flows ($ in 000's):
12/31/04 12/31/03
Operating Cash Flows $ 1,033,216 $ 861,544
Payments for Property, Plant & Equipment (Capital
Expenditures) $ (115,906) $ (80,343)
Free Cash Flow $ 917,310 $ 781,201
Ratio of Free Cash Flow to Net Earnings:
Free Cash Flow from Above $ 917,310 $ 781,201
Net Earnings from Continuing Operations 746,000 536,834
Free Cash Flow to Net Earnings 1.23 1.46
NOTE: Free cash flow is defined as operating cash flow less purchases of property, plant and equipment. Management
believes that free cash flow provides useful information to investors regarding the Company's ability to generate cash
without external financings. Management uses free cash flow to help gauge the resources available for strategic
opportunities such as making acquisitions, investing in the business and strengthening the Company's balance sheet, and
uses this measure in making operating decisions, allocating financial resources and for budget planning purposes. Free
cash flow does not, however, take into account the Company's debt service requirements and other non-discretionary
expenditures and therefore is not necessarily indicative of amounts of cash that may be available for discretionary uses.
Free cash flow should be considered in addition to, and not in lieu of, cash flow from operations, net earnings and other
measures of financial performance prepared in accordance with GAAP.
This information is presented for reference only. Final audited financial statements will include footnotes, which should be referenced
when available, to more fully understand the contents of this information.