1. Page 1
FINANCIAL DISCUSSION DOCUMENT
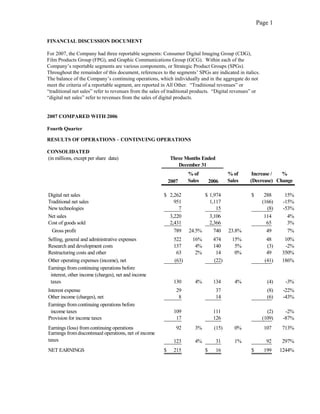
For 2007, the Company had three reportable segments: Consumer Digital Imaging Group (CDG),
Film Products Group (FPG), and Graphic Communications Group (GCG). Within each of the
Company’s reportable segments are various components, or Strategic Product Groups (SPGs).
Throughout the remainder of this document, references to the segments’ SPGs are indicated in italics.
The balance of the Company’s continuing operations, which individually and in the aggregate do not
meet the criteria of a reportable segment, are reported in All Other. “Traditional revenues” or
“traditional net sales” refer to revenues from the sales of traditional products. “Digital revenues” or
“digital net sales” refer to revenues from the sales of digital products.
2007 COMPARED WITH 2006
Fourth Quarter
RESULTS OF OPERATIONS – CONTINUING OPERATIONS
CONSOLIDATED
(in millions, except per share data) Three Months Ended
December 31
% of % of Increase / %
Sales Sales (Decrease) Change
2007 2006
Digital net sales $ 2,262 $ 1,974 $ 288 15%
Traditional net sales 951 1,117 (166) -15%
New technologies 7 15 (8) -53%
Net sales 3,220 3,106 114 4%
Cost of goods sold 2,431 2,366 65 3%
Gross profit 789 24.5% 740 23.8% 49 7%
Selling, general and administrative expenses 522 16% 474 15% 48 10%
Research and development costs 137 4% 140 5% (3) -2%
Restructuring costs and other 63 2% 14 0% 49 350%
Other operating expenses (income), net (63) (22) (41) 186%
Earnings from continuing operations before
interest, other income (charges), net and income
taxes 130 4% 134 4% (4) -3%
Interest expense 29 37 (8) -22%
Other income (charges), net 8 14 (6) -43%
Earnings from continuing operations before
income taxes 109 111 (2) -2%
Provision for income taxes 17 126 (109) -87%
Earnings (loss) from continuing operations 92 3% (15) 0% 107 713%
Earnings from discontinued operations, net of income
taxes 123 4% 31 1% 92 297%
NET EARNINGS $ 215 $ 16 $ 199 1244%
2. Page 2
Three Months Ended
December 31 Change vs. 2006
2007 Change vs. Foreign Manufacturing
Amount 2006 Volume Price/Mix Exchange and Other Costs
Total net sales $ 3,220 3.7% 4.0% -4.6% 4.3% 0.0%
Gross profit margin 24.5% 0.7pp 0.2pp -6.6pp 2.3pp 4.8pp
Worldwide Revenues
For the three months ended December 31, 2007, net sales increased as compared with the same period
in 2006, as significant increases in digital revenues in both CDG and GCG were partially offset by
industry-related volume declines in the traditional businesses within all three segments. In addition,
foreign exchange resulted in a positive impact to net sales during the quarter. Volume increases were
primarily driven by higher sales of digital cameras and the new digital picture frames category within
CDG and digital prepress consumables within GCG, partially offset by volume declines within
traditional SPGs and snapshot printing. Unfavorable price/mix was primarily driven by the impact
associated with new and renewed film agreements in FPG and product portfolio changes in Digital
Capture and Devices, partially offset by increased intellectual property royalties within CDG.
Gross Profit
Gross profit improved in the fourth quarter of 2007 in both dollars and as a percentage of sales, due
largely to reduced manufacturing and other costs, as well as increased intellectual property royalties
within CDG. In addition, foreign exchange was a positive contributor to gross profit as a result of the
weak U.S. dollar. The decreases in manufacturing and other costs were driven by a combination of
the impact of the Company's cost reduction initiatives, strategic manufacturing and supply chain
initiatives within CDG, lower restructuring-related charges, and lower depreciation expense, partially
offset by increased silver and aluminum costs. These increases to gross profit margins were partially
offset by costs associated with the introduction of inkjet printers and unfavorable price/mix, which
was primarily driven by product portfolio changes in Digital Capture and Devices within CDG, and
the impact associated with new and renewed film agreements in FPG.
Included in gross profit for the quarter are new non-recurring licensing arrangements within Digital
Capture and Devices, contributing approximately 5.2% of revenue to consolidated gross profit dollars in
the current quarter, as compared with 4.0% of revenue to consolidated gross profit dollars for similar
arrangements in the prior year quarter.
Selling, General and Administrative Expenses
The year-over-year increase in consolidated SG&A was primarily attributable to increased advertising
costs related to Consumer Inkjet Systems within CDG.
Restructuring Costs and Other
These costs, as well as the restructuring-related costs reported in cost of goods sold, are discussed
under quot;RESTRUCTURING COSTS AND OTHERquot; below.
3. Page 3
Other Operating Expenses (Income), Net
This category includes gains and losses on sales of capital assets and certain asset impairment
charges. The year-over-year change was largely driven by significant one-time gains on numerous
sales of capital assets in the current year quarter of $116 million, partially offset by an impairment of
an intangible asset of $46 million in connection with the Company’s plan to dispose of its stake in
Lucky Film Co. Ltd.
Interest Expense
Lower interest expense was primarily due to lower debt levels resulting from the full payoff of the
Company's Secured Term Debt in the second quarter of 2007, partially offset by higher interest rates
in the current year quarter.
Other Income (Charges), Net
This category includes interest income, income and losses from equity investments, and foreign
exchange gains and losses. The decrease compared with the prior year was primarily attributable to
an impairment of an equity method investment, and current quarter losses on foreign exchange
transactions. These decreases were partially offset by higher interest income due to higher year-over-
year cash balances resulting from the proceeds on the sale of the Health Group, and higher interest
rates.
Income Tax (Benefit) Provision
Three Months Ended
(dollars in millions)
December 31
2007 2006
Earnings from continuing operations before
income taxes $109 $111
Provision for income taxes $17 $126
Effective tax rate 15.6% 113.5%
Provision for income taxes @ 35% $38 $39
Difference between tax at effective vs statutory rate ($21) $87
For the three months ended December 31, 2007, the difference between the Company's recorded
provision and the provision that would result from applying the U.S. statutory rate of 35.0% is
primarily attributable to: (1) losses generated in certain jurisdictions outside the U.S., which were
not benefited, (2) the mix of earnings from operations in certain lower-taxed jurisdictions outside
the U.S., (3) a tax benefit of $20 million associated with valuation allowance releases in certain
jurisdictions outside the U.S. , and (4) a tax provision of $18 million relating primarily to tax rate
changes, impacts from ongoing tax audits with respect to open tax years and other property sales
and impairments.
In accordance with SFAS No. 109, quot;Accounting for Income Taxes,quot; the Company recorded a tax
benefit in continuing operations associated with the realization of current year losses in certain
jurisdictions where it has historically had a valuation allowance due to the recognition of the pre-
tax gain in discontinued operations.
For the three months ended December 31, 2006, the difference between the recorded provision and
the provision that would result from applying the U.S. statutory rate of 35.0% is primarily
4. Page 4
attributable to: (1) losses generated within the U.S. and in certain jurisdictions outside the U.S.,
which were not benefited, (2) the mix of earnings from operations in certain lower-taxed
jurisdictions outside the U.S., (3) a tax provision of $38 million associated with restructuring costs
and asset impairments, (4) discrete tax benefits of $13 million relating primarily to tax rate changes,
impacts from ongoing tax audits with respect to open tax years, and other property sales
gains/losses, and (5) a tax provision of $89 million associated with the establishment of valuation
allowances in certain jurisdictions outside the U.S.
CONSUMER DIGITAL IMAGING GROUP
(dollars in millions) Three Months Ended
December 31
% of % of Increase / %
Sales Sales (Decrease) Change
2007 2006
Digital net sales $ 1,371 $ 1,175 $ 196 17%
Traditional net sales 359 420 (61) -15%
Total net sales 1,730 1,595 135 8%
Cost of goods sold 1,344 1,268 76 6%
Gross profit 386 22.3% 327 20.5% 59 18%
Selling, general and administrative expenses 246 14% 196 12% 50 26%
Research and development costs 64 4% 68 4% (4) -6%
Earnings from continuing operations
before interest, other income (charges), net
and income taxes $ 76 4% $ 63 4% $ 13 21%
Three Months Ended
December 31 Change vs. 2006
2007 Change vs. Foreign Manufacturing
Amount 2006 Volume Price/Mix Exchange and Other Costs
Total net sales $ 1,730 8.5% 9.4% -4.4% 3.5% 0.0%
Gross profit margin 22.3% 1.8pp 0.4pp -8.6pp 2.3pp 7.7pp
Worldwide Revenues
The 8% sales growth in the quarter over the prior-year quarter was due to increases in the digital
businesses, primarily driven by increased intellectual property royalties, volume increases in digital
cameras, new digital picture frames, kiosk media, and inkjet printers. These increases were
partially offset by volume declines in snapshot printing, the traditional portion of Retail Printing,
and negative price/mix, due to product portfolio changes in digital cameras.
Net worldwide sales of Digital Capture and Devices, which includes consumer digital cameras,
accessories, memory products, snapshot printers and related media, and intellectual property
royalties, increased 17% in the fourth quarter of 2007 as compared with the prior year quarter,
5. Page 5
primarily reflecting higher digital camera volumes, sales of new digital picture frames, increased
intellectual property royalties, and favorable exchange, partially offset by negative price/mix and
lower snapshot printing volumes. For digital still cameras, Kodak remains in the top three market
position on a worldwide basis year-to-date through November.
Retail Printing includes color negative paper, photochemicals, service and support, photofinishing
services, and retail kiosks and related media. Net worldwide sales of Retail Printing decreased 9%
in the fourth quarter of 2007 as compared with the prior year quarter, reflecting volume declines in
the traditional portion of the business reflecting continuing industry volume declines, and negative
price/mix in kiosks and related media, partially offset by favorable foreign exchange. These
declines were partially offset by increased sales of kiosks and related media, which increased 6%
from the prior year quarter.
Gross Profit
The increase in gross profit for CDG was primarily attributable to reductions in cost, increases in
intellectual property royalties, favorable foreign exchange and increases in volume. The reductions in
manufacturing and other costs were primarily driven by strategic manufacturing and supply chain
initiatives to improve margins in Digital Capture and Devices. In addition, cost reductions were driven by
the benefits of previous restructuring activities and lower depreciation expense, partially offset by adverse
silver costs, and costs associated with the scaling of manufacturing and new product introduction activities
in the Consumer Inkjet Systems business. The gross profit margin improvement was partially offset by
unfavorable price/mix in Digital Capture and Devices products.
Included in gross profit for the quarter is the impact of new non-recurring licensing arrangements, which
contributed approximately 9.7% of revenue to segment gross profit dollars in the current quarter, as
compared with 7.7% of revenue to segment gross profit dollars for similar arrangements in the prior year
quarter. These types of arrangements provide the Company with a return on portions of historical R&D
investments and similar opportunities are expected to have a continuing impact on the results of operations.
Selling, General and Administrative Expenses
The increase in SG&A expenses for CDG was primarily driven by increased advertising expenses
associated with the introduction of Consumer Inkjet Systems, partially offset by focused cost reduction
initiatives and lower-cost go-to-market structure.
6. Page 6
FILM PRODUCTS GROUP
(dollars in millions) Three Months Ended
December 31
% of % of Increase / %
Sales Sales (Decrease) Change
2007 2006
Total net sales $ 463 $ 559 $ (96) -17%
Cost of goods sold 326 361 (35) -10%
Gross profit 137 29.6% 198 35.4% (61) -31%
Selling, general and administrative expenses 90 19% 106 19% (16) -15%
Research and development costs 7 2% 9 2% (2) -22%
Earnings from continuing operations before
interest, other income (charges), net and
income taxes $ 40 9% $ 83 15% $ (43) -52%
Three Months Ended
December 31 Change vs. 2006
2007 Change vs. Foreign Manufacturing
Amount 2006 Volume Price/Mix Exchange and Other Costs
Total net sales $ 463 -17.2% -13.4% -7.5% 3.7% 0.0%
Gross profit margin 29.6% -5.8pp -0.5pp -6.6pp 3.1pp -1.8pp
Worldwide Revenues
The decrease in FPG worldwide net sales was comprised of: (1) lower volumes, which were in line
with industry trends, and (2) declines related to negative price/mix associated with new and
renewed film agreements, and geographic mix. These decreases were partially offset by favorable
foreign exchange.
Net worldwide sales of Film Capture, including consumer roll film (35mm and APS film), one-
time-use cameras (OTUC), professional films, and reloadable traditional film cameras, decreased
29% in the fourth quarter of 2007 as compared with the fourth quarter of 2006, primarily reflecting
continuing industry volume declines and negative price/mix, partially offset by favorable exchange.
Net worldwide sales for Entertainment Imaging, which includes origination, intermediate, and print
films, and digital systems and services for the entertainment industry, decreased 7% compared with
the prior year, primarily reflecting negative price/mix and the initial effects of the writers’ strike,
partially offset by foreign exchange effects.
Gross Profit
The decrease in FPG gross profit margin was primarily attributable to seasonal manufacturing
slowdowns, unfavorable price/mix associated with the impact of new and renewed film agreements,
7. Page 7
volume declines in line with industry trends and the initial effects of the writers’ strike, and increased
silver costs, partially offset by favorable foreign exchange.
Selling, General and Administrative Expenses
The decline in SG&A expenses for FPG was attributable to the concentrated efforts of the business to
achieve target cost models.
GRAPHIC COMMUNICATIONS GROUP
(dollars in millions) Three Months Ended
December 31
% of % of Increase / %
Sales Sales (Decrease) Change
2007 2006
Digital net sales $ 891 $ 799 $ 92 12%
Traditional net sales 107 134 (27) -20%
Total net sales 998 933 65 7%
Cost of goods sold 729 663 66 10%
Gross profit 269 27.0% 270 28.9% (1) 0%
Selling, general and administrative expenses 183 18% 173 19% 10 6%
Research and development costs 53 5% 50 5% 3 6%
Earnings from continuing operations before
interest, other income (charges), net and
income taxes $ 33 3% $ 47 5% $ (14) -30%
Three Months Ended
December 31 Change vs. 2006
2007 Change vs. Foreign Manufacturing
Amount 2006 Volume Price/Mix Exchange and Other Costs
Total net sales $ 998 7.0% 4.0% -3.2% 6.2% 0.0%
Gross profit margin 27.0% -1.9pp 0.3pp -0.8pp 1.3pp -2.7pp
Worldwide Revenues
Digital revenue growth in the quarter of 12% resulted in total revenue growth of 7% for GCG during
the quarter, led by volume increases and favorable foreign exchange. Specifically, volume growth
was driven by Prepress Solutions, Digital Printing Solutions, and Document Imaging. Within
Prepress Solutions, volume growth in digital prepress consumables was partially offset by volume
declines in traditional prepress consumables.
Net worldwide sales of Prepress Solutions, including consumables, prepress equipment and related
services, increased 6%, primarily driven by increased sales of digital plates, equipment and services,
partially offset by declines in sales of analog plates and graphics film.
8. Page 8
Net worldwide sales of Document Imaging, which includes document scanners and services, media,
and imaging services, increased 7% compared with the prior year quarter, driven by increased
revenue in scanners. Volume of production scanners (high volume input scanners) continue to show
strong growth in addition to increased participation in the distributed capture scanner market
(desktop scanners).
Net worldwide sales of Digital Printing Solutions, including all continuous inkjet and
electrophotographic equipment, consumables and service, increased 15%, primarily driven by strong
sales in color electrophotography and continuous inkjet equipment and digital printing consumables.
Color electrophotography page volume increased 34%. These improvements were partially offset by
a decline in volume of black-and-white electrophotography.
Net worldwide sales of Enterprise Solutions, which includes workflow software and digital
controller development, increased 9%, primarily attributable to the introduction of web-enabled
solutions software and growth in the workflow software.
Gross Profit
The decrease in gross profit margin was primarily driven by increased manufacturing costs in
Prepress Solutions associated with aluminum and silver. The unfavorable price/mix is largely
related to the Document Imaging product portfolio shift to distributed capture scanners and to
unfavorable price/mix in Inkjet Printing Solutions and the impact of a licensing settlement. These
unfavorable items were partially offset by favorable foreign exchange and volume increases.
Selling, General and Administrative Expenses
The increase in SG&A expenses for GCG is largely attributable to increased investment in sales
resources and unfavorable foreign exchange, partially offset by cost-reduction initiatives.
RESULTS OF OPERATIONS - DISCONTINUED OPERATIONS
On April 30, 2007, the Company sold all of the assets and business operations of its Health Group
segment to Onex Healthcare Holdings, Inc. (“Onex”) (now known as Carestream Health, Inc.), a
subsidiary of Onex Corporation, for up to $2.55 billion. The price was composed of $2.35 billion in
cash at closing and $200 million in additional future payments if Onex achieves certain returns with
respect to its investment. If Onex investors realize an internal rate of return in excess of 25% on their
investment, the Company will receive payment equal to 25% of the excess return, up to $200 million.
The Company recognized a pre-tax gain of $980 million on the sale in the second quarter of 2007, and
since that time recorded pre-tax true-up adjustments totaling $6 million, primarily related to pension
settlements, for a total pre-tax gain on sale of the Health Group segment of $986 million. The pre-tax
gain excludes the following: up to $200 million of potential future payments related to Onex's return
on its investment as noted above; potential charges related to settling pension obligations with Onex in
future periods; and any adjustments that may be made in the future that are currently under review.
The Company used a portion of the initial $2.35 billion cash proceeds to fully repay its approximately
$1.15 billion of Secured Term Debt. About 8,100 employees of the Company associated with the
Health Group transitioned to Carestream Health, Inc. as part of the transaction. Also included in the
sale were manufacturing operations focused on the production of health imaging products, as well as
an office building in Rochester, NY.
Upon authorization of the Company's Board of Directors on January 8, 2007, the Company met all
the requirements of SFAS No. 144, quot;Accounting for the Impairment or Disposal of Long-Lived
9. Page 9
Assets,quot; for accounting for the Health Group segment as a discontinued operation. As such, the
Health Group business ceased depreciation and amortization of long-lived assets. In accordance
with EITF No. 87-24, quot;Allocation of Interest to Discontinued Operations,quot; the Company allocated
certain interest expense on debt that was required to be repaid as a result of the sale. Interest
expense allocated to discontinued operations totaled $23 million for the three months ended
December 31, 2006.
On November 2, 2007, the Company sold all of its shares in Hermes Precisa Pty Limited (“HPA”), a
majority owned subsidiary of Kodak Australasia Pty. Ltd., a wholly owned subsidiary of the
Company, to Salmat Limited. HPA, a publicly traded Australian company, is a provider of
outsourced services in business communication and data processes, and was previously reported in
the GCG segment. Kodak received $139 million in cash at closing for its shares of HPA, and
recognized a pre-tax gain on the sale of $123 million. This gain, as well as the results of operations
of HPA through the date of sale, is reported as a component of discontinued operations in the current
and prior periods.
RESTRUCTURING COSTS AND OTHER
The Company has undertaken a cost reduction program that was initially announced in January 2004.
This program is referred to as the “2004–2007 Restructuring Program.” This program was expected
to result in total charges of $1.3 billion to $1.7 billion over a three-year period ending in 2006, of
which $700 million to $900 million related to severance, with the remainder relating to the disposal of
buildings and equipment. Overall, Kodak's worldwide facility square footage was expected to be
reduced by approximately one-third. Approximately 12,000 to 15,000 positions worldwide were
expected to be eliminated through these actions primarily in global manufacturing, selected traditional
businesses and corporate administration.
The Company subsequently expanded the program to extend into 2007 and increased the expected
employment reductions to 28,000 to 30,000 positions and total charges to $3.6 billion to $3.8 billion.
In the third quarter of 2007, the Company revised its expectations for total employment reductions in
the range of 27,000 to 28,000 positions and total charges in the range of $3.4 billion to $3.6 billion.
These new estimates reflected greater efficiencies in manufacturing infrastructure projects as well as
the Company's ability to outsource or sell certain operations, which reduces involuntary severance
charges.
The aforementioned 2004-2007 Restructuring Program underpins a dramatic transformation of the
Company focused on two primary elements of cost restructuring: manufacturing infrastructure
and operating expense rationalization. As this four-year effort progressed, the underlying business
model necessarily evolved, requiring broader and more costly manufacturing infrastructure
reductions (primarily non-cash charges) than originally anticipated, as well as similarly broader
rationalization of selling, administrative and other business resources (primarily severance
charges). In addition, the recent divestiture of the Health Group has further increased the amount
of reductions necessary to appropriately scale the Corporate infrastructure.
The actual charges for initiatives under this program are recorded in the period in which the
Company commits to formalized restructuring plans or executes the specific actions contemplated by
the program and all criteria for restructuring charge recognition under the applicable accounting
guidance have been met.
10. Page 10
Restructuring Programs Summary
The activity in the accrued restructuring balances and the non-cash charges incurred in relation to all of the
Company's restructuring programs were as follows for the fourth quarter of 2007:
Other
Balance Adjustments Balance
Sept. 30, Costs Cash Non-cash and Dec. 31
(in millions) 2007 Incurred (1) Reversals Payments (2) Settlements Reclasses (3) 2007
2004-2007 Restructuring Program:
Severance reserve $ 163 $ 17 $ - $ (60) $ - $ 9 $ 129
Exit costs reserve 24 43 - (37) - - 30
Total reserve $ 187 $ 60 $ - $ (97) $ - $ 9 $ 159
Long-lived asset impairments and
inventory write-downs $ - $ 4 $ - $ - $ (4) $ - $ -
Accelerated depreciation $ - $ 4 $ - $ - $ (4) $ - $ -
Pre-2004 Restructuring Programs:
Severance reserve $ - $ - $ - $ - $ - $ - $ -
Exit costs reserve 6 - - (1) - - 5
Total reserve $ 6 $ - $ - $ (1) $ - $ - $ 5
Total of all restructuring programs $ 193 $ 68 $ - $ (98) $ (8) $ 9 $ 164
(1) The $68 million of costs incurred in the fourth quarter include only continuing operations.
(2) During the three months ended December 31, 2007, the Company paid approximately $101
million related to restructuring. Of this total amount, $98 million was recorded against
restructuring reserves, while $3 million was recorded against pension and other postretirement
liabilities.
(3) The total restructuring charges of $68 million include pension and other postretirement charges
and credits for curtailments, settlements and special termination benefits. However, because the
impact of these charges and credits relate to the accounting for pensions and other postretirement
benefits, the related impacts on the Consolidated Statement of Financial Position are reflected in
their respective components as opposed to within the accrued restructuring balances at December
31, 2007. Accordingly, the Other Adjustments and Reclasses column of the table above includes
reclassifications to Other long-term assets and Pension and other postretirement liabilities for the
position elimination-related impacts on the Company's pension and other postretirement employee
benefit plan arrangements, including net curtailment, settlement and special termination benefit
gains (losses) of $6 million. Additionally, the Other Adjustments and Reclasses column of the
table above includes foreign currency translation of $3 million.
The costs incurred which total $68 million for the three months ended December 31, 2007, include $4
million and $1 million of charges related to accelerated depreciation and inventory write-downs that
were reported in cost of goods sold in the accompanying Consolidated Statement of Operations for
the three months ended December 31, 2007. Of the remaining costs incurred, $63 million was
reported as restructuring costs and other in the accompanying Consolidated Statement of Operations
for the three months ended December 31, 2007. The severance costs and exit costs require the outlay
of cash, while long-lived asset impairments, accelerated depreciation and inventory write-downs
represent non-cash items.
11. Page 11
2004-2007 Restructuring Program Activity
The Company implemented certain actions under the program during the fourth quarter of 2007. As a
result of these actions, the Company recorded charges of $68 million in the fourth quarter of 2007,
which were composed of severance, long-lived asset impairments, exit costs, inventory write-downs,
and accelerated depreciation of $17 million, $3 million, $43 million, $1 million, and $4 million,
respectively. The severance costs related to the elimination of approximately 625 positions, including
approximately 225 photofinishing, 150 manufacturing, 75 research and development and 175
administrative positions. The geographic composition of the positions to be eliminated includes
approximately 450 in the United States and Canada and 175 throughout the rest of the world. The
reduction of the 625 positions and the $68 million charges are reflected in the 2004-2007
Restructuring Program table below. The $3 million charge in the fourth quarter for long-lived asset
impairments was included in restructuring costs and other in the accompanying Consolidated
Statement of Operations for the three months ended December 31, 2007, respectively. The charges
taken for inventory write-downs of $1 million were reported in cost of goods sold in the
accompanying Consolidated Statement of Operations for the three months ended December 31, 2007.
As a result of initiatives implemented under the 2004-2007 Restructuring Program, the Company
also recorded $4 million of accelerated depreciation on long-lived assets in cost of goods sold in the
accompanying Consolidated Statement of Operations for the three months ended December 31,
2007. The accelerated depreciation relates to long-lived assets accounted for under the held and
used model of SFAS No. 144. The total amount of $4 million relates to manufacturing facilities and
equipment that will be used until their abandonment.
In April 2007, the Company entered into an agreement to sell its manufacturing site in Xiamen,
China. This sale closed in the second quarter of 2007 and resulted in a non-cash charge of
approximately $238 million. This action is part of the 2004-2007 Restructuring Program.
Under this program, on a life-to-date basis as of December 31, 2007, the Company has recorded
charges of $3,397 million, which was composed of severance, long-lived asset impairments, exit
costs, inventory write-downs and accelerated depreciation of $1,398 million, $620 million, $385
million, $80 million and $935 million, respectively, less reversals of $21 million. The severance
costs related to the elimination of approximately 27,650 positions, including approximately 6,750
photofinishing, 13,125 manufacturing, 1,575 research and development and 6,200 administrative
positions.
The following table summarizes the activity with respect to the charges recorded in connection with
the focused cost reduction actions that the Company has committed to under the 2004-2007
Restructuring Program and the remaining balances in the related reserves at December 31, 2007:
13. Page 13
As a result of the initiatives already implemented under the 2004-2007 Restructuring Program,
severance payments will be paid during periods through 2008 since, in many instances, the
employees whose positions were eliminated can elect or are required to receive their payments over
an extended period of time. Most exit costs were paid during 2007. However, certain costs, such
as long-term lease payments, will be paid over periods after 2007.
The charges of $68 million recorded in the fourth quarter of 2007 included $1 million applicable to
FPG, $14 million applicable to CDG, $25 million applicable to GCG, and $28 million that was
applicable to manufacturing, research and development, and administrative functions, which are
shared across all segments.
The restructuring actions implemented during the fourth quarter of 2007 under the 2004-2007
Restructuring Program are expected to generate future annual cost savings of approximately $62
million, including annual cash savings of $61 million. These cost savings began to be realized by
the Company beginning in the fourth quarter of 2007, and the majority of these savings are
expected to be realized by the end of 2008 as most of the actions and severance payouts are
completed. These total cost savings are expected to reduce future cost of goods sold, SG&A, and
R&D expenses by approximately $25 million, $29 million, and $8 million, respectively.
Based on all of the actions taken to date under the 2004-2007 Restructuring Program, the program
is expected to generate annual cost savings of approximately $1,680 million, including annual cash
savings of $1,605 million, as compared with pre-program levels. The Company began realizing
these savings in the second quarter of 2004, and expects the savings to be fully realized by the end
of 2008 as most of the actions and severance payouts are completed. These total cost savings are
expected to reduce cost of goods sold, SG&A, and R&D expenses by approximately $1,051
million, $473 million, and $156 million, respectively.
The above savings estimates are based primarily on objective data related to the Company's
severance actions. Savings resulting from facility closures and other non-severance actions that are
more difficult to quantify are not included. The Company reaffirms its estimate of total annual cost
savings including both employee-related costs and facility-related costs under the extended 2004-
2007 Restructuring Program of $1.6 billion to $1.8 billion, as announced in July 2005, and does not
expect the final annual cost savings to differ materially from this estimate.
14. Page 14
CASH FLOW ACTIVITY
The Company’s primary sources and uses of cash for the twelve month period ended December 31,
2007 included proceeds on the sale of the Health Group, earnings from continuing operations,
adjusted for non-cash items of income and expense, debt payments, restructuring payments, capital
additions, working capital needs, dividend payments and employee benefit plan
payments/contributions.
Net cash provided by continuing operations from operating activities was $352 million for the
twelve months ended December 31, 2007. The Company’s primary sources of cash from operating
activities for the period are earnings from continuing operations, as adjusted for non-cash items of
income and expense, which provided $652 million of operating cash in 2007, compared to $327
million in 2006. The Company’s other primary sources and uses of cash from operating activities
include:
• Decreases in inventories, driven by management of year-end inventory levels;
• The net decrease in liabilities, excluding borrowings, including:
o The decrease in pension and other postretirement liabilities due to settlement and
curtailment activities related to restructuring;
o Recognition of deferred income on intellectual property arrangements;
o Decrease in restructuring liabilities driven by cash payments for severance
benefits, partially offset by restructuring charges within the current year;
o The settlement of asset retirement obligations due to footprint reduction actions;
o These decreases were partially offset by an increase in trade accounts payable due
to the Company’s efforts to bring accounts payable metrics more in line with its
peer group.
Included in the uses of cash in operating activities discussed above were:
• Cash expenditures of $101 million against restructuring reserves and pension and other
postretirement liabilities, primarily for the payment of severance benefits. Employees whose
positions were eliminated could elect to receive severance payments for up to two years
following their date of termination.
• Contributions (funded plans) or benefit payments (unfunded plans) totaling approximately
$130 million relating to major U.S. and non-U.S. defined benefit pension plans.
• Benefit payments totaling approximately $218 million relating to U.S., United Kingdom,
Canada, and Brazil postretirement benefit plans.
Net cash used in continuing operations in investing activities for the twelve months ended December
31, 2007 of $41 million includes capital additions of $259 million. The majority of this spending
supports new products, manufacturing productivity and quality improvements, infrastructure
improvements, equipment placements with customers, and ongoing environmental and safety
initiatives. Proceeds from sales of businesses and assets in the period provided cash of $227 million.
Net cash provided by discontinued operations from investing activities was $2,449 million due to the
proceeds received in connection with the sale of the Health Group business, and HPA business
previously reported in GCG. The Company utilized a portion of this cash for the full repayment of the
Secured Term Debt, as reflected in net cash used in financing activities in the period.
Net cash used in continuing operations in financing activities was $1,325 million, including the
repayment of debt discussed above and dividends of $145 million.
15. Page 15
CAUTIONARY STATEMENT PURSUANT TO SAFE HARBOR PROVISIONS OF THE
PRIVATE SECURITIES LITIGATION REFORM ACT OF 1995
Certain statements in this report may be forward-looking in nature, or quot;forward-looking statementsquot;
as defined in the United States Private Securities Litigation Reform Act of 1995. For example,
references to the Company's expectations for cost savings and cash savings from restructuring are
forward-looking statements.
Actual results may differ from those expressed or implied in forward-looking statements. In
addition, any forward-looking statements represent the Company's estimates only as of the date
they are made, and should not be relied upon as representing the Company's estimates as of any
subsequent date. While the Company may elect to update forward-looking statements at some
point in the future, the Company specifically disclaims any obligation to do so, even if its estimates
change. The forward-looking statements contained in this report are subject to a number of factors
and uncertainties, including the successful:
• execution of the digital growth and profitability strategies, business model and cash plan;
• implementation of the cost reduction programs;
• transition of certain financial processes and administrative functions to a global shared
services model and the outsourcing of certain functions to third parties;
• implementation of, and performance under, the debt management program, including
compliance with the Company's debt covenants;
• development and implementation of product go-to-market and e-commerce strategies;
• protection, enforcement and defense of the Company's intellectual property, including
defense of its products against the intellectual property challenges of others;
• execution of intellectual property licensing programs and other strategies;
• integration of the Company's businesses to SAP, the Company's enterprise system
software;
• completion of various portfolio actions;
• reduction of inventories;
• integration of acquired businesses and consolidation of the Company's subsidiary
structure;
• improvement in manufacturing productivity and techniques;
• improvement in working capital management and cash conversion cycle;
• continued availability of essential components and services from concentrated sources of
supply;
• improvement in supply chain efficiency and dependability; and
• implementation of the strategies designed to address the decline in the Company's
traditional businesses.
The forward-looking statements contained in this report are subject to the following additional risk
factors:
• inherent unpredictability of currency fluctuations, commodity prices and raw material
costs;
• competitive actions, including pricing;
• the Company's ability to access capital markets;
• the nature and pace of technology evolution;
• changes to accounting rules and tax laws, as well as other factors which could impact the
Company's reported financial position or effective tax rate;
• pension and other postretirement benefit cost factors such as actuarial assumptions, market
performance, and employee retirement decisions;
16. Page 16
• general economic, business, geo-political and regulatory conditions or unanticipated
environmental liabilities or costs;
• changes in market growth;
• continued effectiveness of internal controls; and
• other factors and uncertainties disclosed from time to time in the Company's filings with
the Securities and Exchange Commission.
Any forward-looking statements in this report should be evaluated in light of these important
factors and uncertainties.
17. Page 17
Eastman Kodak Company
CONSOLIDATED STATEMENT OF OPERATIONS - UNAUDITED
Three Months Ended Twelve Months Ended
December 31 December 31
(in millions, except per share data) 2007 2006 2007 2006
Net sales $ 3,220 $ 3,106 $ 10,301 $ 10,568
Cost of goods sold 2,431 2,366 7,785 8,159
Gross profit 789 740 2,516 2,409
Selling, general and administrative expenses 522 474 1,764 1,950
Research and development costs 137 140 535 578
Restructuring costs and other 63 14 543 416
Other operating expenses (income), net (63) (22) (96) (59)
Earnings (loss) from continuing operations before interest,
other income (charges), net and income taxes 130 134 (230) (476)
Interest expense 29 37 113 172
Other income (charges), net 8 14 87 65
Earnings (loss) from continuing operations before income
taxes 109 111 (256) (583)
Provision (benefit) for income taxes 17 126 (51) 221
Earnings (loss) from continuing operations 92 (15) (205) (804)
Earnings from discontinued operations, net of income taxes 123 31 881 203
NET EARNINGS (LOSS) $ 215 $ 16 $ 676 $ (601)
Basic net earnings (loss) per share:
Continuing operations $ 0.32 $ (0.05) $ (0.71) $ (2.80)
Discontinued operations 0.43 0.11 3.06 0.71
Total $ 0.75 $ 0.06 $ 2.35 $ (2.09)
Diluted net earnings (loss) per share:
Continuing operations $ 0.31 $ (0.05) $ (0.71) $ (2.80)
Discontinued operations 0.40 0.11 3.06 0.71
Total $ 0.71 $ 0.06 $ 2.35 $ (2.09)
Number of common shares used in basic net earnings (loss)
per share 288.0 287.3 287.7 287.3
Incremental shares from assumed conversion of options 0.4 - - -
Convertible debt shares 18.6 - - -
Number of common shares used in diluted net earnings (loss)
per share 307.0 287.3 287.7 287.3
18. Page 18
Eastman Kodak Company
CONSOLIDATED STATEMENT OF FINANCIAL POSITION - UNAUDITED
(in millions, except share and per share data) At December 31,
2007 2006
ASSETS
CURRENT ASSETS
Cash and cash equivalents $ 2,947 $ 1,469
Receivables, net 1,939 2,072
Inventories, net 943 1,001
Deferred income taxes 120 108
Other current assets 104 96
Assets of discontinued operations - 811
Total current assets 6,053 5,557
Property, plant and equipment, net 1,811 2,602
Goodwill 1,657 1,584
Other long-term assets 4,138 3,509
Assets of discontinued operations - 1,068
TOTAL ASSETS $ 13,659 $ 14,320
LIABILITIES AND SHAREHOLDERS’ EQUITY
CURRENT LIABILITIES
Accounts payable and other current liabilities $ 3,794 $ 3,712
Short-term borrowings 308 64
Accrued income and other taxes 344 347
Liabilities of discontinued operations - 431
Total current liabilities 4,446 4,554
Long-term debt, net of current portion 1,289 2,714
Pension and other postretirement liabilities 3,444 3,934
Other long-term liabilities 1,451 1,690
Liabilities of discontinued operations - 40
Total liabilities 10,630 12,932
Commitments and Contingencies (Note 11)
SHAREHOLDERS’ EQUITY
Common stock, $2.50 par value, 950,000,000 shares authorized; 391,292,760
shares issued as of December 31, 2007 and 2006; 287,999,830 and
287,333,123 shares outstanding as of December 31, 2007 and 2006 978 978
Additional paid in capital 889 881
Retained earnings 6,474 5,967
Accumulated other comprehensive income (loss) 452 (635)
8,793 7,191
Treasury stock, at cost 103,292,930 shares as of December 31, 2007 and
103,959,637 shares as of December 31, 2006 5,764 5,803
Total shareholders’ equity 3,029 1,388
$ 13,659 $ 14,320
TOTAL LIABILITIES AND SHAREHOLDERS' EQUITY
19. Page 19
Eastman Kodak Company
CONSOLIDATED STATEMENT OF CASH FLOWS - UNAUDITED
Twelve Months Ended
December 31
2007 2006
Cash flows from operating activities:
Net earnings (loss) $ 676 $ (601)
Adjustments to reconcile to net cash provided by operating activities:
Earnings from discontinued operations, net of income taxes (881) (203)
Depreciation and amortization 785 1,195
Gain on sales of businesses/assets (157) (65)
Non-cash restructuring costs, asset impairments and other charges 336 138
Benefit for deferred income taxes (107) (137)
Decrease in receivables 161 163
Decrease in inventories 108 292
(Decrease) increase in liabilities excluding borrowings (463) 122
Other items, net (106) (219)
Total adjustments (324) 1,286
Net cash provided by continuing operations 352 685
Net cash (used in) provided by discontinued operations (37) 271
Net cash provided by operating activities 315 956
Cash flows from investing activities:
Additions to properties (259) (335)
Net proceeds from sales of businesses/assets 227 178
Acquisitions, net of cash acquired (2) (3)
Investments in unconsolidated affiliates - (19)
Marketable securities - sales 166 133
Marketable securities - purchases (173) (135)
Net cash used in continuing operations (41) (181)
Net cash provided by (used in) discontinued operations 2,449 (44)
Net cash provided by (used in) investing activities 2,408 (225)
Cash flows from financing activities:
Proceeds from borrowings 177 765
Repayment of borrowings (1,363) (1,568)
Dividends to shareholders (145) (144)
Exercise of employee stock options 6 -
Net cash used in continuing operations (1,325) (947)
Net cash provided by discontinued operations 44 -
Net cash used in financing activities (1,281) (947)
Effect of exchange rate changes on cash 36 20
Net increase (decrease) in cash and cash equivalents 1,478 (196)
Cash and cash equivalents, beginning of year 1,469 1,665
Cash and cash equivalents, end of year $ 2,947 $ 1,469
20. Page 20
Net Sales from Continuing Operations by Reportable Segment and All Other - Unaudited
(in millions) Three Months Ended December 31, Twelve Months Ended December 31,
Foreign Foreign
Currency Currency
2007 2006 Change Impact* 2007 2006 Change Impact*
Consumer Digital Imaging Group
Inside the U.S. $ 1,027 $ 995 3% 0% $ 2,525 $ 2,564 -2% 0%
Outside the U.S. 703 600 +17 +9 2,106 2,147 -2 +5
Total Consumer Digital Imaging Group 1,730 1,595 +8 +4 4,631 4,711 -2 +2
Film Products Group
Inside the U.S. 93 155 -40 0 458 657 -30 0
Outside the U.S. 370 404 -8 +5 1,510 1,655 -9 +4
Total Film Products Group 463 559 -17 +4 1,968 2,312 -15 +3
Graphic Communications Group
Inside the U.S. 303 307 -1 0 1,190 1,248 -5 0
Outside the U.S. 695 626 +11 +9 2,400 2,229 +8 +6
Total Graphic Communications Group 998 933 +7 +6 3,590 3,477 +3 +4
All Other
Inside the U.S. 22 13 +69 0 81 50 +62 0
Outside the U.S. 7 6 +17 0 31 18 +72 0
Total All Other 29 19 +53 0 112 68 +65 0
Consolidated
Inside the U.S. 1,445 1,470 -2 0 4,254 4,519 -6 0
Outside the U.S. 1,775 1,636 +8 +8 6,047 6,049 -0 +5
Consolidated Total $ 3,220 $ 3,106 4% +4% $ 10,301 $ 10,568 -3% +3%
* Represents the percentage point change in segment net sales for the period
that is attributable to foreign currency fluctuations
21. Page 21
Earnings (Loss) from Continuing Operations Before Interest, Other Income (Charges), Net and Income Taxes -
Unaudited
Three Months Ended Twelve Months Ended
(in millions) December 31, December 31,
2007 2006 Change 2007 2006 Change
Consumer Digital Imaging Group $ 76 $ 63 21% $ (92) $ (240) -62%
Film Products Group 40 83 -52 369 368 +0
Graphic Communications Group 33 47 -30 116 100 +16
All Other (19) (10) -90 (50) (67) +25
Total of segments 130 183 -29 343 161 +113
Restructuring costs and other (68) (77) (662) (698)
Other operating income (expenses), net 63 22 96 59
Legal reserve/settlement - 6 - 2
Foreign contingencies 5 - (7) -
Interest expense (29) (37) (113) (172)
Other income (charges), net 8 14 87 65
Consolidated earnings (loss) from
continuing operations before income
taxes $ 109 $ 111 -2% $ (256) $ (583) +56%