SlideShare una empresa de Scribd logo
1 de 4
Descargar para leer sin conexión
Consolidated Statements of Income
                           For the years ended December 31 (in thousands, except per share amounts)                                                                                                                                                                                                                                                                2000             1999           1998

                           REVENUES
                                Casino . . . . . . . . . . . . . . . . . . . .         .   .   .   .   .   .   .   .   .   .   .   .   .   .   .   .   .   .   .   .   .   .   .   .   .   .   .   .   .   .   .   .   .   .   .   .   .   .   .   .......         .   .   .   .   .   .   .   .   .   .   .   .   .   .   .   .   .   .   .   .   .   .
                                                                                                                                                                                                                       . $ 1,913,733                                                                                                                                        $     873,781    $   410,605
                                Rooms . . . . . . . . . . . . . . . . . . . .          .   .   .   .   .   .   .   .   .   .   .   .   .   .   .   .   .   .   .   .   .   .   .   .   .   .   .   .   .   .   .   .   .   .   .   .   .   .   .   .......         .   .   .   .   .   .   .   .   .   .   .   .   .   .   .   .   .   .   .   .   .   .
                                                                                                                                                                                                                       .     620,626                                                                                                                                              266,490        181,912
                                Food and beverage . . . . . . . . . . . .              .   .   .   .   .   .   .   .   .   .   .   .   .   .   .   .   .   .   .   .   .   .   .   .   .   .   .   .   .   .   .   .   .   .   .   .   .   .   .   .......         .   .   .   .   .   .   .   .   .   .   .   .   .   .   .   .   .   .   .   .   .   .
                                                                                                                                                                                                                       .     490,981                                                                                                                                              161,856        106,961
                                Entertainment, retail and other . . . .                .   .   .   .   .   .   .   .   .   .   .   .   .   .   .   .   .   .   .   .   .   .   .   .   .   .   .   .   .   .   .   .   .   .   .   .   .   .   .   .......         .   .   .   .   .   .   .   .   .   .   .   .   .   .   .   .   .   .   .   .   .   .
                                                                                                                                                                                                                       .     471,525                                                                                                                                              196,626        101,504
                                Income from unconsolidated affiliate                   .   .   .   .   .   .   .   .   .   .   .   .   .   .   .   .   .   .   .   .   .   .   .   .   .   .   .   .   .   .   .   .   .   .   .   .   .   .   .   .......         .   .   .   .   .   .   .   .   .   .   .   .   .   .   .   .   .   .   .   .   .   .
                                                                                                                                                                                                                       .      22,068                                                                                                                                                6,084         38,362
                                                                                                                                                                                                                           3,518,933                                                                                                                                            1,504,837        839,344
                                Less – promotional allowances . . . . . . . . . . . . . . . . . . . . . . . . . . . . . . . . . . . . . . . . . . . . . . . . . . . . . . . . . . . . . . . . . . . . . . . . .              286,343                                                                                                                                              112,606         66,218
                                                                                                                                                                                                                           3,232,590                                                                                                                                            1,392,231        773,126
                           EXPENSES
                                Casino . . . . . . . . . . . . . . . . . . . . . . . . . . . . . . . . . . . . . . . . . . . . . . . . . . . . . . . . . . . . . . . . . . . . . . . . . . . . . . . . . . . . . . . . .     933,621                                                                                                                                              434,241        223,238
                                Rooms . . . . . . . . . . . . . . . . . . . . . . . . . . . . . . . . . . . . . . . . . . . . . . . . . . . . . . . . . . . . . . . . . . . . . . . . . . . . . . . . . . . . . . . . .      188,080                                                                                                                                               84,135         61,165
                                Food and beverage . . . . . . . . . . . . . . . . . . . . . . . . . . . . . . . . . . . . . . . . . . . . . . . . . . . . . . . . . . . . . . . . . . . . . . . . . . . . . . . . .          293,380                                                                                                                                              102,102         67,084
                                Entertainment, retail and other . . . . . . . . . . . . . . . . . . . . . . . . . . . . . . . . . . . . . . . . . . . . . . . . . . . . . . . . . . . . . . . . . . . . . . . . .            291,711                                                                                                                                              112,046         66,772
                                Provision for doubtful accounts and discounts . . . . . . . . . . . . . . . . . . . . . . . . . . . . . . . . . . . . . . . . . . . . . . . . . . . . . . . . . . . . . .                    106,938                                                                                                                                               47,114         40,463
                                General and administrative . . . . . . . . . . . . . . . . . . . . . . . . . . . . . . . . . . . . . . . . . . . . . . . . . . . . . . . . . . . . . . . . . . . . . . . . . . . .           422,655                                                                                                                                              190,934         96,287
                                Preopening expenses and other . . . . . . . . . . . . . . . . . . . . . . . . . . . . . . . . . . . . . . . . . . . . . . . . . . . . . . . . . . . . . . . . . . . . . . . .                  5,624                                                                                                                                               71,496             —
                                Restructuring costs . . . . . . . . . . . . . . . . . . . . . . . . . . . . . . . . . . . . . . . . . . . . . . . . . . . . . . . . . . . . . . . . . . . . . . . . . . . . . . . . .         23,520                                                                                                                                                   —              —
                                Write-downs and impairments . . . . . . . . . . . . . . . . . . . . . . . . . . . . . . . . . . . . . . . . . . . . . . . . . . . . . . . . . . . . . . . . . . . . . . . . .                102,225                                                                                                                                                   —              —
                                Depreciation and amortization . . . . . . . . . . . . . . . . . . . . . . . . . . . . . . . . . . . . . . . . . . . . . . . . . . . . . . . . . . . . . . . . . . . . . . . . .              293,181                                                                                                                                              126,610         76,282
                                                                                                                                                                                                                           2,660,935                                                                                                                                            1,168,678        631,291
                           OPERATING PROFIT . . . . . . . . . . . . . . . . . . . . . . . . . . . . . . . . . . . . . . . . . . . . . . . . . . . . . . . . . . . . . . . . . . . . . . . . . . . . . . . . . . .                                                                                                                                               571,655          223,553         141,835

                           CORPORATE EXPENSE . . . . . . . . . . . . . . . . . . . . . . . . . . . . . . . . . . . . . . . . . . . . . . . . . . . . . . . . . . . . . . . . . . . . . . . . . . . . . . . . .                                                                                                                                                   33,939           13,685          10,261
                           OPERATING INCOME . . . . . . . . . . . . . . . . . . . . . . . . . . . . . . . . . . . . . . . . . . . . . . . . . . . . . . . . . . . . . . . . . . . . . . . . . . . . . . . . . .                                                                                                                                                 537,716          209,868         131,574
                           NON-OPERATING INCOME (EXPENSE)
                                Interest income . . . . . . . . . . . . . . . . . . . . . .                        .   .   .   .   .   .   .   .   .   .   .   .   .   .   .   .   .   .   .   .   .   .   .   .   .   .   .   .   .   .   .   ..........                  .   .   .   .   .   .   .   .   .   .   .   .   .   .   .   .   .   .   .   .   .      12,964            2,142         12,997
                                Interest expense, net . . . . . . . . . . . . . . . . . .                          .   .   .   .   .   .   .   .   .   .   .   .   .   .   .   .   .   .   .   .   .   .   .   .   .   .   .   .   .   .   .   ..........                  .   .   .   .   .   .   .   .   .   .   .   .   .   .   .   .   .   .   .   .   .    (272,856)         (59,853)       (24,613)
                                Interest expense from unconsolidated affiliate                                     .   .   .   .   .   .   .   .   .   .   .   .   .   .   .   .   .   .   .   .   .   .   .   .   .   .   .   .   .   .   .   ..........                  .   .   .   .   .   .   .   .   .   .   .   .   .   .   .   .   .   .   .   .   .      (2,043)          (1,058)        (8,376)
                                Other, net . . . . . . . . . . . . . . . . . . . . . . . . . .                     .   .   .   .   .   .   .   .   .   .   .   .   .   .   .   .   .   .   .   .   .   .   .   .   .   .   .   .   .   .   .   ..........                  .   .   .   .   .   .   .   .   .   .   .   .   .   .   .   .   .   .   .   .   .        (741)            (946)        (2,054)
                                                                                                                                                                                                                                                                                                                                                                (262,676)         (59,715)       (22,046)

                           Income before income taxes, extraordinary item and cumulative effect of change in accounting principle . . . . . . . . . . . . . . . . . . . . . . . . .                                                                                                                                                                              275,040         150,153         109,528
                                  Provision for income taxes . . . . . . . . . . . . . . . . . . . . . . . . . . . . . . . . . . . . . . . . . . . . . . . . . . . . . . . . . . . . . . . . . . . . . . . . . . . .                                                                                                                                            (108,880)        (55,029)        (40,580)
                           Income before extraordinary item and cumulative effect of change in accounting principle                                                                                                            ...................................                                                                                              166,160           95,124          68,948
                           EXTRAORDINARY ITEM
                                Loss on early retirements of debt, net of income tax benefits of $2,983 and $484 . . . . . . . . . . . . . . . . . . . . . . . . . . . . . . . . . . .                                                                                                                                                                            (5,416)           (898)             —
                           CUMULATIVE EFFECT OF CHANGE IN ACCOUNTING PRINCIPLE
                                Preopening costs, net of income tax benefit of $4,399 . . . . . . . . . . . . . . . . . . . . . . . . . . . . . . . . . . . . . . . . . . . . . . . . . . . . . . . .                                                                                                                                                                —            (8,168)             —
                           NET INCOME . . . . . . . . . . . . . . . . . . . . . . . . . . . . . . . . . . . . . . . . . . . . . . . . . . . . . . . . . . . . . . . . . . . . . . . . . . . . . . . . . . . . . . . . . $                                                                                                                                       160,744     $     86,058     $    68,948
                           BASIC INCOME PER SHARE OF COMMON STOCK
                                Income before extraordinary item and cumulative effect of change in accounting principle                                                                                                                           .   .   .   .................                                       .   .   .   .   .   .   .   .   .   .$       1.15    $        0.82    $      0.62
                                Extraordinary item – loss on early retirements of debt, net . . . . . . . . . . . . . . . . . . . . . . .                                                                                                          .   .   .   .................                                       .   .   .   .   .   .   .   .   .   .       (0.04)           (0.01)            —
                                Cumulative effect of change in accounting principle – preopening costs, net . . . . . . . . . .                                                                                                                    .   .   .   .................                                       .   .   .   .   .   .   .   .   .   .          —             (0.07)            —
                                Net income per share . . . . . . . . . . . . . . . . . . . . . . . . . . . . . . . . . . . . . . . . . . . . . . . . .                                                                                             .   .   .   .................                                       .   .   .   .   .   .   .   .   .   .$       1.11    $        0.74    $      0.62
                           DILUTED INCOME PER SHARE OF COMMON STOCK
                                Income before extraordinary item and cumulative effect of change in accounting principle                                                                                                                           .   .   .   .................                                       .   .   .   .   .   .   .   .   .   .$       1.13    $        0.80    $      0.61
                                Extraordinary item – loss on early retirements of debt, net . . . . . . . . . . . . . . . . . . . . . . .                                                                                                          .   .   .   .................                                       .   .   .   .   .   .   .   .   .   .       (0.04)           (0.01)            —
                                Cumulative effect of change in accounting principle – preopening costs, net . . . . . . . . . .                                                                                                                    .   .   .   .................                                       .   .   .   .   .   .   .   .   .   .          —             (0.07)            —
                                Net income per share . . . . . . . . . . . . . . . . . . . . . . . . . . . . . . . . . . . . . . . . . . . . . . . . .                                                                                             .   .   .   .................                                       .   .   .   .   .   .   .   .   .   .$       1.09    $        0.72    $      0.61
                           The accompanying notes are an integral part of these consolidated financial statements.


5 M32   MGM MIRAGE and subsidiaries
Consolidated Balance Sheets
As of December 31 (in thousands, except share amounts)                                                                                                                                                                                                                                                                                                                                                                              2000             1999

ASSETS

CURRENT ASSETS
   Cash and cash equivalents               .   .   .   .   .   .   .   .   .   .   .   .   .   .   .   .   .   .   .   .   .   .   .   .   .   .   .   .   .   .   .   .   .   .   .   .   .   .   .   .   .   .   .   .   .   .......                     .   .   .   .   .   .   .   .   .   .   .   .   .   .   .   .   .   .   .   .   .   .   .   .   .   .   .   .   .   .   .   .   .   .   .   .   .   .   .   .   $      227,968    $    121,522
   Accounts receivable, net . .            .   .   .   .   .   .   .   .   .   .   .   .   .   .   .   .   .   .   .   .   .   .   .   .   .   .   .   .   .   .   .   .   .   .   .   .   .   .   .   .   .   .   .   .   .   .......                     .   .   .   .   .   .   .   .   .   .   .   .   .   .   .   .   .   .   .   .   .   .   .   .   .   .   .   .   .   .   .   .   .   .   .   .   .   .   .   .          236,650          83,101
   Inventories . . . . . . . . . . . .     .   .   .   .   .   .   .   .   .   .   .   .   .   .   .   .   .   .   .   .   .   .   .   .   .   .   .   .   .   .   .   .   .   .   .   .   .   .   .   .   .   .   .   .   .   .......                     .   .   .   .   .   .   .   .   .   .   .   .   .   .   .   .   .   .   .   .   .   .   .   .   .   .   .   .   .   .   .   .   .   .   .   .   .   .   .   .           86,279          15,240
   Income tax receivable . . . .           .   .   .   .   .   .   .   .   .   .   .   .   .   .   .   .   .   .   .   .   .   .   .   .   .   .   .   .   .   .   .   .   .   .   .   .   .   .   .   .   .   .   .   .   .   .......                     .   .   .   .   .   .   .   .   .   .   .   .   .   .   .   .   .   .   .   .   .   .   .   .   .   .   .   .   .   .   .   .   .   .   .   .   .   .   .   .           11,264              —
   Deferred income taxes . . . .           .   .   .   .   .   .   .   .   .   .   .   .   .   .   .   .   .   .   .   .   .   .   .   .   .   .   .   .   .   .   .   .   .   .   .   .   .   .   .   .   .   .   .   .   .   .......                     .   .   .   .   .   .   .   .   .   .   .   .   .   .   .   .   .   .   .   .   .   .   .   .   .   .   .   .   .   .   .   .   .   .   .   .   .   .   .   .          162,934          17,452
   Prepaid expenses and other              .   .   .   .   .   .   .   .   .   .   .   .   .   .   .   .   .   .   .   .   .   .   .   .   .   .   .   .   .   .   .   .   .   .   .   .   .   .   .   .   .   .   .   .   .   .......                     .   .   .   .   .   .   .   .   .   .   .   .   .   .   .   .   .   .   .   .   .   .   .   .   .   .   .   .   .   .   .   .   .   .   .   .   .   .   .   .           70,549          32,598
        Total current assets . .           .   .   .   .   .   .   .   .   .   .   .   .   .   .   .   .   .   .   .   .   .   .   .   .   .   .   .   .   .   .   .   .   .   .   .   .   .   .   .   .   .   .   .   .   .   .......                     .   .   .   .   .   .   .   .   .   .   .   .   .   .   .   .   .   .   .   .   .   .   .   .   .   .   .   .   .   .   .   .   .   .   .   .   .   .   .   .          795,644         269,913

PROPERTY AND EQUIPMENT, NET . . . . . . . . . . . . . . . . . . . . . . . . . . . . . . . . . . . . . . . . . . . . . . . . . . . . . . . . . . . . . . . . . . . . . . . . . . . . . . . . . . . . .                                                                                                                                                                                                                           9,064,233        2,384,772
OTHER ASSETS
   Investment in unconsolidated affiliates . . . . . . . . . . . . . . . . . . . . . . . . . .                                                                                     .   .   .   .   .   .   .   .   .   .   .   .   .   .   .   ............                                    .   .   .   .   .   .   .   .   .   .   .   .   .   .   .   .   .   .   .   .   .   .   .   .   .   .   .   .   .   .   .          522,422           12,485
   Excess of purchase price over fair market value of net assets acquired, net                                                                                                     .   .   .   .   .   .   .   .   .   .   .   .   .   .   .   ............                                    .   .   .   .   .   .   .   .   .   .   .   .   .   .   .   .   .   .   .   .   .   .   .   .   .   .   .   .   .   .   .           54,281           31,683
   Deposits and other assets, net . . . . . . . . . . . . . . . . . . . . . . . . . . . . . . . .                                                                                  .   .   .   .   .   .   .   .   .   .   .   .   .   .   .   ............                                    .   .   .   .   .   .   .   .   .   .   .   .   .   .   .   .   .   .   .   .   .   .   .   .   .   .   .   .   .   .   .          298,021           44,601
        Total other assets . . . . . . . . . . . . . . . . . . . . . . . . . . . . . . . . . . . . . .                                                                             .   .   .   .   .   .   .   .   .   .   .   .   .   .   .   ............                                    .   .   .   .   .   .   .   .   .   .   .   .   .   .   .   .   .   .   .   .   .   .   .   .   .   .   .   .   .   .   .          874,724           88,769
                                                                                                                                                                                                                                                                                                                                                                                                                           $   10,734,601    $   2,743,454
LIABILITIES AND STOCKHOLDERS’ EQUITY
CURRENT LIABILITIES
   Accounts payable . . . . . . . . . . . . .                      .   .   .   .   .   .   .   .   .   .   .   .   .   .   .   .   .   .   .   .   .   .   .   .   .   .   .   .   .   .   .   .   .   .   .   .   .   .   .   .   .   ......                  .   .   .   .   .   .   .   .   .   .   .   .   .   .   .   .   .   .   .   .   .   .   .   .   .   .   .   .   .   .   .   .   .   .   .   .   .   .   .   $       65,317    $     45,914
   Income taxes payable . . . . . . . . . .                        .   .   .   .   .   .   .   .   .   .   .   .   .   .   .   .   .   .   .   .   .   .   .   .   .   .   .   .   .   .   .   .   .   .   .   .   .   .   .   .   .   ......                  .   .   .   .   .   .   .   .   .   .   .   .   .   .   .   .   .   .   .   .   .   .   .   .   .   .   .   .   .   .   .   .   .   .   .   .   .   .   .               —            3,296
   Dividend payable . . . . . . . . . . . . .                      .   .   .   .   .   .   .   .   .   .   .   .   .   .   .   .   .   .   .   .   .   .   .   .   .   .   .   .   .   .   .   .   .   .   .   .   .   .   .   .   .   ......                  .   .   .   .   .   .   .   .   .   .   .   .   .   .   .   .   .   .   .   .   .   .   .   .   .   .   .   .   .   .   .   .   .   .   .   .   .   .   .               —           11,388
   Current obligation, capital leases . .                          .   .   .   .   .   .   .   .   .   .   .   .   .   .   .   .   .   .   .   .   .   .   .   .   .   .   .   .   .   .   .   .   .   .   .   .   .   .   .   .   .   ......                  .   .   .   .   .   .   .   .   .   .   .   .   .   .   .   .   .   .   .   .   .   .   .   .   .   .   .   .   .   .   .   .   .   .   .   .   .   .   .            4,099           5,145
   Current portion of long-term debt . .                           .   .   .   .   .   .   .   .   .   .   .   .   .   .   .   .   .   .   .   .   .   .   .   .   .   .   .   .   .   .   .   .   .   .   .   .   .   .   .   .   .   ......                  .   .   .   .   .   .   .   .   .   .   .   .   .   .   .   .   .   .   .   .   .   .   .   .   .   .   .   .   .   .   .   .   .   .   .   .   .   .   .          521,308           7,852
   Accrued interest on long-term debt                              .   .   .   .   .   .   .   .   .   .   .   .   .   .   .   .   .   .   .   .   .   .   .   .   .   .   .   .   .   .   .   .   .   .   .   .   .   .   .   .   .   ......                  .   .   .   .   .   .   .   .   .   .   .   .   .   .   .   .   .   .   .   .   .   .   .   .   .   .   .   .   .   .   .   .   .   .   .   .   .   .   .           77,738          18,915
   Other accrued liabilities . . . . . . . . .                     .   .   .   .   .   .   .   .   .   .   .   .   .   .   .   .   .   .   .   .   .   .   .   .   .   .   .   .   .   .   .   .   .   .   .   .   .   .   .   .   .   ......                  .   .   .   .   .   .   .   .   .   .   .   .   .   .   .   .   .   .   .   .   .   .   .   .   .   .   .   .   .   .   .   .   .   .   .   .   .   .   .          564,743         197,580
        Total current liabilities . . . . . .                      .   .   .   .   .   .   .   .   .   .   .   .   .   .   .   .   .   .   .   .   .   .   .   .   .   .   .   .   .   .   .   .   .   .   .   .   .   .   .   .   .   ......                  .   .   .   .   .   .   .   .   .   .   .   .   .   .   .   .   .   .   .   .   .   .   .   .   .   .   .   .   .   .   .   .   .   .   .   .   .   .   .        1,233,205         290,090

DEFERRED INCOME TAXES . . . . . . . .                                          ........                        .   .   .   .   .   .   .   .   .   .   .   .   .   .   .   .   .   .   .   .   .   .   .   .   .   .   .   .   .   .   .   .   .   .   .   .   .   .   ..........................                                                                              .   .   .   .   .   .   .   .   .   .   .        1,730,158          108,713
LONG-TERM OBLIGATIONS, CAPITAL                                                 LEASES                          .   .   .   .   .   .   .   .   .   .   .   .   .   .   .   .   .   .   .   .   .   .   .   .   .   .   .   .   .   .   .   .   .   .   .   .   .   .   ..........................                                                                              .   .   .   .   .   .   .   .   .   .   .            7,092           12,864
LONG-TERM DEBT . . . . . . . . . . . . . . . .                                 ........                        .   .   .   .   .   .   .   .   .   .   .   .   .   .   .   .   .   .   .   .   .   .   .   .   .   .   .   .   .   .   .   .   .   .   .   .   .   .   ..........................                                                                              .   .   .   .   .   .   .   .   .   .   .        5,348,320        1,304,345
OTHER LONG-TERM OBLIGATIONS . .                                                ........                        .   .   .   .   .   .   .   .   .   .   .   .   .   .   .   .   .   .   .   .   .   .   .   .   .   .   .   .   .   .   .   .   .   .   .   .   .   .   ..........................                                                                              .   .   .   .   .   .   .   .   .   .   .           33,381            4,241

COMMITMENTS AND CONTINGENCIES

STOCKHOLDERS’ EQUITY
   Common stock, $.01 par value: authorized 300,000,000 shares,
    issued 163,189,205 and 138,445,048 shares; outstanding
    159,130,205 and 113,879,848 shares . . . . . . . . . . . . . . . . . .                                                                             .   .   .   .   .   .   .   .   .   .   .   .   .   .   .   .   .   .   .   .   ............                                    .   .   .   .   .   .   .   .   .   .   .   .   .   .   .   .   .   .   .   .   .   .   .   .   .   .   .   .   .   .   .   .   .            1,632             1,384
   Capital in excess of par value . . . . . . . . . . . . . . . . . . . . . . . . . .                                                                  .   .   .   .   .   .   .   .   .   .   .   .   .   .   .   .   .   .   .   .   ............                                    .   .   .   .   .   .   .   .   .   .   .   .   .   .   .   .   .   .   .   .   .   .   .   .   .   .   .   .   .   .   .   .   .        2,041,820        1,261,625
   Treasury stock, at cost (4,059,000 and 24,565,200 shares) . . . .                                                                                   .   .   .   .   .   .   .   .   .   .   .   .   .   .   .   .   .   .   .   .   ............                                    .   .   .   .   .   .   .   .   .   .   .   .   .   .   .   .   .   .   .   .   .   .   .   .   .   .   .   .   .   .   .   .   .          (83,683)        (505,824)
   Retained earnings . . . . . . . . . . . . . . . . . . . . . . . . . . . . . . . . . .                                                               .   .   .   .   .   .   .   .   .   .   .   .   .   .   .   .   .   .   .   .   ............                                    .   .   .   .   .   .   .   .   .   .   .   .   .   .   .   .   .   .   .   .   .   .   .   .   .   .   .   .   .   .   .   .   .          427,956          267,165
   Other comprehensive loss . . . . . . . . . . . . . . . . . . . . . . . . . . . .                                                                    .   .   .   .   .   .   .   .   .   .   .   .   .   .   .   .   .   .   .   .   ............                                    .   .   .   .   .   .   .   .   .   .   .   .   .   .   .   .   .   .   .   .   .   .   .   .   .   .   .   .   .   .   .   .   .           (5,280)           (1,149)
        Total stockholders’ equity . . . . . . . . . . . . . . . . . . . . . . . . .                                                                   .   .   .   .   .   .   .   .   .   .   .   .   .   .   .   .   .   .   .   .   ............                                    .   .   .   .   .   .   .   .   .   .   .   .   .   .   .   .   .   .   .   .   .   .   .   .   .   .   .   .   .   .   .   .   .        2,382,445        1,023,201
                                                                                                                                                                                                                                                                                                                                                                                                                           $   10,734,601    $   2,743,454

The accompanying notes are an integral part of these consolidated financial statements.


                                                                                                                                                                                                                                                                                                                                                                                                                                                     MGM MIRAGE and subsidiaries   M335
Consolidated Statements of Cash Flows
                           For the years ended December 31 (in thousands)                                                                                                                                                                                                                                                          2000            1999            1998

                           CASH FLOWS FROM OPERATING ACTIVITIES
                                Net income . . . . . . . . . . . . . . . . . . . . . . . . . . . . . . . . . . . . . . . . . . . . . . . . . . .                                                      .................................... $                                                                                    160,744     $    86,058     $    68,948
                                Adjustments to reconcile net income to net cash provided by operating activities:
                                  Depreciation and amortization . . . . . . . . . . . . . . . . . . . . . . . . . . . . . . . . . . .                                                                 .   .   .   .   .   .   .   .   .   .   .........   .   .   .   .   .   .   .   .   .   .   .   .   .   .   .   .   .     293,181         126,610           76,282
                                  Amortization of debt discount and issuance costs . . . . . . . . . . . . . . . . . . . . . .                                                                        .   .   .   .   .   .   .   .   .   .   .........   .   .   .   .   .   .   .   .   .   .   .   .   .   .   .   .   .      31,257           1,958            1,849
                                  Provision for doubtful accounts and discounts . . . . . . . . . . . . . . . . . . . . . . . .                                                                       .   .   .   .   .   .   .   .   .   .   .........   .   .   .   .   .   .   .   .   .   .   .   .   .   .   .   .   .     106,938          47,114           40,463
                                  Loss on early retirements of debt . . . . . . . . . . . . . . . . . . . . . . . . . . . . . . . . .                                                                 .   .   .   .   .   .   .   .   .   .   .........   .   .   .   .   .   .   .   .   .   .   .   .   .   .   .   .   .       8,399           1,382               —
                                  Cumulative effect of change in accounting principle . . . . . . . . . . . . . . . . . . . .                                                                         .   .   .   .   .   .   .   .   .   .   .........   .   .   .   .   .   .   .   .   .   .   .   .   .   .   .   .   .          -—          12,567               —
                                  Restructuring costs . . . . . . . . . . . . . . . . . . . . . . . . . . . . . . . . . . . . . . . . . . .                                                           .   .   .   .   .   .   .   .   .   .   .........   .   .   .   .   .   .   .   .   .   .   .   .   .   .   .   .   .      23,520              —                —
                                  Write-downs and impairments . . . . . . . . . . . . . . . . . . . . . . . . . . . . . . . . . . . .                                                                 .   .   .   .   .   .   .   .   .   .   .........   .   .   .   .   .   .   .   .   .   .   .   .   .   .   .   .   .     102,225              —                —
                                  Income from unconsolidated affiliate . . . . . . . . . . . . . . . . . . . . . . . . . . . . . . .                                                                  .   .   .   .   .   .   .   .   .   .   .........   .   .   .   .   .   .   .   .   .   .   .   .   .   .   .   .   .     (20,025)         (5,026)         (29,986)
                                  Distributions from unconsolidated affiliate . . . . . . . . . . . . . . . . . . . . . . . . . . .                                                                   .   .   .   .   .   .   .   .   .   .   .........   .   .   .   .   .   .   .   .   .   .   .   .   .   .   .   .   .      24,000              —             4,120
                                  Deferred income taxes . . . . . . . . . . . . . . . . . . . . . . . . . . . . . . . . . . . . . . . . .                                                             .   .   .   .   .   .   .   .   .   .   .........   .   .   .   .   .   .   .   .   .   .   .   .   .   .   .   .   .      35,595          27,489           14,530
                                Changes in assets and liabilities:
                                  Accounts receivable . . . . . . . . . . . . . . . . . . . . . . . . . . . . . . . . . . . . . . . . . . .                                                           .   .   .   .   .   .   .   .   ............            .   .   .   .   .   .   .   .   .   .   .   .   .   .   .   .    (122,203)        (41,401)        (30,594)
                                  Inventories . . . . . . . . . . . . . . . . . . . . . . . . . . . . . . . . . . . . . . . . . . . . . . . . .                                                       .   .   .   .   .   .   .   .   ............            .   .   .   .   .   .   .   .   .   .   .   .   .   .   .   .       4,293          (4,067)          4,314
                                  Income taxes receivable and payable . . . . . . . . . . . . . . . . . . . . . . . . . . . . . .                                                                     .   .   .   .   .   .   .   .   ............            .   .   .   .   .   .   .   .   .   .   .   .   .   .   .   .      71,754          (5,966)          2,457
                                  Prepaid expenses . . . . . . . . . . . . . . . . . . . . . . . . . . . . . . . . . . . . . . . . . . . .                                                            .   .   .   .   .   .   .   .   ............            .   .   .   .   .   .   .   .   .   .   .   .   .   .   .   .      (2,731)         (9,332)         (1,377)
                                  Accounts payable, accrued liabilities and other . . . . . . . . . . . . . . . . . . . . . . .                                                                       .   .   .   .   .   .   .   .   ............            .   .   .   .   .   .   .   .   .   .   .   .   .   .   .   .     100,611          52,491          20,674
                                        Net cash provided by operating activities . . . . . . . . . . . . . . . . . . . . . . . .                                                                     .   .   .   .   .   .   .   .   ............            .   .   .   .   .   .   .   .   .   .   .   .   .   .   .   .     817,558         289,877         171,680

                           CASH FLOWS FROM INVESTING ACTIVITIES
                                Purchases of property and equipment . . . . . . . . . . . . . . . . . . . .                                           .   .   .   .   .   .   .   .   .   .   .   .   .   .   .   .   .   ...............                     .   .   .   .   .   .   .   .   .   .   .   .   .   .   .   .     (336,499)       (375,260)       (361,942)
                                Acquisition of Primadonna Resorts, Inc., net of cash acquired . .                                                     .   .   .   .   .   .   .   .   .   .   .   .   .   .   .   .   .   ...............                     .   .   .   .   .   .   .   .   .   .   .   .   .   .   .   .           —          (13,346)             —
                                Acquisition of Mirage Resorts, Incorporated, net of cash acquired                                                     .   .   .   .   .   .   .   .   .   .   .   .   .   .   .   .   .   ...............                     .   .   .   .   .   .   .   .   .   .   .   .   .   .   .   .   (5,315,466)             —               —
                                Dispositions of property and equipment . . . . . . . . . . . . . . . . . . .                                          .   .   .   .   .   .   .   .   .   .   .   .   .   .   .   .   .   ...............                     .   .   .   .   .   .   .   .   .   .   .   .   .   .   .   .      150,172           6,487             599
                                Change in construction payable . . . . . . . . . . . . . . . . . . . . . . . .                                        .   .   .   .   .   .   .   .   .   .   .   .   .   .   .   .   .   ...............                     .   .   .   .   .   .   .   .   .   .   .   .   .   .   .   .      (14,361)         (9,507)        (15,973)
                                Other . . . . . . . . . . . . . . . . . . . . . . . . . . . . . . . . . . . . . . . . . . .                           .   .   .   .   .   .   .   .   .   .   .   .   .   .   .   .   .   ...............                     .   .   .   .   .   .   .   .   .   .   .   .   .   .   .   .      (40,538)          4,933         (18,168)
                                        Net cash used in other investing activities . . . . . . . . . . .                                             .   .   .   .   .   .   .   .   .   .   .   .   .   .   .   .   .   ...............                     .   .   .   .   .   .   .   .   .   .   .   .   .   .   .   .   (5,556,692)       (386,693)       (395,484)

                           CASH FLOWS FROM FINANCING ACTIVITIES
                                Borrowings under bank facilities . . . . . . . . . . . .              .   .   .   .   .   .   .   .   .   .   .   .   .   .   .   .   .   .   .   .   .   .   .   .   .   .   .   .   .   .   .   .............               .   .   .   .   .   .   .   .   .   .   .   .   .   .   .   .    4,354,000         963,000          31,000
                                Issuance of long-term debt . . . . . . . . . . . . . . . .            .   .   .   .   .   .   .   .   .   .   .   .   .   .   .   .   .   .   .   .   .   .   .   .   .   .   .   .   .   .   .   .............               .   .   .   .   .   .   .   .   .   .   .   .   .   .   .   .    1,547,052              —          491,183
                                Retirements of debt . . . . . . . . . . . . . . . . . . . . .         .   .   .   .   .   .   .   .   .   .   .   .   .   .   .   .   .   .   .   .   .   .   .   .   .   .   .   .   .   .   .   .............               .   .   .   .   .   .   .   .   .   .   .   .   .   .   .   .           —         (374,500)             —
                                Debt issuance costs . . . . . . . . . . . . . . . . . . . . .         .   .   .   .   .   .   .   .   .   .   .   .   .   .   .   .   .   .   .   .   .   .   .   .   .   .   .   .   .   .   .   .............               .   .   .   .   .   .   .   .   .   .   .   .   .   .   .   .      (75,099)             —           (1,432)
                                Repayments to banks and others . . . . . . . . . . .                  .   .   .   .   .   .   .   .   .   .   .   .   .   .   .   .   .   .   .   .   .   .   .   .   .   .   .   .   .   .   .   .............               .   .   .   .   .   .   .   .   .   .   .   .   .   .   .   .   (2,171,614)       (206,955)        (40,720)
                                Purchases of treasury stock . . . . . . . . . . . . . . .             .   .   .   .   .   .   .   .   .   .   .   .   .   .   .   .   .   .   .   .   .   .   .   .   .   .   .   .   .   .   .   .............               .   .   .   .   .   .   .   .   .   .   .   .   .   .   .   .      (52,579)       (295,235)       (210,589)
                                Sale of treasury stock . . . . . . . . . . . . . . . . . . . .        .   .   .   .   .   .   .   .   .   .   .   .   .   .   .   .   .   .   .   .   .   .   .   .   .   .   .   .   .   .   .   .............               .   .   .   .   .   .   .   .   .   .   .   .   .   .   .   .      474,720              —               —
                                Cash dividend paid . . . . . . . . . . . . . . . . . . . . .          .   .   .   .   .   .   .   .   .   .   .   .   .   .   .   .   .   .   .   .   .   .   .   .   .   .   .   .   .   .   .   .............               .   .   .   .   .   .   .   .   .   .   .   .   .   .   .   .      (11,341)             —               —
                                Issuance of common stock . . . . . . . . . . . . . . . .              .   .   .   .   .   .   .   .   .   .   .   .   .   .   .   .   .   .   .   .   .   .   .   .   .   .   .   .   .   .   .   .............               .   .   .   .   .   .   .   .   .   .   .   .   .   .   .   .      780,441          50,072           1,712
                                         Net cash provided by financing activities                    .   .   .   .   .   .   .   .   .   .   .   .   .   .   .   .   .   .   .   .   .   .   .   .   .   .   .   .   .   .   .   .............               .   .   .   .   .   .   .   .   .   .   .   .   .   .   .   .    4,845,580         136,382         271,154

                           CASH AND CASH EQUIVALENTS
                                Net increase for the year . . . . . . . . . . . . . . . . . . . . . . . . . . . . . . . . . . . . . . . . . . . . . . . . . . . . . . . . . . . . . . . . . . . . . . . . . . . . .                                                                                                             106,446          39,566          47,350
                                Balance, beginning of year . . . . . . . . . . . . . . . . . . . . . . . . . . . . . . . . . . . . . . . . . . . . . . . . . . . . . . . . . . . . . . . . . . . . . . . . . . . .                                                                                                              121,522          81,956          34,606
                                Balance, end of year . . . . . . . . . . . . . . . . . . . . . . . . . . . . . . . . . . . . . . . . . . . . . . . . . . . . . . . . . . . . . . . . . . . . . . . . . . . . . . . . $                                                                                                          227,968     $   121,522     $    81,956

                           SUPPLEMENTAL CASH FLOW DISCLOSURES
                                Interest paid, net of amounts capitalized . . . . . . . . . . . . . . . . . . . . . . . . . . . . . . . . . . . . . . . . . . . . . . . . . . . . . . . . . . . . . . . . . . $                                                                                                                 200,716     $    56,035     $    23,680
                                State and federal income taxes paid . . . . . . . . . . . . . . . . . . . . . . . . . . . . . . . . . . . . . . . . . . . . . . . . . . . . . . . . . . . . . . . . . . . . .                                                                                                                    30,537          26,068          15,900

                           The accompanying notes are an integral part of these consolidated financial statements.


5 M34   MGM MIRAGE and subsidiaries
Consolidated Statements of Stockholders’ Equity
For the years ended December 31, 2000, 1999 and 1998 (in thousands, except share amounts)

                                                                                                                                                                                              Other            Total
                                                                                                  Common Stock                    Capital in Excess       Treasury        Retained   Comprehensive     Stockholders’
                                                                                     Shares Outstanding        Par Value               of Par Value          Stock        Earnings    Income (Loss)          Equity

BALANCES, DECEMBER 31, 1997 . . . . . . . . . . . . . . . 115,969,746                                                 $   1,160     $     966,487     $         —     $   123,659    $      (2,398)    $   1,088,908

         Net income . . . . . . . . . . . . . . . . . . . . . . . . . . . . . . .                               —           —                   —               —          68,948               —            68,948
         Currency translation adjustment . . . . . . . . . . . . . . . .                                        —           —                   —               —              —              (748)            (748)
         Total comprehensive income . . . . . . . . . . . . . . . . . .                                         —           —                   —               —              —                —            68,200

     Issuance of common stock pursuant
       to stock option grants . . . . . . . . . . .          .   .   .   .   .   .   .   .   .   .   .      96,442            1             1,315               —              (1)               —             1,315
     Purchases of treasury stock . . . . . . . .             .   .   .   .   .   .   .   .   .   .   . (12,000,000)          —                 —          (210,589)            —                 —          (210,589)
     Tax benefit from stock option exercises                 .   .   .   .   .   .   .   .   .   .   .          —            —                397               —              —                 —               397
BALANCES, DECEMBER 31, 1998 . . . .                          .   .   .   .   .   .   .   .   .   .   . 104,066,188        1,161           968,199         (210,589)       192,606            (3,146)         948,231

         Net income . . . . . . . . . . . . . . . . . . . . . . . . . . . . . . .                               —           —                   —               —          86,058               —            86,058
         Currency translation adjustment . . . . . . . . . . . . . . . .                                        —           —                   —               —              —             1,997            1,997
         Total comprehensive income . . . . . . . . . . . . . . . . . .                                         —           —                   —               —              —                —            88,055

     Issuance of common stock pursuant
       to stock option grants . . . . . . . . . . . . . . . . . . . .                            .   .   3,358,254           33            43,096               —             (16)               —            43,113
     Issuance of common stock for Primadonna merger                                              .   . 19,020,606           190           243,371               —             (95)               —           243,466
     Purchases of treasury stock . . . . . . . . . . . . . . . . .                               .   . (12,565,200)          —                 —          (295,235)            —                 —          (295,235)
     Tax benefit from stock option exercises . . . . . . . .                                     .   .          —            —              6,959               —              —                 —             6,959
     Dividend payable . . . . . . . . . . . . . . . . . . . . . . . . .                          .   .          —            —                 —                —         (11,388)               —           (11,388)
BALANCES, DECEMBER 31, 1999 . . . . . . . . . . . . .                                            .   . 113,879,848        1,384         1,261,625         (505,824)       267,165            (1,149)       1,023,201

         Net income . . . . . . . . . . . . . . . . . . . . . . . . . . . . . . .                               —           —                   —               —         160,744               —           160,744
         Currency translation adjustment . . . . . . . . . . . . . . . .                                        —           —                   —               —              —            (4,131)          (4,131)
         Total comprehensive income . . . . . . . . . . . . . . . . . .                                         —           —                   —               —              —                —           156,613

     Issuance of common stock pursuant
       to stock option grants . . . . . . . . . . . . . . . . . .                        .   .   .   .   1,244,157           13            16,880              -—              —                 —            16,893
     Issuance of common stock in private placement                                       .   .   .   . 46,500,000           235           756,368         474,720              —                 —         1,231,323
     Purchases of treasury stock . . . . . . . . . . . . . . .                           .   .   .   . (2,493,800)           —                 —          (52,579)             —                 —           (52,579)
     Tax benefit from stock option exercises . . . . . . .                               .   .   .   .          —            —              6,947               —              —                 —             6,947
     Dividend payment adjustment . . . . . . . . . . . . .                               .   .   .   .          —            —                 —                —              47                —                47
BALANCES, DECEMBER 31, 2000 . . . . . . . . . . .                                        .   .   .   . 159,130,205    $   1,632     $   2,041,820     $   (83,683)    $   427,956    $       (5,280)   $   2,382,445

The accompanying notes are an integral part of these consolidated financial statements.


                                                                                                                                                                                                               MGM MIRAGE and subsidiaries   M355

Más contenido relacionado

La actualidad más candente

Modulo legislación laboral (1)
Modulo legislación laboral (1)Modulo legislación laboral (1)
Modulo legislación laboral (1)PaolAndreaLenis
 
Manual de Remuneraciones Contraloría General EUS Año 2015
Manual de Remuneraciones Contraloría General EUS Año 2015Manual de Remuneraciones Contraloría General EUS Año 2015
Manual de Remuneraciones Contraloría General EUS Año 2015Nelson Leiva®
 
Carta 2012 warren buffet
Carta 2012 warren buffetCarta 2012 warren buffet
Carta 2012 warren buffetgro77
 
Indice General Tesis Sistemas UPC
Indice General Tesis Sistemas UPCIndice General Tesis Sistemas UPC
Indice General Tesis Sistemas UPCJulio Pari
 
Manual del facilitador
Manual del facilitador Manual del facilitador
Manual del facilitador PonteenAlgo
 
Servidor de correo (postfix)
Servidor de  correo (postfix)Servidor de  correo (postfix)
Servidor de correo (postfix)jonathan17
 
Actividad economica en la sociedad
Actividad economica en la sociedadActividad economica en la sociedad
Actividad economica en la sociedadmariaelenachoquerive
 
23565249 estados-financieros-caso-practico
23565249 estados-financieros-caso-practico23565249 estados-financieros-caso-practico
23565249 estados-financieros-caso-practicomarco dia
 
Unidad 5. Energías renovables. Minicentrales hidroelectricas
Unidad 5. Energías renovables. Minicentrales hidroelectricasUnidad 5. Energías renovables. Minicentrales hidroelectricas
Unidad 5. Energías renovables. Minicentrales hidroelectricasmartuki85
 
Energía de la biomasa
Energía de la biomasaEnergía de la biomasa
Energía de la biomasaeHabilita
 
Modificación de Asfaltos para Mezclas Tibias
Modificación de Asfaltos para Mezclas TibiasModificación de Asfaltos para Mezclas Tibias
Modificación de Asfaltos para Mezclas TibiasEdinson Torres
 
Antecedentes Y Marco Teorico V2
Antecedentes Y Marco Teorico V2Antecedentes Y Marco Teorico V2
Antecedentes Y Marco Teorico V2Diego
 
Wa incop_docs_contratos_gestion servicios
 Wa incop_docs_contratos_gestion servicios Wa incop_docs_contratos_gestion servicios
Wa incop_docs_contratos_gestion serviciosmayken02
 

La actualidad más candente (20)

Espigones crucita memoria técnica
Espigones crucita memoria técnicaEspigones crucita memoria técnica
Espigones crucita memoria técnica
 
Tsumat proyecto final tc
Tsumat proyecto final  tcTsumat proyecto final  tc
Tsumat proyecto final tc
 
Enero
EneroEnero
Enero
 
Modulo legislación laboral (1)
Modulo legislación laboral (1)Modulo legislación laboral (1)
Modulo legislación laboral (1)
 
Manual De Poker Tracker V2
Manual De Poker Tracker V2Manual De Poker Tracker V2
Manual De Poker Tracker V2
 
Manual de Remuneraciones Contraloría General EUS Año 2015
Manual de Remuneraciones Contraloría General EUS Año 2015Manual de Remuneraciones Contraloría General EUS Año 2015
Manual de Remuneraciones Contraloría General EUS Año 2015
 
Carta 2012 warren buffet
Carta 2012 warren buffetCarta 2012 warren buffet
Carta 2012 warren buffet
 
Indice General Tesis Sistemas UPC
Indice General Tesis Sistemas UPCIndice General Tesis Sistemas UPC
Indice General Tesis Sistemas UPC
 
Manual del facilitador
Manual del facilitador Manual del facilitador
Manual del facilitador
 
Pliego de condiciones
Pliego de condicionesPliego de condiciones
Pliego de condiciones
 
Servidor de correo (postfix)
Servidor de  correo (postfix)Servidor de  correo (postfix)
Servidor de correo (postfix)
 
Actividad economica en la sociedad
Actividad economica en la sociedadActividad economica en la sociedad
Actividad economica en la sociedad
 
Actividades náuticas
Actividades náuticasActividades náuticas
Actividades náuticas
 
23565249 estados-financieros-caso-practico
23565249 estados-financieros-caso-practico23565249 estados-financieros-caso-practico
23565249 estados-financieros-caso-practico
 
Unidad 5. Energías renovables. Minicentrales hidroelectricas
Unidad 5. Energías renovables. Minicentrales hidroelectricasUnidad 5. Energías renovables. Minicentrales hidroelectricas
Unidad 5. Energías renovables. Minicentrales hidroelectricas
 
Energía de la biomasa
Energía de la biomasaEnergía de la biomasa
Energía de la biomasa
 
Cadenas Productivas
Cadenas ProductivasCadenas Productivas
Cadenas Productivas
 
Modificación de Asfaltos para Mezclas Tibias
Modificación de Asfaltos para Mezclas TibiasModificación de Asfaltos para Mezclas Tibias
Modificación de Asfaltos para Mezclas Tibias
 
Antecedentes Y Marco Teorico V2
Antecedentes Y Marco Teorico V2Antecedentes Y Marco Teorico V2
Antecedentes Y Marco Teorico V2
 
Wa incop_docs_contratos_gestion servicios
 Wa incop_docs_contratos_gestion servicios Wa incop_docs_contratos_gestion servicios
Wa incop_docs_contratos_gestion servicios
 

Destacado

MGMM FinNote02
MGMM  FinNote02MGMM  FinNote02
MGMM FinNote02finance29
 
Scientific software
Scientific softwareScientific software
Scientific softwareucsoft
 
Service Estate Community Pro Estate En Bas Energie
Service Estate Community   Pro Estate En Bas EnergieService Estate Community   Pro Estate En Bas Energie
Service Estate Community Pro Estate En Bas Energiejoerib
 
Anton Kast on Collaborative Filters at SXSW
Anton Kast on Collaborative Filters at SXSWAnton Kast on Collaborative Filters at SXSW
Anton Kast on Collaborative Filters at SXSWAnton Kast
 
Social Media Strategie
Social Media StrategieSocial Media Strategie
Social Media Strategiejoerib
 

Destacado (6)

MGMM FinNote02
MGMM  FinNote02MGMM  FinNote02
MGMM FinNote02
 
Scientific software
Scientific softwareScientific software
Scientific software
 
Service Estate Community Pro Estate En Bas Energie
Service Estate Community   Pro Estate En Bas EnergieService Estate Community   Pro Estate En Bas Energie
Service Estate Community Pro Estate En Bas Energie
 
Anton Kast on Collaborative Filters at SXSW
Anton Kast on Collaborative Filters at SXSWAnton Kast on Collaborative Filters at SXSW
Anton Kast on Collaborative Filters at SXSW
 
Social Media Strategie
Social Media StrategieSocial Media Strategie
Social Media Strategie
 
MGM Supp
MGM SuppMGM Supp
MGM Supp
 

Similar a MGMM FinState00 (20)

Pedro Espino Vargas, AUSTRAL
Pedro Espino Vargas, AUSTRALPedro Espino Vargas, AUSTRAL
Pedro Espino Vargas, AUSTRAL
 
Esq1 ellismasner
Esq1 ellismasnerEsq1 ellismasner
Esq1 ellismasner
 
Esq1 ellismasner
Esq1 ellismasnerEsq1 ellismasner
Esq1 ellismasner
 
Guia del triángulo de sierpinski
Guia del triángulo de sierpinskiGuia del triángulo de sierpinski
Guia del triángulo de sierpinski
 
Modelo gestion preventiva
Modelo gestion preventivaModelo gestion preventiva
Modelo gestion preventiva
 
Industria metalmecanica informe
Industria metalmecanica   informeIndustria metalmecanica   informe
Industria metalmecanica informe
 
กลอน13
กลอน13กลอน13
กลอน13
 
Tecnologia 6
Tecnologia 6Tecnologia 6
Tecnologia 6
 
Tema 11
Tema 11Tema 11
Tema 11
 
Presentation16
Presentation16Presentation16
Presentation16
 
Esquema Romanticismo
Esquema RomanticismoEsquema Romanticismo
Esquema Romanticismo
 
Tercer año
Tercer añoTercer año
Tercer año
 
Manual civilcad
Manual civilcadManual civilcad
Manual civilcad
 
Cuaderno de ejercicios mate 6
Cuaderno de ejercicios mate 6Cuaderno de ejercicios mate 6
Cuaderno de ejercicios mate 6
 
Mapeo
MapeoMapeo
Mapeo
 
CV
CVCV
CV
 
Segundo año
Segundo añoSegundo año
Segundo año
 
Servianes
ServianesServianes
Servianes
 
Comprensión lectora @cerebritosmed .pdf
Comprensión lectora @cerebritosmed .pdfComprensión lectora @cerebritosmed .pdf
Comprensión lectora @cerebritosmed .pdf
 
Tecnologia 3
Tecnologia 3Tecnologia 3
Tecnologia 3
 

Más de finance29

Chesapeake Latest_IR_Presentation
Chesapeake Latest_IR_PresentationChesapeake Latest_IR_Presentation
Chesapeake Latest_IR_Presentationfinance29
 
ChesapeakeEnergy07ARFINAL
ChesapeakeEnergy07ARFINALChesapeakeEnergy07ARFINAL
ChesapeakeEnergy07ARFINALfinance29
 
ChesapeakeEnergy07ARFINAL
ChesapeakeEnergy07ARFINALChesapeakeEnergy07ARFINAL
ChesapeakeEnergy07ARFINALfinance29
 
Chesapeake Latest_IR_Presentation
Chesapeake Latest_IR_PresentationChesapeake Latest_IR_Presentation
Chesapeake Latest_IR_Presentationfinance29
 
Chesapeake Latest_IR_Presentation
Chesapeake Latest_IR_PresentationChesapeake Latest_IR_Presentation
Chesapeake Latest_IR_Presentationfinance29
 
ChesapeakeEnergy07ARFINAL
ChesapeakeEnergy07ARFINALChesapeakeEnergy07ARFINAL
ChesapeakeEnergy07ARFINALfinance29
 
Chesapeake Energy07ARFINAL
Chesapeake Energy07ARFINALChesapeake Energy07ARFINAL
Chesapeake Energy07ARFINALfinance29
 
Chesapeake Latest_IR_Presentation
Chesapeake Latest_IR_PresentationChesapeake Latest_IR_Presentation
Chesapeake Latest_IR_Presentationfinance29
 
MGM MIRAGE MandalayHist
MGM MIRAGE  MandalayHistMGM MIRAGE  MandalayHist
MGM MIRAGE MandalayHistfinance29
 
MGM MIRAGE ProForma
MGM MIRAGE  ProFormaMGM MIRAGE  ProForma
MGM MIRAGE ProFormafinance29
 
MGM MIRAGE Actual
MGM MIRAGE  ActualMGM MIRAGE  Actual
MGM MIRAGE Actualfinance29
 
MGM 93005SuppDataMandalayHistorical
MGM 93005SuppDataMandalayHistoricalMGM 93005SuppDataMandalayHistorical
MGM 93005SuppDataMandalayHistoricalfinance29
 
MGMMIRAGE 93005SuppDataProForma
MGMMIRAGE 93005SuppDataProFormaMGMMIRAGE 93005SuppDataProForma
MGMMIRAGE 93005SuppDataProFormafinance29
 
MGMMIRAGE 93005SuppDataActual
MGMMIRAGE 93005SuppDataActualMGMMIRAGE 93005SuppDataActual
MGMMIRAGE 93005SuppDataActualfinance29
 
MGM MIRAGE Mandalayhist_022306
MGM MIRAGE  Mandalayhist_022306MGM MIRAGE  Mandalayhist_022306
MGM MIRAGE Mandalayhist_022306finance29
 
MGM MIRAGE SuppActual_022306
MGM MIRAGE  SuppActual_022306MGM MIRAGE  SuppActual_022306
MGM MIRAGE SuppActual_022306finance29
 
MGM MIRAGE SuppProForma_022306
MGM MIRAGE  SuppProForma_022306MGM MIRAGE  SuppProForma_022306
MGM MIRAGE SuppProForma_022306finance29
 
MGM Mandalay
MGM MandalayMGM Mandalay
MGM Mandalayfinance29
 
MGM ProForma
MGM ProFormaMGM ProForma
MGM ProFormafinance29
 
MGM MIRAGE SuppData05307
MGM MIRAGE  SuppData05307MGM MIRAGE  SuppData05307
MGM MIRAGE SuppData05307finance29
 

Más de finance29 (20)

Chesapeake Latest_IR_Presentation
Chesapeake Latest_IR_PresentationChesapeake Latest_IR_Presentation
Chesapeake Latest_IR_Presentation
 
ChesapeakeEnergy07ARFINAL
ChesapeakeEnergy07ARFINALChesapeakeEnergy07ARFINAL
ChesapeakeEnergy07ARFINAL
 
ChesapeakeEnergy07ARFINAL
ChesapeakeEnergy07ARFINALChesapeakeEnergy07ARFINAL
ChesapeakeEnergy07ARFINAL
 
Chesapeake Latest_IR_Presentation
Chesapeake Latest_IR_PresentationChesapeake Latest_IR_Presentation
Chesapeake Latest_IR_Presentation
 
Chesapeake Latest_IR_Presentation
Chesapeake Latest_IR_PresentationChesapeake Latest_IR_Presentation
Chesapeake Latest_IR_Presentation
 
ChesapeakeEnergy07ARFINAL
ChesapeakeEnergy07ARFINALChesapeakeEnergy07ARFINAL
ChesapeakeEnergy07ARFINAL
 
Chesapeake Energy07ARFINAL
Chesapeake Energy07ARFINALChesapeake Energy07ARFINAL
Chesapeake Energy07ARFINAL
 
Chesapeake Latest_IR_Presentation
Chesapeake Latest_IR_PresentationChesapeake Latest_IR_Presentation
Chesapeake Latest_IR_Presentation
 
MGM MIRAGE MandalayHist
MGM MIRAGE  MandalayHistMGM MIRAGE  MandalayHist
MGM MIRAGE MandalayHist
 
MGM MIRAGE ProForma
MGM MIRAGE  ProFormaMGM MIRAGE  ProForma
MGM MIRAGE ProForma
 
MGM MIRAGE Actual
MGM MIRAGE  ActualMGM MIRAGE  Actual
MGM MIRAGE Actual
 
MGM 93005SuppDataMandalayHistorical
MGM 93005SuppDataMandalayHistoricalMGM 93005SuppDataMandalayHistorical
MGM 93005SuppDataMandalayHistorical
 
MGMMIRAGE 93005SuppDataProForma
MGMMIRAGE 93005SuppDataProFormaMGMMIRAGE 93005SuppDataProForma
MGMMIRAGE 93005SuppDataProForma
 
MGMMIRAGE 93005SuppDataActual
MGMMIRAGE 93005SuppDataActualMGMMIRAGE 93005SuppDataActual
MGMMIRAGE 93005SuppDataActual
 
MGM MIRAGE Mandalayhist_022306
MGM MIRAGE  Mandalayhist_022306MGM MIRAGE  Mandalayhist_022306
MGM MIRAGE Mandalayhist_022306
 
MGM MIRAGE SuppActual_022306
MGM MIRAGE  SuppActual_022306MGM MIRAGE  SuppActual_022306
MGM MIRAGE SuppActual_022306
 
MGM MIRAGE SuppProForma_022306
MGM MIRAGE  SuppProForma_022306MGM MIRAGE  SuppProForma_022306
MGM MIRAGE SuppProForma_022306
 
MGM Mandalay
MGM MandalayMGM Mandalay
MGM Mandalay
 
MGM ProForma
MGM ProFormaMGM ProForma
MGM ProForma
 
MGM MIRAGE SuppData05307
MGM MIRAGE  SuppData05307MGM MIRAGE  SuppData05307
MGM MIRAGE SuppData05307
 

Último

Tarea APE Nro. 1 INFORME GRUPAL CONSULTA Y PRESENTACIÓN FINANZAS.pdf
Tarea APE Nro. 1 INFORME GRUPAL CONSULTA Y PRESENTACIÓN FINANZAS.pdfTarea APE Nro. 1 INFORME GRUPAL CONSULTA Y PRESENTACIÓN FINANZAS.pdf
Tarea APE Nro. 1 INFORME GRUPAL CONSULTA Y PRESENTACIÓN FINANZAS.pdfAnaPaulaSilvaViamagu
 
Tarea APE Nro. 1 INFORME GRUPAL CONSULTA.pptx
Tarea APE Nro. 1 INFORME GRUPAL CONSULTA.pptxTarea APE Nro. 1 INFORME GRUPAL CONSULTA.pptx
Tarea APE Nro. 1 INFORME GRUPAL CONSULTA.pptxdayannaarmijos4
 
Mercado de factores productivos - Unidad 9
Mercado de factores productivos - Unidad 9Mercado de factores productivos - Unidad 9
Mercado de factores productivos - Unidad 9NahuelEmilianoPeralt
 
ESCUELAS ECONÓMICAS Y SU INFLUENCIA EN CHILE
ESCUELAS ECONÓMICAS Y SU INFLUENCIA EN CHILEESCUELAS ECONÓMICAS Y SU INFLUENCIA EN CHILE
ESCUELAS ECONÓMICAS Y SU INFLUENCIA EN CHILEmerlone15rm
 
presentación de las finanzas y su Clasificación
presentación de las finanzas y su Clasificaciónpresentación de las finanzas y su Clasificación
presentación de las finanzas y su Clasificaciónoynstein
 
Contratos bancarios en Colombia y sus carcteristicas
Contratos bancarios en Colombia y sus carcteristicasContratos bancarios en Colombia y sus carcteristicas
Contratos bancarios en Colombia y sus carcteristicasssuser17dd85
 
El Arte De La Contabilidad Explorando La Contabilidad De Costos
El Arte De La Contabilidad Explorando La Contabilidad De CostosEl Arte De La Contabilidad Explorando La Contabilidad De Costos
El Arte De La Contabilidad Explorando La Contabilidad De Costosocantotete
 
La problemática de la morosidad para las Empresas
La problemática de la morosidad para las EmpresasLa problemática de la morosidad para las Empresas
La problemática de la morosidad para las Empresasjadornodatos1
 
Juan Armando Reyes Mendoza - El libro de la economía.pdf
Juan Armando Reyes Mendoza - El libro de la economía.pdfJuan Armando Reyes Mendoza - El libro de la economía.pdf
Juan Armando Reyes Mendoza - El libro de la economía.pdfCosmeJhonyRosalesVer
 
Presentación TG.pptx colegio Manuel José Arce
Presentación TG.pptx colegio Manuel José ArcePresentación TG.pptx colegio Manuel José Arce
Presentación TG.pptx colegio Manuel José ArceCristianSantos156342
 
ACTIVIDAD DE COMPRENSIÓN Y PRODUCCIÓN DE TEXTOS II
ACTIVIDAD DE COMPRENSIÓN Y PRODUCCIÓN DE TEXTOS IIACTIVIDAD DE COMPRENSIÓN Y PRODUCCIÓN DE TEXTOS II
ACTIVIDAD DE COMPRENSIÓN Y PRODUCCIÓN DE TEXTOS IIpamelasandridcorrear
 
Proyecto didáctico higiene en alumnos de preescolar
Proyecto didáctico higiene en alumnos de preescolarProyecto didáctico higiene en alumnos de preescolar
Proyecto didáctico higiene en alumnos de preescolargabrielacarmona718
 
Demanda y sus caracteristicas - Economia
Demanda y sus caracteristicas - EconomiaDemanda y sus caracteristicas - Economia
Demanda y sus caracteristicas - EconomiaJunior470421
 
Tarea APE Nro. 1 INFORME GRUPAL CONSULTA Y PRESENTACIÓN FINANZAS.docx (1).pdf
Tarea APE Nro. 1 INFORME GRUPAL CONSULTA Y PRESENTACIÓN FINANZAS.docx (1).pdfTarea APE Nro. 1 INFORME GRUPAL CONSULTA Y PRESENTACIÓN FINANZAS.docx (1).pdf
Tarea APE Nro. 1 INFORME GRUPAL CONSULTA Y PRESENTACIÓN FINANZAS.docx (1).pdfAnaPaulaSilvaViamagu
 
Presentación informe Impacto del sistema de financiación autonómica en la deu...
Presentación informe Impacto del sistema de financiación autonómica en la deu...Presentación informe Impacto del sistema de financiación autonómica en la deu...
Presentación informe Impacto del sistema de financiación autonómica en la deu...Ivie
 
TAREA_ INFOGRAFÍA DE LA REPÚBLICA ARISTOCRÁTICA.pdf
TAREA_ INFOGRAFÍA DE LA REPÚBLICA ARISTOCRÁTICA.pdfTAREA_ INFOGRAFÍA DE LA REPÚBLICA ARISTOCRÁTICA.pdf
TAREA_ INFOGRAFÍA DE LA REPÚBLICA ARISTOCRÁTICA.pdfGino153088
 
Brigham Issuu.pdf Finanzas coporotivas economia en ingenieria
Brigham Issuu.pdf Finanzas coporotivas economia en ingenieriaBrigham Issuu.pdf Finanzas coporotivas economia en ingenieria
Brigham Issuu.pdf Finanzas coporotivas economia en ingenieriaRobledoZigaCristianA
 
Contexto Internacional Y definición de RSE
Contexto Internacional Y definición de RSEContexto Internacional Y definición de RSE
Contexto Internacional Y definición de RSEJonathanCovena1
 
GENERALIDADES DE LAS FINANZAS Y CLASIFICACIÓN .pdf
GENERALIDADES DE LAS FINANZAS Y CLASIFICACIÓN .pdfGENERALIDADES DE LAS FINANZAS Y CLASIFICACIÓN .pdf
GENERALIDADES DE LAS FINANZAS Y CLASIFICACIÓN .pdfJordanaMaza
 
PROTOCOLO INDIVIDUAL COMPRENSIÓN DE TEXTOS II.docx
PROTOCOLO INDIVIDUAL COMPRENSIÓN DE TEXTOS II.docxPROTOCOLO INDIVIDUAL COMPRENSIÓN DE TEXTOS II.docx
PROTOCOLO INDIVIDUAL COMPRENSIÓN DE TEXTOS II.docxpamelasandridcorrear
 

Último (20)

Tarea APE Nro. 1 INFORME GRUPAL CONSULTA Y PRESENTACIÓN FINANZAS.pdf
Tarea APE Nro. 1 INFORME GRUPAL CONSULTA Y PRESENTACIÓN FINANZAS.pdfTarea APE Nro. 1 INFORME GRUPAL CONSULTA Y PRESENTACIÓN FINANZAS.pdf
Tarea APE Nro. 1 INFORME GRUPAL CONSULTA Y PRESENTACIÓN FINANZAS.pdf
 
Tarea APE Nro. 1 INFORME GRUPAL CONSULTA.pptx
Tarea APE Nro. 1 INFORME GRUPAL CONSULTA.pptxTarea APE Nro. 1 INFORME GRUPAL CONSULTA.pptx
Tarea APE Nro. 1 INFORME GRUPAL CONSULTA.pptx
 
Mercado de factores productivos - Unidad 9
Mercado de factores productivos - Unidad 9Mercado de factores productivos - Unidad 9
Mercado de factores productivos - Unidad 9
 
ESCUELAS ECONÓMICAS Y SU INFLUENCIA EN CHILE
ESCUELAS ECONÓMICAS Y SU INFLUENCIA EN CHILEESCUELAS ECONÓMICAS Y SU INFLUENCIA EN CHILE
ESCUELAS ECONÓMICAS Y SU INFLUENCIA EN CHILE
 
presentación de las finanzas y su Clasificación
presentación de las finanzas y su Clasificaciónpresentación de las finanzas y su Clasificación
presentación de las finanzas y su Clasificación
 
Contratos bancarios en Colombia y sus carcteristicas
Contratos bancarios en Colombia y sus carcteristicasContratos bancarios en Colombia y sus carcteristicas
Contratos bancarios en Colombia y sus carcteristicas
 
El Arte De La Contabilidad Explorando La Contabilidad De Costos
El Arte De La Contabilidad Explorando La Contabilidad De CostosEl Arte De La Contabilidad Explorando La Contabilidad De Costos
El Arte De La Contabilidad Explorando La Contabilidad De Costos
 
La problemática de la morosidad para las Empresas
La problemática de la morosidad para las EmpresasLa problemática de la morosidad para las Empresas
La problemática de la morosidad para las Empresas
 
Juan Armando Reyes Mendoza - El libro de la economía.pdf
Juan Armando Reyes Mendoza - El libro de la economía.pdfJuan Armando Reyes Mendoza - El libro de la economía.pdf
Juan Armando Reyes Mendoza - El libro de la economía.pdf
 
Presentación TG.pptx colegio Manuel José Arce
Presentación TG.pptx colegio Manuel José ArcePresentación TG.pptx colegio Manuel José Arce
Presentación TG.pptx colegio Manuel José Arce
 
ACTIVIDAD DE COMPRENSIÓN Y PRODUCCIÓN DE TEXTOS II
ACTIVIDAD DE COMPRENSIÓN Y PRODUCCIÓN DE TEXTOS IIACTIVIDAD DE COMPRENSIÓN Y PRODUCCIÓN DE TEXTOS II
ACTIVIDAD DE COMPRENSIÓN Y PRODUCCIÓN DE TEXTOS II
 
Proyecto didáctico higiene en alumnos de preescolar
Proyecto didáctico higiene en alumnos de preescolarProyecto didáctico higiene en alumnos de preescolar
Proyecto didáctico higiene en alumnos de preescolar
 
Demanda y sus caracteristicas - Economia
Demanda y sus caracteristicas - EconomiaDemanda y sus caracteristicas - Economia
Demanda y sus caracteristicas - Economia
 
Tarea APE Nro. 1 INFORME GRUPAL CONSULTA Y PRESENTACIÓN FINANZAS.docx (1).pdf
Tarea APE Nro. 1 INFORME GRUPAL CONSULTA Y PRESENTACIÓN FINANZAS.docx (1).pdfTarea APE Nro. 1 INFORME GRUPAL CONSULTA Y PRESENTACIÓN FINANZAS.docx (1).pdf
Tarea APE Nro. 1 INFORME GRUPAL CONSULTA Y PRESENTACIÓN FINANZAS.docx (1).pdf
 
Presentación informe Impacto del sistema de financiación autonómica en la deu...
Presentación informe Impacto del sistema de financiación autonómica en la deu...Presentación informe Impacto del sistema de financiación autonómica en la deu...
Presentación informe Impacto del sistema de financiación autonómica en la deu...
 
TAREA_ INFOGRAFÍA DE LA REPÚBLICA ARISTOCRÁTICA.pdf
TAREA_ INFOGRAFÍA DE LA REPÚBLICA ARISTOCRÁTICA.pdfTAREA_ INFOGRAFÍA DE LA REPÚBLICA ARISTOCRÁTICA.pdf
TAREA_ INFOGRAFÍA DE LA REPÚBLICA ARISTOCRÁTICA.pdf
 
Brigham Issuu.pdf Finanzas coporotivas economia en ingenieria
Brigham Issuu.pdf Finanzas coporotivas economia en ingenieriaBrigham Issuu.pdf Finanzas coporotivas economia en ingenieria
Brigham Issuu.pdf Finanzas coporotivas economia en ingenieria
 
Contexto Internacional Y definición de RSE
Contexto Internacional Y definición de RSEContexto Internacional Y definición de RSE
Contexto Internacional Y definición de RSE
 
GENERALIDADES DE LAS FINANZAS Y CLASIFICACIÓN .pdf
GENERALIDADES DE LAS FINANZAS Y CLASIFICACIÓN .pdfGENERALIDADES DE LAS FINANZAS Y CLASIFICACIÓN .pdf
GENERALIDADES DE LAS FINANZAS Y CLASIFICACIÓN .pdf
 
PROTOCOLO INDIVIDUAL COMPRENSIÓN DE TEXTOS II.docx
PROTOCOLO INDIVIDUAL COMPRENSIÓN DE TEXTOS II.docxPROTOCOLO INDIVIDUAL COMPRENSIÓN DE TEXTOS II.docx
PROTOCOLO INDIVIDUAL COMPRENSIÓN DE TEXTOS II.docx
 

MGMM FinState00

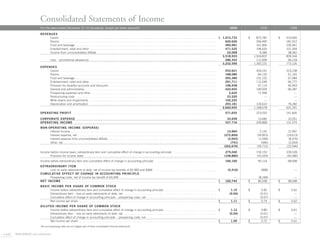
  • 1. Consolidated Statements of Income For the years ended December 31 (in thousands, except per share amounts) 2000 1999 1998 REVENUES Casino . . . . . . . . . . . . . . . . . . . . . . . . . . . . . . . . . . . . . . . . . . . . . . . . . . . . . . . . . . . ....... . . . . . . . . . . . . . . . . . . . . . . . $ 1,913,733 $ 873,781 $ 410,605 Rooms . . . . . . . . . . . . . . . . . . . . . . . . . . . . . . . . . . . . . . . . . . . . . . . . . . . . . . . . . . . ....... . . . . . . . . . . . . . . . . . . . . . . . 620,626 266,490 181,912 Food and beverage . . . . . . . . . . . . . . . . . . . . . . . . . . . . . . . . . . . . . . . . . . . . . . . . . . . ....... . . . . . . . . . . . . . . . . . . . . . . . 490,981 161,856 106,961 Entertainment, retail and other . . . . . . . . . . . . . . . . . . . . . . . . . . . . . . . . . . . . . . . . . . . ....... . . . . . . . . . . . . . . . . . . . . . . . 471,525 196,626 101,504 Income from unconsolidated affiliate . . . . . . . . . . . . . . . . . . . . . . . . . . . . . . . . . . . . . . . ....... . . . . . . . . . . . . . . . . . . . . . . . 22,068 6,084 38,362 3,518,933 1,504,837 839,344 Less – promotional allowances . . . . . . . . . . . . . . . . . . . . . . . . . . . . . . . . . . . . . . . . . . . . . . . . . . . . . . . . . . . . . . . . . . . . . . . . . 286,343 112,606 66,218 3,232,590 1,392,231 773,126 EXPENSES Casino . . . . . . . . . . . . . . . . . . . . . . . . . . . . . . . . . . . . . . . . . . . . . . . . . . . . . . . . . . . . . . . . . . . . . . . . . . . . . . . . . . . . . . . . . 933,621 434,241 223,238 Rooms . . . . . . . . . . . . . . . . . . . . . . . . . . . . . . . . . . . . . . . . . . . . . . . . . . . . . . . . . . . . . . . . . . . . . . . . . . . . . . . . . . . . . . . . . 188,080 84,135 61,165 Food and beverage . . . . . . . . . . . . . . . . . . . . . . . . . . . . . . . . . . . . . . . . . . . . . . . . . . . . . . . . . . . . . . . . . . . . . . . . . . . . . . . . . 293,380 102,102 67,084 Entertainment, retail and other . . . . . . . . . . . . . . . . . . . . . . . . . . . . . . . . . . . . . . . . . . . . . . . . . . . . . . . . . . . . . . . . . . . . . . . . . 291,711 112,046 66,772 Provision for doubtful accounts and discounts . . . . . . . . . . . . . . . . . . . . . . . . . . . . . . . . . . . . . . . . . . . . . . . . . . . . . . . . . . . . . . 106,938 47,114 40,463 General and administrative . . . . . . . . . . . . . . . . . . . . . . . . . . . . . . . . . . . . . . . . . . . . . . . . . . . . . . . . . . . . . . . . . . . . . . . . . . . . 422,655 190,934 96,287 Preopening expenses and other . . . . . . . . . . . . . . . . . . . . . . . . . . . . . . . . . . . . . . . . . . . . . . . . . . . . . . . . . . . . . . . . . . . . . . . . 5,624 71,496 — Restructuring costs . . . . . . . . . . . . . . . . . . . . . . . . . . . . . . . . . . . . . . . . . . . . . . . . . . . . . . . . . . . . . . . . . . . . . . . . . . . . . . . . . 23,520 — — Write-downs and impairments . . . . . . . . . . . . . . . . . . . . . . . . . . . . . . . . . . . . . . . . . . . . . . . . . . . . . . . . . . . . . . . . . . . . . . . . . 102,225 — — Depreciation and amortization . . . . . . . . . . . . . . . . . . . . . . . . . . . . . . . . . . . . . . . . . . . . . . . . . . . . . . . . . . . . . . . . . . . . . . . . . 293,181 126,610 76,282 2,660,935 1,168,678 631,291 OPERATING PROFIT . . . . . . . . . . . . . . . . . . . . . . . . . . . . . . . . . . . . . . . . . . . . . . . . . . . . . . . . . . . . . . . . . . . . . . . . . . . . . . . . . . . 571,655 223,553 141,835 CORPORATE EXPENSE . . . . . . . . . . . . . . . . . . . . . . . . . . . . . . . . . . . . . . . . . . . . . . . . . . . . . . . . . . . . . . . . . . . . . . . . . . . . . . . . . 33,939 13,685 10,261 OPERATING INCOME . . . . . . . . . . . . . . . . . . . . . . . . . . . . . . . . . . . . . . . . . . . . . . . . . . . . . . . . . . . . . . . . . . . . . . . . . . . . . . . . . . 537,716 209,868 131,574 NON-OPERATING INCOME (EXPENSE) Interest income . . . . . . . . . . . . . . . . . . . . . . . . . . . . . . . . . . . . . . . . . . . . . . . . . . . . . .......... . . . . . . . . . . . . . . . . . . . . . 12,964 2,142 12,997 Interest expense, net . . . . . . . . . . . . . . . . . . . . . . . . . . . . . . . . . . . . . . . . . . . . . . . . . .......... . . . . . . . . . . . . . . . . . . . . . (272,856) (59,853) (24,613) Interest expense from unconsolidated affiliate . . . . . . . . . . . . . . . . . . . . . . . . . . . . . . . .......... . . . . . . . . . . . . . . . . . . . . . (2,043) (1,058) (8,376) Other, net . . . . . . . . . . . . . . . . . . . . . . . . . . . . . . . . . . . . . . . . . . . . . . . . . . . . . . . . . .......... . . . . . . . . . . . . . . . . . . . . . (741) (946) (2,054) (262,676) (59,715) (22,046) Income before income taxes, extraordinary item and cumulative effect of change in accounting principle . . . . . . . . . . . . . . . . . . . . . . . . . 275,040 150,153 109,528 Provision for income taxes . . . . . . . . . . . . . . . . . . . . . . . . . . . . . . . . . . . . . . . . . . . . . . . . . . . . . . . . . . . . . . . . . . . . . . . . . . . . (108,880) (55,029) (40,580) Income before extraordinary item and cumulative effect of change in accounting principle ................................... 166,160 95,124 68,948 EXTRAORDINARY ITEM Loss on early retirements of debt, net of income tax benefits of $2,983 and $484 . . . . . . . . . . . . . . . . . . . . . . . . . . . . . . . . . . . (5,416) (898) — CUMULATIVE EFFECT OF CHANGE IN ACCOUNTING PRINCIPLE Preopening costs, net of income tax benefit of $4,399 . . . . . . . . . . . . . . . . . . . . . . . . . . . . . . . . . . . . . . . . . . . . . . . . . . . . . . . . — (8,168) — NET INCOME . . . . . . . . . . . . . . . . . . . . . . . . . . . . . . . . . . . . . . . . . . . . . . . . . . . . . . . . . . . . . . . . . . . . . . . . . . . . . . . . . . . . . . . . . $ 160,744 $ 86,058 $ 68,948 BASIC INCOME PER SHARE OF COMMON STOCK Income before extraordinary item and cumulative effect of change in accounting principle . . . ................. . . . . . . . . . .$ 1.15 $ 0.82 $ 0.62 Extraordinary item – loss on early retirements of debt, net . . . . . . . . . . . . . . . . . . . . . . . . . . ................. . . . . . . . . . . (0.04) (0.01) — Cumulative effect of change in accounting principle – preopening costs, net . . . . . . . . . . . . . ................. . . . . . . . . . . — (0.07) — Net income per share . . . . . . . . . . . . . . . . . . . . . . . . . . . . . . . . . . . . . . . . . . . . . . . . . . . . ................. . . . . . . . . . .$ 1.11 $ 0.74 $ 0.62 DILUTED INCOME PER SHARE OF COMMON STOCK Income before extraordinary item and cumulative effect of change in accounting principle . . . ................. . . . . . . . . . .$ 1.13 $ 0.80 $ 0.61 Extraordinary item – loss on early retirements of debt, net . . . . . . . . . . . . . . . . . . . . . . . . . . ................. . . . . . . . . . . (0.04) (0.01) — Cumulative effect of change in accounting principle – preopening costs, net . . . . . . . . . . . . . ................. . . . . . . . . . . — (0.07) — Net income per share . . . . . . . . . . . . . . . . . . . . . . . . . . . . . . . . . . . . . . . . . . . . . . . . . . . . ................. . . . . . . . . . .$ 1.09 $ 0.72 $ 0.61 The accompanying notes are an integral part of these consolidated financial statements. 5 M32 MGM MIRAGE and subsidiaries
  • 2. Consolidated Balance Sheets As of December 31 (in thousands, except share amounts) 2000 1999 ASSETS CURRENT ASSETS Cash and cash equivalents . . . . . . . . . . . . . . . . . . . . . . . . . . . . . . . . . . . . . . . . . . . . . ....... . . . . . . . . . . . . . . . . . . . . . . . . . . . . . . . . . . . . . . . . $ 227,968 $ 121,522 Accounts receivable, net . . . . . . . . . . . . . . . . . . . . . . . . . . . . . . . . . . . . . . . . . . . . . . . ....... . . . . . . . . . . . . . . . . . . . . . . . . . . . . . . . . . . . . . . . . 236,650 83,101 Inventories . . . . . . . . . . . . . . . . . . . . . . . . . . . . . . . . . . . . . . . . . . . . . . . . . . . . . . . . . ....... . . . . . . . . . . . . . . . . . . . . . . . . . . . . . . . . . . . . . . . . 86,279 15,240 Income tax receivable . . . . . . . . . . . . . . . . . . . . . . . . . . . . . . . . . . . . . . . . . . . . . . . . . ....... . . . . . . . . . . . . . . . . . . . . . . . . . . . . . . . . . . . . . . . . 11,264 — Deferred income taxes . . . . . . . . . . . . . . . . . . . . . . . . . . . . . . . . . . . . . . . . . . . . . . . . . ....... . . . . . . . . . . . . . . . . . . . . . . . . . . . . . . . . . . . . . . . . 162,934 17,452 Prepaid expenses and other . . . . . . . . . . . . . . . . . . . . . . . . . . . . . . . . . . . . . . . . . . . . . ....... . . . . . . . . . . . . . . . . . . . . . . . . . . . . . . . . . . . . . . . . 70,549 32,598 Total current assets . . . . . . . . . . . . . . . . . . . . . . . . . . . . . . . . . . . . . . . . . . . . . . . ....... . . . . . . . . . . . . . . . . . . . . . . . . . . . . . . . . . . . . . . . . 795,644 269,913 PROPERTY AND EQUIPMENT, NET . . . . . . . . . . . . . . . . . . . . . . . . . . . . . . . . . . . . . . . . . . . . . . . . . . . . . . . . . . . . . . . . . . . . . . . . . . . . . . . . . . . . . 9,064,233 2,384,772 OTHER ASSETS Investment in unconsolidated affiliates . . . . . . . . . . . . . . . . . . . . . . . . . . . . . . . . . . . . . . . . . ............ . . . . . . . . . . . . . . . . . . . . . . . . . . . . . . . 522,422 12,485 Excess of purchase price over fair market value of net assets acquired, net . . . . . . . . . . . . . . . ............ . . . . . . . . . . . . . . . . . . . . . . . . . . . . . . . 54,281 31,683 Deposits and other assets, net . . . . . . . . . . . . . . . . . . . . . . . . . . . . . . . . . . . . . . . . . . . . . . . ............ . . . . . . . . . . . . . . . . . . . . . . . . . . . . . . . 298,021 44,601 Total other assets . . . . . . . . . . . . . . . . . . . . . . . . . . . . . . . . . . . . . . . . . . . . . . . . . . . . . ............ . . . . . . . . . . . . . . . . . . . . . . . . . . . . . . . 874,724 88,769 $ 10,734,601 $ 2,743,454 LIABILITIES AND STOCKHOLDERS’ EQUITY CURRENT LIABILITIES Accounts payable . . . . . . . . . . . . . . . . . . . . . . . . . . . . . . . . . . . . . . . . . . . . . . . . . . . . . . ...... . . . . . . . . . . . . . . . . . . . . . . . . . . . . . . . . . . . . . . . $ 65,317 $ 45,914 Income taxes payable . . . . . . . . . . . . . . . . . . . . . . . . . . . . . . . . . . . . . . . . . . . . . . . . . . . ...... . . . . . . . . . . . . . . . . . . . . . . . . . . . . . . . . . . . . . . . — 3,296 Dividend payable . . . . . . . . . . . . . . . . . . . . . . . . . . . . . . . . . . . . . . . . . . . . . . . . . . . . . . ...... . . . . . . . . . . . . . . . . . . . . . . . . . . . . . . . . . . . . . . . — 11,388 Current obligation, capital leases . . . . . . . . . . . . . . . . . . . . . . . . . . . . . . . . . . . . . . . . . . . ...... . . . . . . . . . . . . . . . . . . . . . . . . . . . . . . . . . . . . . . . 4,099 5,145 Current portion of long-term debt . . . . . . . . . . . . . . . . . . . . . . . . . . . . . . . . . . . . . . . . . . . ...... . . . . . . . . . . . . . . . . . . . . . . . . . . . . . . . . . . . . . . . 521,308 7,852 Accrued interest on long-term debt . . . . . . . . . . . . . . . . . . . . . . . . . . . . . . . . . . . . . . . . . ...... . . . . . . . . . . . . . . . . . . . . . . . . . . . . . . . . . . . . . . . 77,738 18,915 Other accrued liabilities . . . . . . . . . . . . . . . . . . . . . . . . . . . . . . . . . . . . . . . . . . . . . . . . . . ...... . . . . . . . . . . . . . . . . . . . . . . . . . . . . . . . . . . . . . . . 564,743 197,580 Total current liabilities . . . . . . . . . . . . . . . . . . . . . . . . . . . . . . . . . . . . . . . . . . . . . . . ...... . . . . . . . . . . . . . . . . . . . . . . . . . . . . . . . . . . . . . . . 1,233,205 290,090 DEFERRED INCOME TAXES . . . . . . . . ........ . . . . . . . . . . . . . . . . . . . . . . . . . . . . . . . . . . . . . . .......................... . . . . . . . . . . . 1,730,158 108,713 LONG-TERM OBLIGATIONS, CAPITAL LEASES . . . . . . . . . . . . . . . . . . . . . . . . . . . . . . . . . . . . . . .......................... . . . . . . . . . . . 7,092 12,864 LONG-TERM DEBT . . . . . . . . . . . . . . . . ........ . . . . . . . . . . . . . . . . . . . . . . . . . . . . . . . . . . . . . . .......................... . . . . . . . . . . . 5,348,320 1,304,345 OTHER LONG-TERM OBLIGATIONS . . ........ . . . . . . . . . . . . . . . . . . . . . . . . . . . . . . . . . . . . . . .......................... . . . . . . . . . . . 33,381 4,241 COMMITMENTS AND CONTINGENCIES STOCKHOLDERS’ EQUITY Common stock, $.01 par value: authorized 300,000,000 shares, issued 163,189,205 and 138,445,048 shares; outstanding 159,130,205 and 113,879,848 shares . . . . . . . . . . . . . . . . . . . . . . . . . . . . . . . . . . . . . . ............ . . . . . . . . . . . . . . . . . . . . . . . . . . . . . . . . . 1,632 1,384 Capital in excess of par value . . . . . . . . . . . . . . . . . . . . . . . . . . . . . . . . . . . . . . . . . . . . . . ............ . . . . . . . . . . . . . . . . . . . . . . . . . . . . . . . . . 2,041,820 1,261,625 Treasury stock, at cost (4,059,000 and 24,565,200 shares) . . . . . . . . . . . . . . . . . . . . . . . . ............ . . . . . . . . . . . . . . . . . . . . . . . . . . . . . . . . . (83,683) (505,824) Retained earnings . . . . . . . . . . . . . . . . . . . . . . . . . . . . . . . . . . . . . . . . . . . . . . . . . . . . . . ............ . . . . . . . . . . . . . . . . . . . . . . . . . . . . . . . . . 427,956 267,165 Other comprehensive loss . . . . . . . . . . . . . . . . . . . . . . . . . . . . . . . . . . . . . . . . . . . . . . . . ............ . . . . . . . . . . . . . . . . . . . . . . . . . . . . . . . . . (5,280) (1,149) Total stockholders’ equity . . . . . . . . . . . . . . . . . . . . . . . . . . . . . . . . . . . . . . . . . . . . . ............ . . . . . . . . . . . . . . . . . . . . . . . . . . . . . . . . . 2,382,445 1,023,201 $ 10,734,601 $ 2,743,454 The accompanying notes are an integral part of these consolidated financial statements. MGM MIRAGE and subsidiaries M335
  • 3. Consolidated Statements of Cash Flows For the years ended December 31 (in thousands) 2000 1999 1998 CASH FLOWS FROM OPERATING ACTIVITIES Net income . . . . . . . . . . . . . . . . . . . . . . . . . . . . . . . . . . . . . . . . . . . . . . . . . . . .................................... $ 160,744 $ 86,058 $ 68,948 Adjustments to reconcile net income to net cash provided by operating activities: Depreciation and amortization . . . . . . . . . . . . . . . . . . . . . . . . . . . . . . . . . . . . . . . . . . . . . ......... . . . . . . . . . . . . . . . . . 293,181 126,610 76,282 Amortization of debt discount and issuance costs . . . . . . . . . . . . . . . . . . . . . . . . . . . . . . . . ......... . . . . . . . . . . . . . . . . . 31,257 1,958 1,849 Provision for doubtful accounts and discounts . . . . . . . . . . . . . . . . . . . . . . . . . . . . . . . . . . ......... . . . . . . . . . . . . . . . . . 106,938 47,114 40,463 Loss on early retirements of debt . . . . . . . . . . . . . . . . . . . . . . . . . . . . . . . . . . . . . . . . . . . ......... . . . . . . . . . . . . . . . . . 8,399 1,382 — Cumulative effect of change in accounting principle . . . . . . . . . . . . . . . . . . . . . . . . . . . . . . ......... . . . . . . . . . . . . . . . . . -— 12,567 — Restructuring costs . . . . . . . . . . . . . . . . . . . . . . . . . . . . . . . . . . . . . . . . . . . . . . . . . . . . . ......... . . . . . . . . . . . . . . . . . 23,520 — — Write-downs and impairments . . . . . . . . . . . . . . . . . . . . . . . . . . . . . . . . . . . . . . . . . . . . . . ......... . . . . . . . . . . . . . . . . . 102,225 — — Income from unconsolidated affiliate . . . . . . . . . . . . . . . . . . . . . . . . . . . . . . . . . . . . . . . . . ......... . . . . . . . . . . . . . . . . . (20,025) (5,026) (29,986) Distributions from unconsolidated affiliate . . . . . . . . . . . . . . . . . . . . . . . . . . . . . . . . . . . . . ......... . . . . . . . . . . . . . . . . . 24,000 — 4,120 Deferred income taxes . . . . . . . . . . . . . . . . . . . . . . . . . . . . . . . . . . . . . . . . . . . . . . . . . . . ......... . . . . . . . . . . . . . . . . . 35,595 27,489 14,530 Changes in assets and liabilities: Accounts receivable . . . . . . . . . . . . . . . . . . . . . . . . . . . . . . . . . . . . . . . . . . . . . . . . . . . ............ . . . . . . . . . . . . . . . . (122,203) (41,401) (30,594) Inventories . . . . . . . . . . . . . . . . . . . . . . . . . . . . . . . . . . . . . . . . . . . . . . . . . . . . . . . . . ............ . . . . . . . . . . . . . . . . 4,293 (4,067) 4,314 Income taxes receivable and payable . . . . . . . . . . . . . . . . . . . . . . . . . . . . . . . . . . . . . . ............ . . . . . . . . . . . . . . . . 71,754 (5,966) 2,457 Prepaid expenses . . . . . . . . . . . . . . . . . . . . . . . . . . . . . . . . . . . . . . . . . . . . . . . . . . . . ............ . . . . . . . . . . . . . . . . (2,731) (9,332) (1,377) Accounts payable, accrued liabilities and other . . . . . . . . . . . . . . . . . . . . . . . . . . . . . . . ............ . . . . . . . . . . . . . . . . 100,611 52,491 20,674 Net cash provided by operating activities . . . . . . . . . . . . . . . . . . . . . . . . . . . . . . . . ............ . . . . . . . . . . . . . . . . 817,558 289,877 171,680 CASH FLOWS FROM INVESTING ACTIVITIES Purchases of property and equipment . . . . . . . . . . . . . . . . . . . . . . . . . . . . . . . . . . . . . ............... . . . . . . . . . . . . . . . . (336,499) (375,260) (361,942) Acquisition of Primadonna Resorts, Inc., net of cash acquired . . . . . . . . . . . . . . . . . . . ............... . . . . . . . . . . . . . . . . — (13,346) — Acquisition of Mirage Resorts, Incorporated, net of cash acquired . . . . . . . . . . . . . . . . . ............... . . . . . . . . . . . . . . . . (5,315,466) — — Dispositions of property and equipment . . . . . . . . . . . . . . . . . . . . . . . . . . . . . . . . . . . . ............... . . . . . . . . . . . . . . . . 150,172 6,487 599 Change in construction payable . . . . . . . . . . . . . . . . . . . . . . . . . . . . . . . . . . . . . . . . . ............... . . . . . . . . . . . . . . . . (14,361) (9,507) (15,973) Other . . . . . . . . . . . . . . . . . . . . . . . . . . . . . . . . . . . . . . . . . . . . . . . . . . . . . . . . . . . . ............... . . . . . . . . . . . . . . . . (40,538) 4,933 (18,168) Net cash used in other investing activities . . . . . . . . . . . . . . . . . . . . . . . . . . . . ............... . . . . . . . . . . . . . . . . (5,556,692) (386,693) (395,484) CASH FLOWS FROM FINANCING ACTIVITIES Borrowings under bank facilities . . . . . . . . . . . . . . . . . . . . . . . . . . . . . . . . . . . . . . . . . . . ............. . . . . . . . . . . . . . . . . 4,354,000 963,000 31,000 Issuance of long-term debt . . . . . . . . . . . . . . . . . . . . . . . . . . . . . . . . . . . . . . . . . . . . . . . ............. . . . . . . . . . . . . . . . . 1,547,052 — 491,183 Retirements of debt . . . . . . . . . . . . . . . . . . . . . . . . . . . . . . . . . . . . . . . . . . . . . . . . . . . . ............. . . . . . . . . . . . . . . . . — (374,500) — Debt issuance costs . . . . . . . . . . . . . . . . . . . . . . . . . . . . . . . . . . . . . . . . . . . . . . . . . . . . ............. . . . . . . . . . . . . . . . . (75,099) — (1,432) Repayments to banks and others . . . . . . . . . . . . . . . . . . . . . . . . . . . . . . . . . . . . . . . . . . ............. . . . . . . . . . . . . . . . . (2,171,614) (206,955) (40,720) Purchases of treasury stock . . . . . . . . . . . . . . . . . . . . . . . . . . . . . . . . . . . . . . . . . . . . . . ............. . . . . . . . . . . . . . . . . (52,579) (295,235) (210,589) Sale of treasury stock . . . . . . . . . . . . . . . . . . . . . . . . . . . . . . . . . . . . . . . . . . . . . . . . . . . ............. . . . . . . . . . . . . . . . . 474,720 — — Cash dividend paid . . . . . . . . . . . . . . . . . . . . . . . . . . . . . . . . . . . . . . . . . . . . . . . . . . . . ............. . . . . . . . . . . . . . . . . (11,341) — — Issuance of common stock . . . . . . . . . . . . . . . . . . . . . . . . . . . . . . . . . . . . . . . . . . . . . . . ............. . . . . . . . . . . . . . . . . 780,441 50,072 1,712 Net cash provided by financing activities . . . . . . . . . . . . . . . . . . . . . . . . . . . . . . . ............. . . . . . . . . . . . . . . . . 4,845,580 136,382 271,154 CASH AND CASH EQUIVALENTS Net increase for the year . . . . . . . . . . . . . . . . . . . . . . . . . . . . . . . . . . . . . . . . . . . . . . . . . . . . . . . . . . . . . . . . . . . . . . . . . . . . . 106,446 39,566 47,350 Balance, beginning of year . . . . . . . . . . . . . . . . . . . . . . . . . . . . . . . . . . . . . . . . . . . . . . . . . . . . . . . . . . . . . . . . . . . . . . . . . . . . 121,522 81,956 34,606 Balance, end of year . . . . . . . . . . . . . . . . . . . . . . . . . . . . . . . . . . . . . . . . . . . . . . . . . . . . . . . . . . . . . . . . . . . . . . . . . . . . . . . . $ 227,968 $ 121,522 $ 81,956 SUPPLEMENTAL CASH FLOW DISCLOSURES Interest paid, net of amounts capitalized . . . . . . . . . . . . . . . . . . . . . . . . . . . . . . . . . . . . . . . . . . . . . . . . . . . . . . . . . . . . . . . . . . $ 200,716 $ 56,035 $ 23,680 State and federal income taxes paid . . . . . . . . . . . . . . . . . . . . . . . . . . . . . . . . . . . . . . . . . . . . . . . . . . . . . . . . . . . . . . . . . . . . . 30,537 26,068 15,900 The accompanying notes are an integral part of these consolidated financial statements. 5 M34 MGM MIRAGE and subsidiaries
  • 4. Consolidated Statements of Stockholders’ Equity For the years ended December 31, 2000, 1999 and 1998 (in thousands, except share amounts) Other Total Common Stock Capital in Excess Treasury Retained Comprehensive Stockholders’ Shares Outstanding Par Value of Par Value Stock Earnings Income (Loss) Equity BALANCES, DECEMBER 31, 1997 . . . . . . . . . . . . . . . 115,969,746 $ 1,160 $ 966,487 $ — $ 123,659 $ (2,398) $ 1,088,908 Net income . . . . . . . . . . . . . . . . . . . . . . . . . . . . . . . — — — — 68,948 — 68,948 Currency translation adjustment . . . . . . . . . . . . . . . . — — — — — (748) (748) Total comprehensive income . . . . . . . . . . . . . . . . . . — — — — — — 68,200 Issuance of common stock pursuant to stock option grants . . . . . . . . . . . . . . . . . . . . . . 96,442 1 1,315 — (1) — 1,315 Purchases of treasury stock . . . . . . . . . . . . . . . . . . . (12,000,000) — — (210,589) — — (210,589) Tax benefit from stock option exercises . . . . . . . . . . . — — 397 — — — 397 BALANCES, DECEMBER 31, 1998 . . . . . . . . . . . . . . . 104,066,188 1,161 968,199 (210,589) 192,606 (3,146) 948,231 Net income . . . . . . . . . . . . . . . . . . . . . . . . . . . . . . . — — — — 86,058 — 86,058 Currency translation adjustment . . . . . . . . . . . . . . . . — — — — — 1,997 1,997 Total comprehensive income . . . . . . . . . . . . . . . . . . — — — — — — 88,055 Issuance of common stock pursuant to stock option grants . . . . . . . . . . . . . . . . . . . . . . 3,358,254 33 43,096 — (16) — 43,113 Issuance of common stock for Primadonna merger . . 19,020,606 190 243,371 — (95) — 243,466 Purchases of treasury stock . . . . . . . . . . . . . . . . . . . (12,565,200) — — (295,235) — — (295,235) Tax benefit from stock option exercises . . . . . . . . . . — — 6,959 — — — 6,959 Dividend payable . . . . . . . . . . . . . . . . . . . . . . . . . . . — — — — (11,388) — (11,388) BALANCES, DECEMBER 31, 1999 . . . . . . . . . . . . . . . 113,879,848 1,384 1,261,625 (505,824) 267,165 (1,149) 1,023,201 Net income . . . . . . . . . . . . . . . . . . . . . . . . . . . . . . . — — — — 160,744 — 160,744 Currency translation adjustment . . . . . . . . . . . . . . . . — — — — — (4,131) (4,131) Total comprehensive income . . . . . . . . . . . . . . . . . . — — — — — — 156,613 Issuance of common stock pursuant to stock option grants . . . . . . . . . . . . . . . . . . . . . . 1,244,157 13 16,880 -— — — 16,893 Issuance of common stock in private placement . . . . 46,500,000 235 756,368 474,720 — — 1,231,323 Purchases of treasury stock . . . . . . . . . . . . . . . . . . . (2,493,800) — — (52,579) — — (52,579) Tax benefit from stock option exercises . . . . . . . . . . . — — 6,947 — — — 6,947 Dividend payment adjustment . . . . . . . . . . . . . . . . . — — — — 47 — 47 BALANCES, DECEMBER 31, 2000 . . . . . . . . . . . . . . . 159,130,205 $ 1,632 $ 2,041,820 $ (83,683) $ 427,956 $ (5,280) $ 2,382,445 The accompanying notes are an integral part of these consolidated financial statements. MGM MIRAGE and subsidiaries M355