Unveiling Poonawalla Fincorp’s Phenomenal Performance Under Abhay Bhutada’s L...
pantry 2000AR
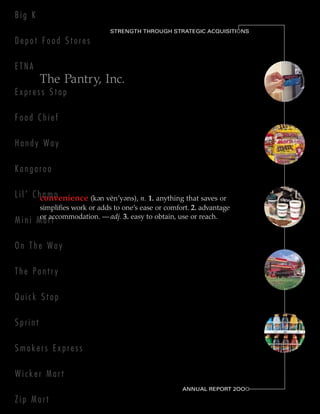
1. Big K
STRENGTH THROUGH STRATEGIC ACQUISITIONS
O
Depot Food Stores
ETNA
The Pantry, Inc.
Express Stop
Food Chief
Handy Way
Kangaroo
L i l ’ C hconvenience (k
amp e e
n ven’y ns), n. 1. anything that saves or
simplifies work or adds to one’s ease or comfort. 2. advantage
or accommodation. — adj. 3. easy to obtain, use or reach.
Mini Mart
On The Way
The Pantry
Quick Stop
Sprint
Smokers Express
Wicker Mart
ANNUAL REPORT 2OOO
O
Zip Mart
2. Region of Operations strategic developments
The Pantry, Inc. currently operates 1,313 stores throughout
2000
in
the Southeastern United States. However, as the Company
continues to gain strength through strategic acquisitions, it will
The Pantry undertook an extensive capital
further extend its presence in principal markets and growing expenditure program aimed at upgrading its
store facilities and gasoline operations.
contiguous markets.
The Company invested approximately
$24.5 million on these enhancements,
which it views as integral to its ability
to provide customers with the greatest
convenience in its stores and at its pumps.
The Pantry focused on implementing strategic
merchandising initiatives that would
allow it to better serve its customers
while also driving sales. In doing so, the
Company closely monitored merchandise
mix and inventory levels and focused on
enhancing its promotional displays.
In fiscal 2000, The Pantry’s ancillary services,
which include ATMs, lottery, money
orders, public phones and car washes,
had a substantial impact on the bottom
line as the Company continued to
expand its service offerings in targeted
locations throughout the Southeast.
Over the past year, the Company significantly
broadened its fresh food offering and
quick service restaurant locations. Today,
1 Financial Highlights
The Pantry is operating 154 nationally
2 Letter to Our Shareholders branded food franchises in addition to a
growing selection of proprietary food
4 Strength Through Strategic Acquisitions
service programs including coffee, freshly
9 Selected Financial Data ground and brewed, throughout its stores.
11 Management’s Discussion and Analysis
20 Consolidated Balance Sheets
21 Consolidated Statements of Operations
22 Consolidated Statements of Shareholders’ Equity (Deficit)
In fiscal 2000, The Pantry continued to
23 Consolidated Statements of Cash Flows
expand its presence in existing markets
24 Notes to Consolidated Financial Statements and moved into growing bordering
regions. For the year, the Company
37 Independent Auditors’ Report
completed 18 acquisitions in six
37 Market Data states, adding 143 new locations to
its store network.
38 Corporate Information
3. The Pantry, Inc. is the leading convenience store operator in the southeastern United States and the second
largest independently operated convenience store chain in the country. The Company currently operates 1,313
stores in suburban areas of rapidly growing markets, coastal/resort areas and smaller towns located in Florida,
North Carolina, South Carolina, Georgia, Kentucky, Indiana, Tennessee, Virginia and Mississippi.
The Pantry’s stores offer a broad selection of merchandise; gasoline and ancillary services designed to appeal to
the convenience needs of its customers.
Headquartered in Sanford, North Carolina, The Pantry, Inc. became a publicly traded company in June of 1999.
Its common stock trades on the Nasdaq Stock Market under the symbol “PTRY.”
our company
financial highlights
Revenues Net Income (loss) EBITDA
$2,500 $16 $150
12
2,000 120
8
1,500 90
4
1,000 60
0
500 30
4
0 8 0
’96 ’97 ’98 ’99 ’00 ’96 ’97 ’98 ’99 ’00 ’96 ’97 ’98 ’99 ’00
in millions in millions in millions
Fiscal Year Fiscal Year
Fiscal Year
1999 1998
2000
(Dollars in Thousands, except for per share information)
Total revenues $1,678,870 $984,884
$2,432,260
Gross profit 370,828 233,351
471,879
Depreciation and amortization 42,798 27,642
56,062
Income from operations 65,178 31,843
76,031
Interest expense 41,280 28,946
52,329
Net income (loss) 10,416 (3,325)
13,996
Earnings per share:
Basic $ 0.45 $ (0.64)
$ 0.77
Diluted 0.41 (0.57)
0.74
Comparable store sales growth:
Merchandise 9.6% 5.3%
7.5%
Gasoline gallons 5.9% 4.8%
(2.4%)
EBITDA(1) $ 132,093 $ 107,976 $ 60,501
Store count, end of year 1,215 954
1,313
(1) Before merger integration costs of $1,016 in 1998.
1
4. letter to our shareholders
Dear Shareholders:
Fiscal 2000 was another year of record financial results for The Pantry. We are particularly proud of our
performance in light of the challenging environment in which we operated during the past year. By all
accounts, fiscal 2000 was among the most difficult years faced by the convenience store industry. Unprece-
dented increases in the wholesale price of gasoline created significant volatility in the gasoline market and,
as a result, greatly impacted gasoline demand, a major growth driver in our business. Nevertheless, we
maintained a focused approach to managing these conditions and worked diligently to achieve strategic
growth throughout our business as we leveraged our growing retail network to enhance our performance
and continued to strengthen our presence in the Southeastern United States. In fiscal 2000, we:
• Reported record revenues and net income, which grew 44.9% and 34.4%, respectively, over the previous year.
• Achieved a 33.3% increase in gasoline gross profits over last year, despite considerably higher wholesale costs
throughout fiscal 2000.
• Added 145 new stores, reinforcing our leadership position throughout the Southeastern U.S.
• Expanded our reach into Mississippi through the acquisition of 37 convenience stores in that market.
• Completed the two-year rollout of our new corporate and store level accounting and management reporting systems,
which have enhanced our ability to manage our business and immediately bring newly acquired locations online.
We are confident that these achievements, and the initiatives we have taken throughout the year, will allow
us to continue to deliver record results as we implement our core strategy of expanding our retail network
throughout the Southeast and gaining even greater “Strength Through Strategic Acquisitions.”
Financial Performance
Total revenues for 2000 increased by 44.9% to $2.4 billion from $1.7 billion in 1999. Earnings before
interest, taxes, depreciation and amortization (EBITDA) increased by 22.3% to $132.1 million versus $108.1
million in 1999.
Net income for the year ended September 28, 2000 increased 34.4% to $14 million compared to $10.4 million
in fiscal 1999, which included a $3.6 million extraordinary loss related to a debt restructuring. Earnings per
diluted share for fiscal 2000 were $0.74 versus $0.41 in 1999. Fiscal 2000 contained 52 weeks of operating
results compared with 53 weeks in fiscal 1999.
Our record results continue to reflect our focused approach to merchandising and our ongoing efforts to
manage the balance between gasoline gross profit and gallon volume. Merchandise gross profit margin
increased to 33.6% in fiscal 2000 from 33.1% in 1999. Merchandise sales rose 24.0% to $907.6 million, with
merchandise comparable-store sales up 7.5% for the year. Gasoline sales increased by 62.1% to $1.5 billion
and gasoline gross profit rose 33.3% to $139.9 million despite substantially higher wholesale gasoline costs.
There was, however, a modest decline of 2.4% in comparable-store gallon sales, resulting from instability
and dramatic price increases in the gasoline market throughout the year.
Executing Our Strategy
In fiscal 2000, we executed an aggressive growth strategy aimed at expanding our presence in our existing
markets and extending our reach into contiguous markets in the Southeast. During the year, our selective
acquisition strategy continued to drive our growth and further allowed us to capitalize on ongoing consoli-
dation in the convenience store industry. Throughout the year, we focused on identifying stores located in
desirable areas with proven track records of high-volume sales. As a result, we successfully completed 18
acquisitions that added 143 stores to our retail network. These acquisitions strongly enhanced our presence
in our existing markets, particularly in North Carolina, South Carolina, Virginia, Florida and Georgia. Among
these were the addition of 49 Kangaroo stores in Georgia and 14 MiniMart stores in South Carolina. In addi-
tion, the acquisition of 19 Big K stores and 17 Metro Petroleum stores allowed us to enter and establish a
strong foothold in the Mississippi market. The success of our acquisition program lies in our continued ability
to quickly and effectively integrate new locations into our profitable network of stores. In fiscal 2000, we
leveraged our recently rolled-out corporate and management reporting system to integrate all new stores
into our system on the first day of the acquisition.
2
5. “We are confident that these achievements, and the
initiatives we have taken throughout the year, will allow
us to continue to deliver record results as we implement
our core strategy of expanding our retail network throughout
the Southeast and gaining even greater ‘Strength Through
Strategic Acquisitions’.”
Throughout the year, The Pantry also focused on increasing
sales and enhancing profitability in our existing stores. To
this end, we offered our customers the broadest range
of competitively priced merchandise of any convenience
store chain in the Southeast, further improved our
ability to track inventory levels and adopted a more
focused approach to merchandise item selections for
store-specific locations. We are pleased with the results
of these programs and confident that we will increase
our same-store sales as we go forward. We have also
increased our fresh food offerings, quick-serve restaurants
and car wash locations in selected markets. These value-
added services, along with our broad selection of other ancil-
Peter J. Sodini lary services, including ATM’s, pay telephones and money orders
continue to help drive store traffic and enhance the bottom line.
Upgrading our stores was another priority in fiscal 2000. We spent approximately $24.5 million on our
remodeling and conversion program in fiscal 2000. A new prototype for our remodeling has been put in
place. We are focused on phasing out smaller units throughout our network, in favor of larger and more
efficient stores, and we continue to upgrade our fueling locations with Multi-Product Dispensers (MPD)
and pay-at-the-pump credit card readers. Fiscal 2000 also marks the rollout of our new corporate and store-
level accounting and management reporting system. The completion of this two-year program has already
begun to significantly enhance our reporting and monitoring capabilities as well as our overall performance.
Looking Ahead
Going forward, we will continue to derive our “Strength through Strategic Acquisitions.” We will identify
and evaluate potential acquisition candidates that we believe can further strengthen our position in existing
markets and expand our reach into other fast growing markets in the Southeast. In the first quarter of fiscal
2001, we have already completed the acquisition of 28 stores, which has further strengthened our presence
in Mississippi and allowed us to enter the Louisiana market for the first time. Further, growth prospects in
our industry remain strong and we are well positioned to take advantage of important opportunities as they
arise. By leveraging our growing store network and our experience in effectively integrating newly acquired
stores, we expect to add approximately 150 new locations in the year ahead. In doing so, we remain focused
on providing convenience and ensuring that our customers have access to the highest quality and selection
of products, both in our stores, and at our pumps.
In conclusion, we would like to take this opportunity to acknowledge the hard work and dedication of our
employees. It is their continued commitment that allows us to enhance our performance and our results year
after year. At this time, we would also like to thank our customers and shareholders for their support. As we
enter fiscal 2001, we look forward to another year of record results. We will report to you on our progress
throughout the year.
Sincerely,
Peter J. Sodini
President and Chief Executive Officer
3
6. strength through strategic acquisitions
In fiscal 2000, The Pantry maintained a sharp focus on strengthening its position in its principal markets
and expanding its operations into contiguous markets. In doing so, the Company pursued an aggres-
sive acquisition strategy and selectively developed new locations in high-growth areas. As a result,
The Pantry added 145 stores to its growing network, which now includes 1,313 stores throughout the
Southeastern United States.
The Company views acquisitions as the most cost-effective and expedient way to achieve rapid growth
in the competitive convenience store industry. This strategy not only provides The Pantry with stores that
have already been established, but also allows the Company to gain access to locations with a proven
track record of high-volume sales. In implementing this strategy, the Company worked diligently to
identify suitable acquisition candidates. The Pantry targeted well-known regional convenience store
chains that would complement its profitable network of stores and help it to further enhance the bottom
line. In fiscal 2000, The Pantry successfully completed 18 transactions and acquired 143 new stores in
states such as North Carolina, South Carolina, Florida, Georgia, Virginia, and most recently, Mississippi.
Among these acquisitions was the addition of 14 stores operating under the MiniMart
trade name. With the addition of these stores, the Company is now operating 251 stores
in South Carolina, making it the single largest convenience store operator in that state.
In fiscal 2000, The Pantry also acquired 49 Kangaroo stores in Georgia. This acquisition
has allowed the Company to significantly strengthen its presence in that market. Having
entered the Georgia market only one year ago, the Company is pleased with the progress
it has made over the past year in expanding its position there.
Another priority for the Company in fiscal 2000 was continued growth in
contiguous markets. As a result, The Pantry made two key acquisitions, which
allowed it to make inroads into Mississippi. Through the addition of 19 Big K
stores and 17 Metro Petroleum stores, The Pantry is now poised to gain a
significant share of this market.
It is the Company’s aggressive growth strategy, and its ability to successfully
integrate these newly acquired locations, that has allowed The Pantry to achieve
record financial results, as reflected by increases of 44.9% in revenues and 34.4% in net
income for the year.
4
7. The Pantry’s broad selection of products and services, including the leading brands of soft drinks and complementary
snack foods, make the Company’s locations convenient one-stop shops for its customers.
real selection
Going forward, the Company remains committed to increasing its store base in important markets
throughout the Southeast. The Pantry is well positioned to take advantage of continued fragmenta-
tion in the convenience store industry as well as opportunities to acquire complementary store
locations as they arise. During the first quarter of fiscal 2001, the Company has already completed
an important acquisition, in line with its strategy of expanding its presence in principal markets
and establishing a leadership position in contiguous markets. The addition of 26 Fast Lane con-
venience stores, with eight of those in Louisiana, marks the Company’s entrance into that state.
The Company anticipates that this, along with other acquisitions currently in the pipeline, will
continue to drive growth as it moves ahead in fiscal 2001.
Providing Convenience
The Pantry’s ongoing success and its ability to continue to deliver record financial performance year after
year is a direct result of the Company’s commitment to providing convenience to its customers, both
in its stores and at its pumps throughout the Southeastern U.S.
In Stores
In fiscal 2000, The Pantry reported an increase of 24.0% and 7.5% in merchandise revenues and
merchandise comparable store sales, respectively. These gains are attributed to the Company’s
ability to provide its customers with the broadest selection of products and services including a
variety of brand name, high-demand goods such as snack foods, soft drinks, coffee, beer and ciga-
rettes. By offering customers these products, and many more, in one location, The Pantry continues to
attract customers looking for quality, service and convenience.
5
8. strength through strategic acquisitions continued
This year, the Company significantly enhanced its merchandising practices in an effort to drive sales and
further strengthen its overall performance. In doing so, The Pantry more closely monitored store performance,
on an individual basis, and worked to ensure that the products and services found at each store reflected
customer demands at specific locations. This process was greatly facilitated by the rollout of the Company’s
new in-store and corporate level management systems. Completed in October 2000, this new system enabled
the Company to more effectively monitor merchandise sales, better control inventory levels, and adjust
merchandise mix on a regular basis. In addition, this system further allowed The Pantry to implement pricing
by geographic area and adjust margins so that it could achieve even greater profitability. The Company’s
success is evident in the merchandise gross margin profit of 33.6%, an increase of 50 basis points over the
previous year.
Further, as part of the Company’s efforts to generate sales, The Pantry also focused on enhancing its
promotional displays. In fiscal 2000, the Company introduced new slat-wall
displays throughout its locations. These displays not only enhance the
visibility of items such as cigarettes, they also prevent their procurement
by underage individuals.
The continued development of The Pantry’s value added ancillary services,
which include lottery operations, money orders, pay telephones, phone cards
and car washes, also boosted the bottom line. In total, these high-margin
products and services accounted for $27.0 million in commission revenues,
net of expenses, in fiscal 2000 versus $23.4 million in fiscal 1999. In addition,
the Company continues to add food service programs and currently has 215
operating including such national brands as Taco Bell, Hardees, Subway,
Blimpie’s and Krystals as well as proprietary delis.
The Company also invested approximately $71.0 million in the remodeling
and conversion of stores over the past four years. These enhancements
included improvements to interior fixtures and equipment for self-service
food and beverages, both interior and exterior lighting, in-store restrooms
for customers and signage. In addition, the Company continued to phase
out smaller units, in favor of expanding larger units with a higher volume
of sales.
As part of The Pantry’s strategy to upgrade its gasoline facilities and provide its customers with even greater
convenience in fueling, the Company continued to automate its operations and extend its Rapid Fuel card
to more of its customers.
technology at work
The Pantry will remain focused on providing its customers with an unsurpassed selection of quality products
and the convenience that they have come to expect in Pantry stores throughout the Southeast. The Company
will continue to closely monitor performance at every store, and work to further leverage the strength and
scope of its growing network to reach more favorable purchasing agreements with key vendors. The Company
is confident that these efforts will allow it to successfully strengthen its performance, while also ensuring the
satisfaction of its customers.
6
9. At The Pump
Fiscal 2000 was a challenging year in The Pantry’s gasoline operations. The crude oil
market was characterized by significant volatility, which was brought on by a number of
factors, including fluctuations in global supply and demand, a decline in domestic fuel
inventories and concerns over domestic refining capacity. Together, these factors resulted
in an unprecedented increase in the wholesale price of gasoline, which impacted the
Company’s performance over the past year.
Nevertheless, The Pantry executed a focused strategy that has helped it to minimize the
effects of price increases on operations and, as a result, allowed the Company to make
significant gains. By effectively managing the balance between gasoline gallon volume
and gasoline gross profit, The Pantry reported total gasoline revenues of $1.5 billion, an
increase of 62.1% over fiscal 1999 results. This increase was driven in part by the signifi-
cant rise in gasoline retail prices, and reflects a $.33 per gallon increase from fiscal 1999
prices. These gains, however, were slightly offset by a 2.4 % decline in gasoline gallon
comparable store sales.
“Despite unprecedented volatility in the crude oil
market, The Pantry successfully reached a balance
between gasoline gallon volume and gasoline gross
profit, allowing it to continue to attract customers
and maintain a high volume of traffic at its pumps.”
Also critical to the Company’s success during this volatile period was its ability to attract customers and
maintain a high volume of traffic at its pumps. To this end, the Company implemented several important
initiatives including the expansion of its Rapid Fuel Card program. In fiscal 2000, The Pantry added approxi-
mately 300 new accounts and expects a greater number of its customers to sign on in the year ahead.
The Pantry also continued to concentrate on providing customers with convenience and quality products and
services at all of its fueling locations. Significant investments were made in technological advancements at
the Company’s pumps. Today, Multi-Product Dispensers (MPD) have been installed at 86% of The Pantry’s
fueling locations, and pay-at-the-pump credit card readers can be found at 75% of the Company’s pumps.
In making these improvements, the Company effectively leveraged its strong gasoline sales volumes and
its relationships with oil companies to implement upgrades in a cost-effective manner. As a result, it has
received $7.8 million in reimbursements for these upgrades from its major gasoline suppliers in fiscal 2000.
7
10. strength through strategic acquisitions continued
Investing in Growth
Over the past two years, The Pantry invested approximately $10 million to develop a state-of-the-art
management information system. As previously noted, fiscal 2000 marked the rollout of the Company’s
new corporate and store level accounting and management reporting systems, which have now been
implemented in all of The Pantry’s stores.
This system has greatly improved the overall efficiency of operational and accounting procedures at the
store level and in the Company’s accounting departments. Data consistency and accuracy has also been
significantly enhanced. The Company is now able to utilize data on gallon and merchandise volumes,
on a daily basis, to adjust margins and better manage and track total store gross profit. In addition, the
implementation of this system has also allowed The Pantry to continue its strategic goal of integrating
all newly acquired locations into the system on the first day of the acquisition.
At the same time, the Company has continued to expand its computer systems infrastructure and networking
between administrative offices and stores and has established a centralized Help Desk to support its rapidly
expanding network. These systems include an enterprise-wide email system, which has facilitated commu-
nication, and a food service system that has helped to improve controls and more rapid identification of
inventory opportunities in this growing segment of the Company’s business.
The Pantry plans to continue to expand the use of these new systems in the year ahead by adding additional
features that can provide further enhancements and efficiencies to its operations. Particular emphasis will
be placed on the development and strengthening of systems that will help the Company to more closely
monitor and optimize gross profit at each of its stores.
8
11. The Pantry, Inc. Annual Report 2000
selected financial data
The following table sets forth historical consolidated financial data and store operating data for the periods indicated. The
selected historical annual consolidated financial data is derived from, and is qualified in its entirety by, our annual Consolidated
Financial Statements, including those contained elsewhere in this report. The information should be read in conjunction with
“Management’s Discussion and Analysis of Financial Condition and Results of Operations,” the Consolidated Financial
Statements and related notes thereto included elsewhere in this report. In the table, dollars are in millions, except per store
and per gallon data.
September 30, September 24, September 25, September 26,
September 28,
1999 1998 1997 1996
2000
STATEMENT OF OPERATIONS DATA:
Revenues:
Merchandise sales $ 731.7 $ 460.8 $ 202.4 $ 188.1
$ 907.6
Gasoline sales 923.8 510.0 220.2 192.7
1,497.7
Commissions 23.4 14.1 4.8 4.0
27.0
Total revenues 1,678.9 984.9 427.4 384.8
2,432.3
Cost of Sales:
Merchandise 489.3 304.0 132.8 126.0
602.6
Gasoline 818.8 447.6 197.3 167.6
1,357.8
Gross profit 370.8 233.3 97.3 91.2
471.9
Operating, general and administrative expenses 262.9 172.9 77.0 75.6
339.8
Unusual charges — 1.0(g) — 4.6(i)
—
Depreciation and amortization 42.8 27.6 9.5 9.1
56.1
Income from operations 65.2 31.8 10.8 1.9
76.0
Interest expense (41.3) (28.9) (13.0) (12.0)
(52.3)
Income (loss) before other items 24.8 4.7 (1.0) (8.1)
24.8
Extraordinary loss (3.6)(e) (8.0)(h) — —
—
Net income (loss) $ 10.4 $ (3.3) $ (1.0) $ (8.1)
$ 14.0
Net income (loss) applicable to
common shareholders $ 6.2 $ (6.3) $ (6.3) $ (10.8)
$ 14.0
Earnings (loss) per share before extraordinary loss:
Basic $ 0.71 $ (0.18) $ (1.08) $ (1.89)
$ 0.77
Diluted $ 0.65 $ (0.16) $ (1.08) $ (1.89)
$ 0.74
Weighted-average shares outstanding:
Basic 13,768 9,732 5,815 5,688
18,111
Diluted 15,076 11,012 5,815 5,688
18,932
Dividends paid on common stock — — — —
—
OTHER FINANCIAL DATA:
EBITDA(a) $ 108.0 $ 60.5 $ 20.3 $ 15.6
$ 132.1
Net cash provided by (used in):
Operating activities $ 68.6 $ 48.0 $ 7.3 $ 5.4
$ 88.2
Investing activities (228.9) (285.4) (25.1) (7.2)
(148.7)
Financing activities 157.1 268.4 15.8 (3.9)
82.7
Capital expenditures(b) 47.4 42.1 14.7 7.1
56.4
Ratio of earnings to fixed charges(c) 1.4 1.1 — —
1.4
9
12. The Pantry, Inc. Annual Report 2000
selected financial data continued
September 30, September 24, September 25, September 26,
September 28,
1999 1998 1997 1996
2000
STORE OPERATING DATA:
Number of stores (end of period) 1,215 954 390 379
1,313
Average sales per store:
Merchandise sales (in thousands) $ 666.4 $ 533.3 $ 525.8 $ 481.1
$ 713.8
Gasoline gallons (in thousands) 834.8 603.9 501.2 450.0
856.9
Comparable store sales growth(d):
Merchandise 9.6% 5.3% 8.5% 2.8%
7.5%
Gasoline gallons 5.9% 4.8% 7.2% (4.3)%
(2.4)%
OPERATING DATA:
Merchandise gross margin 33.1% 34.0% 34.4% 33.0%
33.6%
Gasoline gallons sold (in millions) 855.7 466.8 179.4 160.7
1,062.4
Average retail gasoline price per gallon $ 1.08 $ 1.09 $ 1.23 $ 1.20
$ 1.41
Average gasoline gross profit per gallon $ 0.123 $ 0.134 $ 0.128 $ 0.156
$ 0.132
Operating, general and administrative expenses
as a percentage of total revenues 15.7% 17.6% 18.0% 19.6%
14.0%
Operating income as a percentage of total revenues 3.9% 3.2% 2.5% 0.5%
3.1%
BALANCE SHEET DATA (END OF PERIOD):
Working capital (deficiency) $ (20.4) $ (9.0) $ (8.2) $ (6.5)
$ (7.7)
Total assets 793.7 554.8 142.8 120.9
930.3
Total debt and capital lease obligations 455.6 340.7 101.3 101.4
541.4
104.2(f )
Shareholders’ equity (deficit) 39.3 (17.9) (27.5)
118.0
(a) “EBITDA” represents income from operations before depreciation and amortization, merger integration costs, restructuring charges, and impairment of
long-lived assets. EBITDA is not a measure of performance under accounting principles generally accepted in the United States of America, and should not
be considered as a substitute for net income, cash flows from operating activities and other income or cash flow statement data prepared in accordance
with accounting principles generally accepted in the United States of America, or as a measure of profitability or liquidity. We have included information
concerning EBITDA as one measure of our ability to service debt and because we believe investors find this information useful. EBITDA as defined herein
may not be comparable to similarly titled measures reported by other companies.
(b) Purchases of assets to be held for sale are excluded from these amounts.
(c) For purposes of determining the ratio of earnings to fixed charges: (i) earnings consist of income (loss) before income tax benefit (expense) and extra-
ordinary item plus fixed charges and (ii) fixed charges consist of interest expense, amortization of deferred financing costs, preferred stock dividends and
the portion of rental expense representative of interest (deemed to be one-third of rental expense). Our earnings were inadequate to cover fixed charges
by $14.3 million, and $6.3 million for fiscal years 1996 and 1997, respectively.
(d) The stores included in calculating comparable store sales growth are stores that were under management and in operation for both fiscal years of the
comparable period; therefore, acquired stores, new stores and closed stores are not included.
(e) On January 28, 1999, we redeemed $49.0 million in principal amount of our senior notes and paid accrued and unpaid interest up to, but not including,
the date of purchase and a 4% call premium. We recognized an extraordinary loss of approximately $3.6 million in connection with the repurchase of the
senior notes including the payment of the 4% call premium of $2.0 million, fees paid in connection with the amendments and commitments under our bank
credit facility, and the write-off of deferred financing costs related to our repayment of our former bank credit facility.
(f) On June 8, 1999, we offered and sold 6,250,000 shares of our common stock in our initial public offering. The initial offering price was $13.00 per share
and we received $75.6 million in net proceeds, before expenses.
(g) During fiscal 1998, we recorded an integration charge of approximately $1.0 million for costs of combining our existing business with the acquired
business of Lil’ Champ.
(h) On October 23, 1997 in connection with the Lil’ Champ acquisition, we completed the offering of our senior subordinated notes and, in a related trans-
action completed a tender offer and consent solicitation with respect to our senior notes. The tender offer resulted in our purchasing $51 million in principal
amount of the senior notes at a purchase price of 110% of the aggregate principal amount plus accrued and unpaid interest and other related fees. In con-
nection with this repurchase, we incurred an extraordinary loss of approximately $8.0 million related to cost of the tender offer and consent solicitation and
write-off of deferred financing costs.
(i) During fiscal 1996, we recorded restructuring charges of $1.6 million pursuant to a formal plan to restructure our corporate offices. Also during fiscal 1996,
we early-adopted SFAS No. 121, Accounting for the Impairment of Long- Lived Assets and for Long-Lived Assets to be Disposed of. In addition, pursuant to
SFAS No. 121, we evaluated our long-lived assets for impairment on a store-by-store basis. Based on this evaluation, we recorded an impairment loss of
$0.4 million for property and equipment and $2.6 million for goodwill.
10
13. The Pantry, Inc. Annual Report 2000
m a n a g e m e n t ’s d i s c u s s i o n a n d a n a l y s i s
of financial condition and results of operations
The following discussion and analysis is provided to increase During fiscal 2000, we completed the installation of a lead-
understanding of, and should be read in conjunction with, ing, industry-specific retail information system across our
the Consolidated Financial Statements and accompanying entire network of stores. This technology provides field
notes. Additional discussion and analysis related to fiscal and corporate management with on-line communication
year 2000 is contained in our Quarterly Reports on Form tools and daily access to relevant operating information.
10-Q and 10-Q/A, Current Reports on Form 8-K and 8-K/A We expect this technology will improve store-level execution
and our Registration Statement on Form S-1, as amended. of our merchandising programs, improve inventory manage-
ment and other operating controls, and increase the overall
Introduction service to our customers. We have also developed proprietary
modeling systems to track location specific gasoline pricing
Fiscal 2000 was a historic year for The Pantry as we com-
decisions and their impact on key trends and performance
pleted our first full fiscal year as a public company while
factors such as gasoline volume, merchandise volume, and
recording record results of operations. We realized record
total unit gross profit.
revenues, operating profits, and net income in the midst of a
On the services front, we continue to maintain a fresh and
challenging gasoline environment. Our revenues increased
open approach to convenience and certain services that
44.9% to $2.4 billion and EBITDA increased 22.3% to $132.1
appeal to our customers. We are constantly reviewing oppor-
million. We earned record net income of $14.0 million in fis-
tunities to get the most out of our growing retail network—
cal 2000 compared to $10.4 million in fiscal 1999. Fiscal 1999
now at more than 1,300 stores located in 9 southeastern
net income included an extraordinary loss of $3.6 million,
states. We have focused our attention on increasing ancillary
net of taxes, associated with the refinancing of our senior
revenues such as lottery commissions, money order sales,
notes and credit facilities.
telephone income, selected on-site advertising commission,
These record operating results were the result of:
phone cards, prepaid cellular services, vending income, car
• increased sales and earnings associated with acquired
wash offerings and other service revenues.
stores,
Finally, we plan to continue to sensibly acquire premium
• same store merchandise sales and earnings growth,
chains located in our existing and contiguous markets. We
• higher merchandise gross margin and gasoline gross
believe these markets have strong demographic and eco-
profit per gallon,
nomic growth profiles and are pleased with the quantity
• our ability to manage the balance between total unit
and quality of acquisition candidates particularly those
gross profit and gasoline gallon volume, and
located in Mississippi and Louisiana, both new and attrac-
• the absence of any extraordinary charges.
tive retail markets. In fiscal 2001, we anticipate increasing
We believe our results continue to be driven by three key
our net store count by 100 to 150 stores. This includes stores
operating principles:
to be acquired in fiscal 2001, a small number of newly
• the consistent execution of our core strategies, including
constructed stores in high growth areas and the closing
focused attention on leveraging the quality and quantity
of certain underperforming stores.
of our growing retail network,
• our research and investment in new programs, particu-
Acquisition History
larly in the services sector, and
• sensible store growth in existing and contiguous markets. Our acquisition strategy focuses on acquiring convenience
stores within or contiguous to our existing market areas.
We believe our growing retail network, merchandise pro-
We believe acquiring locations with demonstrated operating
grams, purchasing leverage and in-store execution will
results involves lower risk and is generally an economically
continue to drive merchandise comparable store sales and
attractive alternative to traditional site selection and new
support stable merchandise margins. We have focused a lot
store development. We do, however, plan to develop new
of attention and resources on upgrading locations with the
locations in high growth areas within our existing markets.
latest gasoline pump technology and designing site plans
to drive customer traffic.
11
14. The Pantry, Inc. Annual Report 2000
m a n a g e m e n t ’s d i s c u s s i o n a n d a n a l y s i s
of financial condition and results of operations continued
The tables below provide information concerning the acquisitions we have completed during the last three fiscal years:
Fiscal 2000 Acquisitions
Date Acquired Trade Name Locations Stores
September 14, 2000 Food Mart Mississippi 18
July 3, 2000 Mini Mart South Carolina 14
June 29, 2000 Big K Mississippi 19
April 27, 2000 Market Express South Carolina 5
January 27, 2000 On-The-Way North Carolina and Southern Virginia 12
November 11, 1999 Kangaroo Georgia 49
November 4, 1999 Cel Oil Charleston, South Carolina 7
October 7, 1999 Wicker Mart North Carolina 7
Others (less than five stores) Various Florida, North Carolina, Virginia, Mississippi and South Carolina 12
Total 143
Fiscal 1999 Acquisitions
Date Acquired Trade Name Locations Stores
July 22, 1999 Depot Food South Carolina and Northern Georgia 53
July 8, 1999 Food Chief Eastern South Carolina 29
February 25, 1999 ETNA North Carolina and Virginia 60
January 28, 1999 Handy Way North Central Florida 121
November 5, 1998 Express Stop Southeast North Carolina and Eastern South Carolina 22
October 22, 1998 Dash-N East Central North Carolina 10
Others (less than five stores) Various North Carolina and South Carolina 2
Total 297
Fiscal 1998 Acquisitions
Date Acquired Trade Name Locations Stores
July 15, 1998 Zip Mart Central North Carolina and Virginia 42
July 2, 1998 Quick Stop Southeast North Carolina and Coastal South Carolina 75
May 2, 1998 Sprint Gainesville, Florida 10
March 19, 1998 Kwik Mart Eastern North Carolina 23
October 23, 1997 Lil’ Champ Northeastern Florida 440(a)
Others (less than five stores) Various North Carolina and South Carolina 13
Total 603
(a) Net of the disposition of 48 convenience stores located throughout eastern Georgia.
Subsequent to September 28, 2000, we have entered into Impact of Acquisitions. These acquisitions and the related
agreements to acquire 28 stores located in Mississippi (19), transactions have had a significant impact on our financial
Louisiana (8) and North Carolina (1) in three separate trans- condition and results of operations since each of their
actions. These transactions will be primarily funded from respective transaction dates. Due to the method of account-
borrowings under our bank credit facility and cash on hand. ing for these acquisitions, the Consolidated Statements of
Operations for the fiscal years presented include results of
We seek to improve the productivity and profitability of
operations for each of the acquisitions from the date of each
acquired stores by implementing our merchandising and
acquisition only. For fiscal 2000 acquisitions, the Consolidated
gasoline initiatives, eliminating duplicative costs, reducing
Balance Sheets as of September 30, 1999 and the Consoli-
overhead and centralizing functions such as purchasing and
dated Statements of Operations for fiscal years September
information technology. We believe it takes six to twelve
30, 1999 and September 24, 1998 do not include the assets,
months to fully integrate and achieve operational and finan-
liabilities, and results of operations relating to these acqui-
cial improvements at acquired locations. There can be no
sitions. As a result, comparisons of fiscal 2000 results to such
assurance, however, that we can achieve revenue increases
prior fiscal years are impacted materially and the underlying
or cost savings with respect to any acquisition.
performance of same store results is obscured.
12
15. The Pantry, Inc. Annual Report 2000
Results of Operations factors in selected markets such as Tampa and Orlando.
Demand has been influenced by higher gasoline retail prices
Fiscal 2000 Compared to Fiscal 1999 as a result of wholesale gasoline cost increases and our
efforts to manage the balance between gasoline gross profit
We operate on a 52 or 53-week fiscal year. Our operations for
and gallon volume.
fiscal 2000 contained 52 weeks while fiscal 1999 contained 53
weeks or an additional week. When we make references to fiscal Commission Revenue. Total commission revenue for fiscal
1999 adjusted for the number of weeks, we have simply adjusted 2000 was $27.0 million compared to $23.4 million for fiscal
last year’s fourth quarter results to approximate a 13-week period. 1999, an increase of $3.6 million or 15.4%. The increase in
commission revenue is primarily due to revenue from stores
Total Revenue. Total revenue for fiscal 2000 was $2.4 billion
acquired in fiscal 2000 of $2.6 million, the effect of a full
compared to $1.7 billion for fiscal 1999, an increase of $753.4
year of commission revenue from 1999 acquisitions of $3.6
million or 44.9%. The increase in total revenue is primarily
million and comparable store commission revenue growth.
due to the revenue from stores acquired in fiscal 2000 of
These increases were partially offset by the loss of video
$217.6 million, the effect of a full year of revenue from fiscal
poker revenue in the State of South Carolina as of July 1,
1999 acquisitions of $290.9 million, and comparable store
2000. As a result, video poker commission in fiscal 2000
merchandise sales growth of 7.5%. Comparable store mer-
decreased 35.5% to $4.0 from $6.2 in fiscal 1999.
chandise sales increases at our locations are primarily due
to increased customer counts and average transaction size Total Gross Profit. Total gross profit for fiscal 2000 was
resulting from more competitive gasoline pricing, enhanced $471.9 million compared to $370.8 million for fiscal 1999,
store appearance and store merchandising, and increased an increase of $101.1 million or 27.3%. The increase in
in-store promotional activity. Adjusting for the number of gross profit is primarily due to the gross profit from stores
weeks in fiscal 1999, the increase in total revenues was 48.3%. acquired in fiscal 2000 of $37.4 million, the effect of a full
year of operations from stores acquired in 1999 of $51.9
Merchandise Revenue. Total merchandise revenue for fiscal
million and higher merchandise and gasoline margins.
2000 was $907.6 million compared to $731.7 million for fiscal
Adjusting for the number of weeks in fiscal 1999, the
1999, an increase of $175.9 million or 24.0%. The increase
increase in total gross profit was 30.1%.
in merchandise revenue is primarily due to the revenue from
stores acquired in fiscal 2000 of $68.6 million, the effect of Merchandise Gross Margin. Fiscal 2000 merchandise gross
a full year of merchandise revenue from fiscal 1999 acquisi- margin was 33.6%, a 50 basis point increase over fiscal 1999.
tions of $90.1 million, and comparable store merchandise The increase was primarily due to margin improvements
sales growth of 7.5% or an increase of approximately $42.3 in selected categories and an increase in food service sales,
million. Adjusting for the number of weeks in fiscal 1999, which earn higher gross margin percentages.
the increase in merchandise revenues was 26.9%.
Gasoline Gross Profit Per Gallon. Gasoline gross profit per
Gasoline Revenue and Gallons. Total gasoline revenue for gallon increased to $0.132 in fiscal 2000 from $0.123 in fiscal
fiscal 2000 was $1.5 billion compared to $923.8 million for 1999 primarily due to our efforts to manage the balance
fiscal 1999, an increase of $573.9 million or 62.1%. The between gasoline gallon volume and gasoline gross profit
increase in gasoline revenue is primarily due to the revenue per gallon. During fiscal 2000, we experienced a volatile
from stores acquired in fiscal 2000 of $146.4 million, the wholesale gasoline market due to many factors, including
effect of a full year of gasoline revenue from fiscal 1999 world crude supply and demand fundamentals, domestic
acquisitions of $197.2 million, and the impact of raising fuel inventories, and domestic refining capacity. Due to this
gasoline retail prices. In fiscal 2000, our average retail price volatility, our margin per gallon sold on a quarterly basis
of gasoline was $1.41 per gallon, which represents a $.33 ranged from a low of $0.101 in our second quarter to a high
per gallon increase from fiscal 1999. These increases were of $0.153 in our fourth quarter of fiscal 2000.
partially offset by a gasoline gallon comparable store sales
Operating, General and Administrative Expenses. Operating
decline of 2.4%.
expenses for fiscal 2000 were $339.8 million compared to
In fiscal 2000, total gasoline gallons were 1.1 billion gallons $262.9 million for fiscal 1999, an increase of $76.9 million
compared to 855.7 million gallons in fiscal 1999, an increase or 29.3%. The increase in operating expenses is primarily
of 206.7 million gallons or 24.2%. The increase in gasoline due to the operating and lease expenses associated with the
gallons is primarily due to gallon volume of 106.1 million stores acquired in fiscal 2000 of $26.1 million, the effect of
from stores acquired in fiscal 2000, the effect of a full year a full year of expenses for stores acquired in fiscal 1999 of
of gasoline volume from 1999 acquisitions of 151.3 million $38.3 million, as well as an increase in general corporate
offset by comparable store gasoline volume decreases of expenses associated with our store growth initiatives. As a
2.4% or a decrease of approximately 14.9 million gallons. percentage of total revenue, operating, general and adminis-
The fiscal 2000 same store gallon decline was primarily due trative expenses decreased to 14.0% in fiscal 2000 from
to lower demand coupled with heightened competitive 15.7% in fiscal 1999.
13
16. The Pantry, Inc. Annual Report 2000
m a n a g e m e n t ’s d i s c u s s i o n a n d a n a l y s i s
of financial condition and results of operations continued
Income from Operations. Income from operations for fiscal Fiscal 1999 Compared to Fiscal 1998
2000 was $76.0 million compared to $65.2 million for fiscal
Our operations for fiscal 1999 contained 53 weeks while fiscal
1999, an increase of $10.9 million or 16.7%. The increase is
1998 contained 52. When we make references to the effect of an
primarily due to the items discussed above. As a percentage
extra week in fiscal 1999, we have simply calculated the impact
of total revenue, income from operations decreased to 3.1%
of the additional week in fiscal 1999.
in fiscal 2000 from 3.9% in fiscal 1999.
Total Revenue. Total revenue for fiscal 1999 was $1.7 billion
EBITDA. EBITDA represents income from operations
compared to $984.9 million for fiscal 1998, an increase of
before depreciation and amortization, merger integration
$694.0 million or 70.5%. The increase in total revenue is
costs, and extraordinary loss. EBITDA for fiscal 2000 was
primarily due to the revenue from stores acquired in fiscal
$132.1 million compared to $108.0 million for fiscal 1999, an
1999 of $346.4 million, the effect of a full year of revenue
increase of $24.1 million or 22.3%. The increase is primarily
from fiscal 1998 acquisitions of $259.9 million, and compara-
due to the items discussed above.
ble store revenue growth of 6.9% or approximately $29.3
EBITDA is not a measure of performance under accounting million. Also, the effect of an extra week in fiscal 1999 con-
principles generally accepted in the United States of America, tributed $39.4 million or 5.7% of the increase. Comparable
and should not be considered as a substitute for net income, store sales increases at our locations are primarily due to
cash flows from operating activities and other income or increased customer counts and average transaction size
cash flow statement data prepared in accordance with resulting from more competitive gasoline pricing, enhanced
accounting principles generally accepted in the United store appearance and store merchandising, and increased
States of America, or as a measure of profitability or liquid- in-store promotional activity.
ity. We have included information concerning EBITDA as
Merchandise Revenue. Total merchandise revenue for fiscal
one measure of our cash flow and historical ability to service
1999 was $731.7 million compared to $460.8 million for fiscal
debt and because we believe investors find this information
1998, an increase of $270.9 million or 58.8%. The increase in
useful. EBITDA as defined herein may not be comparable to
merchandise revenue is primarily due to the revenue from
similarly titled measures reported by other companies.
stores acquired in fiscal 1999 of $133.8 million, the effect of
a full year of merchandise revenue from fiscal 1998 acquisi-
Interest Expense (see—”Liquidity and Capital Resources—Long-
Term Debt”). Interest expense in fiscal 2000 was $52.3 mil- tions of $92.7 million, and comparable store sales growth
lion compared to $41.3 million for fiscal 1999, an increase of 9.6% or approximately $20.3 million. Based on purchase
of $11.0 million or 26.8%. In fiscal 2000, interest expense and sales information, we estimate that cigarette inflation
was primarily related to interest costs on (i) our senior during fiscal year 1999 accounted for 3% to 4% of the 9.6%
subordinated notes of $20.5 million and (ii) our bank credit increase in comparable store sales. Also, the effect of an
facility of approximately $30.4 million. The increase in inter- extra week in fiscal 1999 contributed $16.3 million.
est expense was primarily due to increased borrowings
Gasoline Revenue and Gallons. Total gasoline revenue for
associated with our acquisition activity and a general rise
fiscal 1999 was $923.8 million compared to $510.0 million
in interest rates.
for fiscal 1998, an increase of $413.8 million or 81.1%. The
Income Tax Expense. Our effective income tax rate for fiscal increase in gasoline revenue is primarily due to the revenue
2000 was 43.5%. Our effective tax rate is negatively impacted from stores acquired in fiscal 1999 of $208.2 million, the
by non-deductible goodwill related to certain acquisitions effect of a full year of gasoline revenue from fiscal 1998
and other permanent book-tax differences. acquisitions of $165.2 million, and comparable store gasoline
revenue growth of 3.8% or approximately $7.9 million. Also,
Net Income. Net income for fiscal 2000 was $14.0 million
the effect of an extra week in fiscal 1999 contributed $22.3
compared to net income of $10.4 million for fiscal 1999, an
million. In fiscal 1999, our average retail price of gasoline
increase of $3.6 million or 34.4%. The increase is primarily
was $1.08, which represents a $.01 decrease from fiscal 1998.
due to the absence of any extraordinary charges in fiscal
2000 as compared to fiscal 1999, which had an extraordinary In fiscal 1999, total gasoline gallons were 855.7 million gallons
loss of $3.6 million associated with certain debt restructuring compared to 466.8 million gallons in fiscal 1998, an increase
activity. Adjusting for the number of weeks in fiscal 1999 of 388.9 million gallons or 83.3%. The increase in gasoline
and excluding the fiscal 1999 extraordinary loss, the increase gallons is primarily due to gallon volume of 189.4 million
in net income in fiscal 2000 was 4.0%. from stores acquired in fiscal 1999, the effect of a full year of
14
17. The Pantry, Inc. Annual Report 2000
Income from Operations. Income from operations for fiscal
gasoline volume from fiscal 1998 acquisitions of 163.2 mil-
1999 was $65.2 million compared to $31.8 million for fiscal
lion and comparable store gasoline volume increases of 5.9%
1998, an increase of $33.3 million or 104.7%. The increase is
or approximately 11.6 million gallons. Also, the effect of an
primarily due to the items discussed above. As a percentage
extra week in fiscal 1999 contributed 18.8 million gallons.
of total revenue, income from operations increased to 3.9%
Fiscal 1999 same store gallon sales growth was 5.9% and is
in fiscal 1999 from 3.2% in fiscal 1998.
primarily due to more competitive gasoline pricing, rebrand-
ing and promotional activity, enhanced store appearance
EBITDA. EBITDA for fiscal 1999 was $108.0 million com-
and local market and economic conditions.
pared to $60.5 million for fiscal 1998, an increase of $47.5
million or 78.5%. The increase is primarily due to the items
Commission Revenue. Total commission revenue for fiscal
discussed above.
1999 was $23.4 million compared to $14.1 million for fiscal
1998, an increase of $9.3 million or 65.6%. The increase in
Interest Expense (see—”Liquidity and Capital Resources—Long-
commission revenue is primarily due to revenue from stores
Term Debt”). Interest expense in fiscal 1999 was $41.3 mil-
acquired in fiscal 1999 of $4.4 million, the effect of a full year
lion compared to $28.9 million for fiscal 1998, an increase of
of commission revenue from fiscal 1998 acquisitions of $2.0
$12.3 million or 42.6%. Interest expense is primarily related
million and comparable store commission revenue growth
to interest costs on (i) our senior subordinated notes of $21.9
of 18.7% or $1.1 million. The effect of an extra week in fiscal
million, (ii) our bank credit facility of approximately $16.6
1999 contributed $0.4 million.
million and (iii) our senior notes of $2.0 million which was
partially offset by $1.1 million in interest savings related to
Total Gross Profit. Total gross profit for fiscal 1999 was
the redemption and refinancing of $49.0 million in principal
$370.8 million compared to $233.4 million for fiscal 1998,
amount of the senior notes.
an increase of $137.5 million or 58.9%. The increase in
gross profit is primarily due to the gross profit from stores
Income Tax Expense. Our effective income tax rate for fiscal
acquired in fiscal 1999 of $72.1 million, the effect of a full
1999 was 43.4%. Our effective income tax rate is negatively
year of operations from stores acquired in fiscal 1998 of
impacted by non-deductible goodwill related to acquisitions
$50.7 million and the effect of an extra week in fiscal 1999
and other permanent book/tax differences.
of $8.2 million.
Extraordinary Loss. We recognized an extraordinary loss,
Merchandise Gross Margin. Merchandise gross margin in
net of taxes, of approximately $3.6 million in fiscal 1999 in
fiscal 1999 remained relatively constant compared to fiscal
connection with the redemption of the remaining outstand-
1998, decreasing only 90 basis points despite significant
ing balance of our senior notes and the related consent fees.
cost inflation in the tobacco category in fiscal 1999.
The extraordinary item includes the payment of the 4% call
See “—Inflation.”
premium of $2.0 million and the write-off of related deferred
financing costs on our senior notes and former credit facility.
Gasoline Gross Profit Per Gallon. Gasoline gross profit per
The extraordinary item also reflects an income tax benefit
gallon decreased to $0.123 in fiscal 1999 from $0.134 in fiscal
of approximately $2.3 million.
1998 primarily due to rising crude oil prices, the impact of
rising crude oil prices on wholesale fuels costs, and lower
Net Income. Net income for fiscal 1999 was $10.4 million
average margin in acquired locations.
compared to a net loss of $3.3 million for fiscal 1998, an
increase of $13.7 million or 413.3%. The increase is primarily
Operating, General and Administrative Expenses. Operating,
due to results from acquired stores, improved results from
general and administrative expenses for fiscal 1999 were
operations, and the lower extraordinary charges related to
$262.9 million compared to $172.9 million for fiscal 1998,
redemption and refinancing activities. Our income before
an increase of $90.0 million or 52.1%. The increase in store
extraordinary loss was $14.0 million for fiscal 1999 compared
expenses is primarily due to the operating and lease expenses
to $4.7 million during fiscal 1998, an increase of $9.3 million
associated with stores acquired in fiscal 1999 of $47.9 mil-
or a 200% increase. Pursuant to Emerging Issues Task Force
lion, the effect of a full year of expenses for stores acquired
Topic No. (“EITF”) D-42, in connection with our redemption
in fiscal 1998 of $29.9 million, the effect of an extra week
of our preferred stock in our third fiscal quarter, we were
of operations in fiscal 1999 of $3.8 million, as well as an
required to recognize a one-time deduction to net income
increase in general corporate expenses associated with our
applicable to common stockholders (and a related reclassifi-
store growth initiative. As a percentage of total revenue,
cation to accumulated deficit) in the amount of $1,500,000
operating, general and administrative expenses decreased
associated with original issue costs incurred in connection
to 15.7% in fiscal 1999 from 17.6% in fiscal 1998.
15