1. OPERATING HIGHLIGHTS
FINANCIAL DISCUSSION
We significantly expanded our healthcare offerings by acquiring
EXECUTIVE SUMMARY Microtek Medical Holdings, Inc., a manufacturer and marketer
This Financial Discussion should be read in conjunction with the of infection control products for healthcare and acute care
information on Forward-Looking Statements and Risk Factors found facilities with annual sales of approximately $150 million in 2007.
at the end of this Financial Discussion.
In 2007 we launched more than 40 new innovative products and
Ecolab continued its trend of exceptionally strong financial services including Apex™, a revolutionary warewashing system,
performance in 2007. It was an outstanding year of growth, a new Hand Hygiene Monitoring Compliance Program for
development and investment for the future. Results for 2007 hospitals and healthcare facilities and the Inspexx® sanitization
marked another year of record sales and earnings and we did system which helps poultry producers save water,
this while continuing to invest in our people and business to drive energy and labor.
our future long-term growth. We demonstrated our commitment
Our legendary service is what sets Ecolab apart. We continued
to building for the future while delivering today. Below are the
to invest in our sales-and-service team adding more than
highlights of another successful year.
650 associates to our global field organization.
We once again exceeded all three of our long-term financial
We completed the management transition in Europe and
objectives:
made significant progress toward transforming the region by
2007 RESULTS LONG-TERM OBJECTIVE committing to establishing a European headquarters in Zurich,
Switzerland and beginning the development of Ecolab Business
EPS Growth 19% 15%
Solution (EBS), an extensive project to implement a common set
ROBE 25% 20% of business processes and systems across all of Europe.
Balance Sheet A Investment Grade
We launched a new business platform for GCS Service that
will allow us to more effectively and efficiently grow the GCS
FINANCIAL PERFORMANCE business and realize its significant market potential.
Consolidated net sales increased 12% reaching a record $5.5
We continued to execute our aggressive stock keeping unit
billion for 2007.
(SKU) reduction initiative, designed to standardize product
offerings, improve operating efficiencies and provide consistent
Operating income increased 9% in 2007 to a record $667
performance for our customers across businesses and around
million, including $20 million of special gains and charges which
the world. To date, we have eliminated nearly 3,000 SKUs.
decreased operating income growth by 3%.
We continue to utilize Lean Six Sigma to improve operational
Diluted net income per share increased 19% to $1.70 per share
performance and efficiency. By applying these tools, we have
for 2007, compared to $1.43 per share in 2006. The 2007 per
achieved a 35% reduction in order entry cycle time, 10%
share amount was favorably impacted by $0.04 per share of
reduction in backorders, 17% improvement in shipment quality
special gains and charges
RETURN ON BEGINNING and 10% increase in shipment size.
and discrete tax benefits.
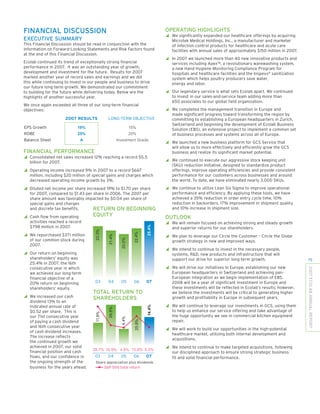
EQUITY OUTLOOK
Cash flow from operating
activities reached a record We will remain focused on achieving strong and steady growth
25.4%
$798 million in 2007. and superior returns for our shareholders.
23.3%
22.4%
We repurchased $371 million
21.4%
We plan to leverage our Circle the Customer – Circle the Globe
20.0%
of our common stock during growth strategy in new and improved ways.
2007.
We intend to continue to invest in the necessary people,
Our return on beginning systems, R&D, new products and infrastructure that will
shareholders’ equity was support our drive for superior long-term growth. 19
25.4% in 2007, the 16th
We will drive our initiatives in Europe, establishing our new
2007 ECOLAB ANNUAL REPORT
consecutive year in which
European headquarters in Switzerland and achieving pan-
we achieved our long-term
European integration as we begin implementation of EBS.
financial objective of a
03 04 07
05 06 2008 will be a year of significant investment in Europe and
20% return on beginning
these investments will be reflected in Ecolab’s results; however,
shareholders’ equity.
TOTAL RETURN TO we believe the investments will be critical to generating higher
We increased our cash SHAREHOLDERS growth and profitability in Europe in subsequent years.
dividend 13% to an
We will continue to leverage our investments in GCS, using them
14.4%
indicated annual rate of
29.5%
to help us enhance our service offering and take advantage of
$0.52 per share. This is
11.8%
the huge opportunity we see in commercial kitchen equipment
our 71st consecutive year
4.4%
25.9%
repair.
of paying a cash dividend
and 16th consecutive year
We will work to build our opportunities in the high-potential
of cash dividend increases.
healthcare market, utilizing both internal development and
The increase reflects
acquisitions.
the continued growth we
achieved in 2007, our solid We intend to continue to make targeted acquisitions, following
28.7% 10.9% 4.9% 15.8% 5.5%
financial position and cash our disciplined approach to ensure strong strategic business
03 04 07
05 06
flows, and our confidence in fit and solid financial performance.
the ongoing strength of the Share appreciation plus dividends
business for the years ahead. S&P 500 total return
2. for environmental liabilities or other insured losses. Expected
CRITICAL ACCOUNTING ESTIMATES
insurance proceeds are recorded as receivables when recovery is
Our consolidated financial statements are prepared in accordance
probable. While the final resolution of litigation and environmental
with accounting principles generally accepted in the United States
contingencies could result in amounts different than current
of America (U.S. GAAP). We have adopted various accounting
accruals, and therefore have an impact on our consolidated
policies to prepare the consolidated financial statements in
financial results in a future reporting period, we believe the ultimate
accordance with U.S. GAAP. Our most significant accounting policies
outcome will not have a significant effect on our financial position.
are disclosed in Note 2 of the notes to the consolidated financial
statements.
ACTUARIALLY DETERMINED LIABILITIES
Preparation of our consolidated financial statements, in conformity The measurement of our pension and postretirement benefit
with U.S. GAAP, requires us to make estimates and assumptions obligations are dependent on a variety of assumptions determined
that affect the amounts reported in the consolidated financial by management and used by our actuaries. These assumptions
statements and accompanying notes. Estimates are considered to affect the amount and timing of future contributions and expenses.
be critical if they meet both of the following criteria: (1) the estimate
The assumptions used in developing the required estimates include,
requires assumptions to be made about matters that are highly
among others, discount rate, projected salary and health care cost
uncertain at the time the accounting estimate is made, and (2)
increases and expected return or earnings on assets. The discount
different estimates that the company reasonably could have used
rate assumption for the U.S. Plans is calculated using a bond yield
for the accounting estimate in the current period, or changes in
curve constructed from a large population of high-quality, non-
the accounting estimate that are reasonably likely to occur from
callable, corporate bond issues with maturity dates of six months
period to period, have a material impact on the presentation of the
to thirty years. Bond issues in the population are rated no less
company’s financial condition, changes in financial condition or
than Aa by Moody’s Investor Services or AA by Standard & Poors.
results of operations.
The discount rate is calculated by matching of the plan liability
Besides estimates that meet the “critical” estimate criteria, we cash flows to the yield curve. Projected salary and health care
make many other accounting estimates in preparing our financial cost increases are based on our long-term actual experience, the
statements and related disclosures. All estimates, whether or not near-term outlook and assumed inflation. The expected return on
deemed critical, affect reported amounts of assets, liabilities, plan assets reflects asset allocations, investment strategies and
revenues and expenses as well as disclosures of contingent the views of investment advisors. The effects of actual results
assets and liabilities. Estimates are based on experience and differing from our assumptions, as well as changes in assumptions,
other information available prior to the issuance of the financial are reflected in the unrecognized actuarial loss and amortized
statements. Materially different results can occur as circumstances over future periods and, therefore, generally affect our recognized
change and additional information becomes known, even from expense in future periods. The unrecognized actuarial loss on our
estimates not deemed critical. Our critical accounting estimates U.S. qualified and nonqualified pension plans decreased to $183
include the following: million (before tax) as of December 31, 2007, due primarily to an
increase in the discount rate at the end of 2007 and amortization of
REVENUE RECOGNITION existing unrecognized actuarial losses, partially offset by lower than
We recognize revenue on product sales at the time title to the expected return on plan assets. Significant differences in actual
product and risk of loss transfers to the customer. We recognize experience or significant changes in assumptions may materially
revenue on services as they are performed. Our sales policies affect pension and other post-retirement obligations. In determining
do not provide for general rights of return and do not contain our U.S. pension and postretirement obligations for 2007, our
customer acceptance clauses. We record estimated reductions to discount rate increased to 5.99% from 5.79% at year-end 2006.
revenue for customer programs and incentive offerings including Our projected salary increase was unchanged at 4.32% and our
pricing arrangements, promotions and other volume-based expected return on plan assets used for determining 2007 expense
20 incentives at the time the sale is recorded. Depending on market was unchanged at 8.75%.
conditions, we may increase customer incentive offerings,
2007 ECOLAB ANNUAL REPORT
The effect on 2008 expense of a decrease in the discount rate or
which could reduce gross profit margins at the time the
expected return on assets assumption as of December 31, 2007
incentive is offered.
is shown below assuming no changes in benefit levels and no
VALUATION ALLOWANCES AND amortization of gains or losses for our major plans:
ACCRUED LIABILITIES MILLIONS EFFECT ON U.S. PENSION PLAN
We estimate sales returns and allowances by analyzing historical INCREASE IN HIGHER
returns and credits, and apply these trend rates to the most ASSUMPTION RECORDED 2008
ASSUMPTION CHANGE OBLIGATION EXPENSE
recent 12 months’ sales data to calculate estimated reserves for
future credits. We estimate the allowance for doubtful accounts Discount rate -0.25 pts $32.1 $4.3
by analyzing accounts receivable balances by age and applying Expected return on assets -0.25 pts N/A $2.0
historical write-off trend rates. In addition, our estimates also
include separately providing for 100% of specific customer EFFECT ON U.S. POSTRETIREMENT
balances when it is deemed probable that the balance is MILLIONS HEALTH CARE BENEFITS PLAN
INCREASE IN HIGHER
uncollectible. Actual results could differ from these estimates
ASSUMPTION RECORDED 2008
under different assumptions.
ASSUMPTION CHANGE OBLIGATION EXPENSE
Estimates used to record liabilities related to pending litigation Discount rate -0.25 pts $4.5 $0.7
and environmental claims are based on our best estimate of
Expected return on assets -0.25 pts N/A $0.1
probable future costs. We record the amounts that represent
the points in the range of estimates that we believe are most
probable or the minimum amounts when no amount within the We use similar assumptions to measure our international pension
range is a better estimate than any other amount. Potential obligations. However, the assumptions used vary by country based
insurance reimbursements are not anticipated in our accruals on specific local country requirements. See Note 15 for further
3. discussion concerning our accounting policies, estimates, funded when the amount of expected future taxable income is not likely
status, planned contributions and overall financial positions of our to support the utilization of the deduction or credit. Deferred tax
pension and post-retirement plan obligations. liabilities generally represent items for which we have already
taken a deduction in our tax return, but have not yet recognized
We are self-insured in North America for most workers
that tax benefit in our financial statements. Undistributed earnings
compensation, general liability and automotive liability losses,
of foreign subsidiaries are considered to have been reinvested
subject to per occurrence and aggregate annual liability limitations.
indefinitely or available for distribution with foreign tax credits
We are insured for losses in excess of these limitations. We have
available to offset the amount of applicable income tax and
recorded both a liability and an offsetting receivable for amounts
foreign withholding taxes that might be payable on earnings.
in excess of these limitations. We are also self-insured for health
It is impractical to determine the amount of incremental taxes
care claims for eligible participating employees, subject to certain
that might arise if all undistributed earnings were distributed.
deductibles and limitations. We determine our liabilities for claims
incurred but not reported on an actuarial basis. A change in these A number of years may elapse before a particular tax matter, for
assumptions would cause reported results to differ. Outside of which we have established a reserve, is audited and finally resolved.
North America, we are fully insured for losses, subject to The number of tax years with open tax audits varies depending
annual deductibles. on the tax jurisdiction. During 2004, the Internal Revenue Service
(IRS) completed its field examination of our U.S. income tax returns
SHARE-BASED COMPENSATION for 1999 through 2001. During 2007, the IRS completed its field
As required by Statement of Financial Accounting Standards No. 123 examination of our U.S. income tax returns for 2002 through 2004.
(Revised 2004), Share-Based Payment (“SFAS 123R”), we measure It is reasonably possible for specific open positions related to
compensation expense for share-based awards at fair value at the these examinations as of year end to be settled in the next twelve
date of grant and recognize compensation expense over the service months. Unfavorable settlement of any particular issue could
period for awards expected to vest. Determining the fair value of result in offsets to other balance sheet accounts, cash payments
share-based awards at the grant date requires judgment, including and/or additional tax expense. Favorable resolution could result in
estimating expected volatility, exercise and post-vesting termination reduced income tax expense reported in the financial statements
behavior, expected dividends and risk-free rates of return. in the future. The majority of our tax reserves are presented in the
Additionally, the expense that is recorded is dependent on the balance sheet within other non-current liabilities.
amount of share-based awards expected to be forfeited. If actual
LONG-LIVED AND INTANGIBLE ASSETS
forfeiture results differ significantly from these estimates, share-
based compensation expense and our results of operations could We periodically review our long-lived and intangible assets for
be impacted. For additional information on our stock incentive and impairment and assess whether significant events or changes in
option plans, including significant assumptions used in determining business circumstances indicate that the carrying value of the
fair value, see Note 10. assets may not be recoverable. This could occur when the carrying
amount of an asset exceeds the anticipated future undiscounted
INCOME TAXES cash flows expected to result from the use of the asset and its
Judgment is required to determine the annual effective income eventual disposition. The amount of the impairment loss to be
tax rate, deferred tax assets and liabilities and any valuation recorded, if any, is calculated as the excess of the asset’s carrying
allowances recorded against net deferred tax assets. Our effective value over its estimated fair value. We also periodically reassess
income tax rate is based on annual income, statutory tax rates and the estimated remaining useful lives of our long-lived assets.
tax planning opportunities available in the various jurisdictions Changes to estimated useful lives would impact the amount of
in which we operate. Effective January 1, 2007 we adopted FASB depreciation and amortization expense recorded in earnings. We
Interpretation No. 48, Accounting for Uncertainty in Income Taxes, have experienced no significant changes in the carrying value or
an interpretation of FASB Statements No. 109 (“FIN 48”). FIN 48 estimated remaining useful lives of our long-lived assets.
21
requires us to recognize the largest amount of tax benefit that is
We review our goodwill for impairment on an annual basis for all
greater than 50% likely of being realized upon settlement with
2007 ECOLAB ANNUAL REPORT
reporting units. If circumstances change significantly within a
a taxing authority. Our annual effective income tax rate includes
reporting unit, we would test for impairment during interim periods
the impact of reserve provisions. We adjust these reserves in light
prior to the annual test. Goodwill and certain intangible assets are
of changing facts and circumstances. During interim periods, this
assessed for impairment using fair value measurement techniques.
annual rate is then applied to our year-to-date operating results.
Specifically, goodwill impairment is determined using a two-step
In the event that there is a significant one-time item recognized
process. Both the first step of determining the fair value of a
in our interim operating results, the tax attributable to that item
reporting unit and the second step of determining the fair value
would be separately calculated and recorded in the same period
of individual assets and liabilities of a reporting unit (including
as the one-time item.
unrecognized intangible assets) are judgmental in nature and often
Tax regulations require items to be included in our tax returns involve the use of significant estimates and assumptions. Estimates
at different times than the items are reflected in our financial of fair value are primarily determined using discounted cash flows,
statements. As a result, the effective income tax rate reflected market comparisons and recent transactions. These valuation
in our financial statements differs from that reported in our methodologies use significant estimates and assumptions, which
tax returns. Some of these differences are permanent, such as include projected future cash flows (including timing), discount rate
expenses that are not deductible on our tax return, and some are reflecting the risk inherent in future cash flows, perpetual growth
temporary differences, such as depreciation expense. Temporary rate, and determination of appropriate market comparables. No
differences create deferred tax assets and liabilities. Deferred impairments were recorded in 2007, 2006 or 2005 as a result
tax assets generally represent items that can be used as a tax of the tests performed. Of the total goodwill included in our
deduction or credit in our tax return in future years for which we consolidated balance sheet, 25% is recorded in our U.S. Cleaning
have already recorded the tax benefit in our income statement. & Sanitizing reportable segment, 4% in our U.S. Other Services
We establish valuation allowances for our deferred tax assets segment and 71% in our International segment.
4. FUNCTIONAL CURRENCIES 2007 2006 2005
In preparing the consolidated financial statements, we are required
Operating income as a percent
to translate the financial statements of our foreign subsidiaries of net sales 12.2% 12.5% 12.0%
from the currency in which they keep their accounting records,
the local currency, into United States dollars. Assets and liabilities Operating income increased 9% in 2007 over 2006. The increase
of these operations are translated at the exchange rates in effect in operating income in 2007 is due to sales volume, pricing and
at each fiscal year end. The translation adjustments related to cost savings initiatives, partially offset by special gains and charges,
assets and liabilities that arise from the use of differing exchange higher delivered product costs and investments in the business.
rates from period to period are included in accumulated other Operating income as a percent of sales decreased from 2006 due
comprehensive income in shareholders’ equity. Income statement to special gains and charges of $19.7 million. Excluding special
accounts are translated at average rates of exchange prevailing gains and charges, our 2007 operating income margin
during the year. We evaluate our International operations based on increased to 12.6%.
fixed rates of exchange; however, the different exchange rates from
Net income increased 16% in 2007 to $427 million compared to
period to period impact the amount of reported income from our
$369 million in 2006. Net income in both years included items of a
consolidated operations.
non-recurring nature that are not necessarily indicative of future
RESULTS OF OPERATIONS operating results. Net income in 2007 includes $9.5 million, net
CONSOLIDATED of tax benefit, of special gains and charges and $19.3 million of
discrete tax benefits. Net income in 2006 included a discrete tax
PRIOR YEAR
PERCENT CHANGE benefit of $1.8 million which was offset by a $1.8 million charge,
MILLIONS,
2007 2006 2005 2007 2006 net of tax benefit, in selling, general and administrative expense to
EXCEPT PER SHARE
recognize minimum royalties under a licensing agreement with no
Net sales $5,470 $4,896 $4,535 12% 8%
future benefit. These items increased net income growth in 2007
Operating income 667 612 542 9 13
by 3%. Our 2007 net income was positively impacted by favorable
Net income 427 369 319 16 15
currency translation of approximately $15 million and also
Diluted net income
benefited when compared to 2006 due to a lower overall
per common share $ 1.70 $ 1.43 $ 1.23 19% 16%
effective income tax rate.
2006 COMPARED WITH 2005
Our consolidated net sales increased 12% in 2007. The components
include 5% volume growth, 2% favorable effect from price changes, Our consolidated net sales for 2006 increased 8% over 2005. The
1% due to acquisitions and divestitures and 4% due to favorable components include 6% volume growth and 2% favorable effect
changes in currency translation. from price changes. Acquisitions and divestitures and changes
in currency translation did not have a significant impact on the
2007 2006 2005
consolidated sales growth rate for 2006.
Gross profit as a percent of net sales 50.8% 50.7% 50.4%
Our consolidated gross profit margin for 2006 increased from
Selling, general & administrative
2005, primarily driven by pricing and cost savings initiatives which
expenses as a percent of net sales 38.2% 38.2% 38.4%
more than offset higher delivered product costs during the year.
Selling, general and administrative expenses as a percentage of
Our consolidated gross profit margin (defined as gross profit
sales improved in 2006 compared to 2005. The improvement in the
divided by net sales) increased in 2007, primarily driven by
2006 expense ratio was primarily due to increased sales leverage
pricing and cost savings initiatives, more than offsetting higher
and cost saving programs which more than offset investments in
delivered product costs, acquisition dilution and business mix in
22 the business.
our international operations.
Operating income increased 13% in 2006 over 2005. As a percent
2007 ECOLAB ANNUAL REPORT
Selling, general and administrative expenses as a percentage of
of sales, operating income also increased from 2005. The increase
sales remained at 38.2% for 2007. Leverage from our sales growth
in operating income was due to pricing, sales volume and cost
was fully offset by investments we are making in business systems,
reduction initiatives partially offset by higher delivered product
new product solutions and business efficiency initiatives.
costs as well as investments in the business.
Special gains and charges were $19.7 million in 2007 and include
Our net income increased 15% in 2006 compared to 2005. Net
a $27.4 million charge for an arbitration settlement related to
income in both years included items of a non-recurring nature
two California class action lawsuits involving wage/hour claims
that are not necessarily indicative of future operating results.
affecting former and current Pest Elimination employees recorded
Net income in 2006 included a discrete tax benefit of $1.8 million
in the third quarter of 2007. Special gains and charges also include
which was offset by a $1.8 million charge, net of tax benefit, in
one-time costs related to establishing the company’s European
selling, general and administrative expense to recognize minimum
headquarters in Zurich, Switzerland and other non-recurring
royalties under a licensing agreement with no future benefit. Net
charges. These charges were partially offset by a $6.3 million gain
income in 2005 included a tax charge of $3.1 million related to
on the sale of a minority investment located in the U.S. and a $4.7
the repatriation of foreign earnings under the American Jobs
million gain on the sale of Peter Cox Ltd. in the U.K. which were
Creation Act (AJCA). These items increased net income growth by
recorded in the fourth quarter of 2007. For segment reporting
1% for 2006. The increase in net income reflects improved sales,
purposes, these items have been included in our corporate
gross margin and operating income growth. Currency translation
segment, which is consistent with our internal
positively impacted net income in 2006 by approximately $2
management reporting.
million. Our 2006 net income also benefited when compared to
2005 due to a lower overall effective income tax rate.
5. SEGMENT PERFORMANCE UNITED STATES OTHER SERVICES
SALES BUSINESS MIX
Our operating segments have been aggregated into three
MILLIONS PERCENT
reportable segments: U.S. Cleaning & Sanitizing, U.S. Other Services
and International. We evaluate the performance of our International
$450
operations based on fixed management rates of currency exchange.
Therefore, International sales and operating income totals, as well
$411
Pest Elimination 70%
as the International financial information included in this financial
$375
GCS Service 30%
discussion, are based on translation into U.S. dollars at the fixed
currency exchange rates used by management for 2007. The
difference between actual currency exchange rates and the fixed
currency exchange rates used by management is included in “Effect 07
05 06
of foreign currency translation” within our operating segment
U.S. Other Services sales increased 10% in 2007. Pest Elimination
results. All other accounting policies of the reportable segments
continued to show strong growth as its sales increased 10%, driven
are consistent with U.S. GAAP and the accounting policies of the
by strong contract sales with significant new corporate account
company described in Note 2 of the notes to consolidated financial
gains, supplemented by strong non-contract sales. GCS Service
statements. Additional information about our reportable segments
sales increased a strong 8% in 2007 showing improved sales
is included in Note 16 of the notes to consolidated financial
momentum driven by corporate account gains.
statements.
INTERNATIONAL
SALES BY REPORTABLE SEGMENT
SALES BUSINESS MIX
PRIOR YEAR
MILLIONS PERCENT
PERCENT CHANGE
2007 2006 2005 2007 2006
MILLIONS
$2,522
$2,372
Europe/Middle East/
$2,245
Net sales Africa 69%
United States Asia Pacific 16%
Cleaning & Sanitizing $ 2,351 $ 2,152 $ 1,952 9% 10% Latin America 8%
Canada 7%
Other Services 450 411 375 10 9
Total United States 2,801 2,563 2,327 9 10
07
05 06
International 2,522 2,372 2,245 6 6
Total 5,323 4,935 4,572 8 8
Management rate sales of our International operations grew 6%
Effect of foreign
in 2007. Acquisitions and divestitures did not have a significant
currency translation 147 (39) (37)
impact on the year over year sales growth in 2007. Sales in Europe/
Consolidated $ 5,470 $ 4,896 $ 4,535 12% 8%
Middle East/Africa (EMEA) increased 5% in 2007 as good sales
gains in the United Kingdom, South Africa and Turkey were partially
offset by weak results in Germany and France. EMEA also achieved
UNITED STATES CLEANING & SANITIZING
geographic growth in 2007 through further expansion in eastern
SALES BUSINESS MIX
Europe. Asia Pacific sales grew 9% primarily driven by significant
MILLIONS PERCENT
growth in China and Hong Kong as well as good growth in Japan
and Australia. Asia Pacific sales benefited from new corporate
Institutional 62%
$2,351
Food & Beverage 17% accounts and good results in the beverage and brewery market.
$2,152
$1,952
Kay 11% Latin America sales continued to be strong, rising 14% in 2007. 23
Healthcare 3% The growth over last year was led by double-digit growth in Brazil,
2007 ECOLAB ANNUAL REPORT
Vehicle Care 3%
Mexico and the Caribbean. Sales benefited from new account gains,
Textile Care 2%
growth of existing accounts and success with new programs. Sales
Water Care Services 2%
in Canada increased 7% in 2007, led by institutional growth due
05 06 07
to corporate account gains, new products and excellent
U.S. Cleaning & Sanitizing sales increased 9% in 2007, led by account retention.
Institutional, Food & Beverage, and Kay gains. Acquisitions added
1% to the year over year sales growth. Institutional sales increased
8% in 2007 resulting from new account gains and good sales
growth into its various end-market segments including travel,
restaurant and healthcare. Food & Beverage sales increased 9%
for 2007. An acquisition in 2006 added 2% and the remaining
increase was due to sales growth in the meat & poultry, food and
beverage markets. Kay sales grew 9% in 2007 led by solid
ongoing food retail and quickservice restaurant demand from
major existing customers, strong new account gains and
success with new products and programs.
6. OPERATING INCOME BY REPORTABLE SEGMENT CORPORATE
Consistent with our internal management reporting, the corporate
2007 2006 2005
MILLIONS
segment includes $19.7 million of special gains and charges
Operating income reported on the Consolidated Statement of Income. It also includes
United States investments we are making in business systems and to optimize our
business structure as part of our ongoing efforts to improve our
Cleaning & Sanitizing $ 394 $ 329 $ 280
efficiency and returns. We did not report any items in our corporate
Other Services 41 39 36
segment in 2006 or 2005.
Total United States 435 368 316
International 253 247 231 2006 COMPARED WITH 2005
Total 688 615 547 Sales of our U.S. Cleaning & Sanitizing operations increased 10%
in 2006 from 2005. Sales were driven by double-digit sales growth
Corporate (40) – –
from Institutional and Kay, along with good growth from Food
Effect of foreign
currency translation 19 (3) (5) & Beverage. Institutional sales increased 11%, benefiting from
significant new account gains during the year. Institutional results
Consolidated $ 667 $ 612 $ 542
reflect sales growth into all end market segments, including double-
digit growth in travel, casual dining and health care markets. Food
Operating income as a
& Beverage sales increased 8% for 2006. An acquisition added 1%
percent of net sales
and the remaining increase was due to double-digit gains in the
United States
meat & poultry market as well as good gains in the dairy, food and
Cleaning & Sanitizing 16.8% 15.3% 14.3%
soft drink markets. Kay recorded an 11% sales increase in 2006
Other Services 9.0 9.5 9.6
led by gains in its core quickservice and food retail markets. Kay
Total United States 15.5 14.4 13.6 benefited from good ongoing demand from existing customers as
International 10.0 10.3 10.3 well as new account gains.
Consolidated 12.2% 12.5% 12.0% Sales of our U.S. Other Services operations increased 9% in 2006.
Pest Elimination continued its double-digit sales growth as sales
U.S. Cleaning & Sanitizing operating income increased 20% in
rose 13%. Sales were driven by growth in both core pest elimination
2007. As a percentage of net sales, operating income increased to
contract and non-contract services. Sales also benefited from new
16.8% in 2007 from 15.3% in 2006. Operating income increased
accounts and strong customer retention. GCS Service sales grew
due to pricing, higher sales volume and cost efficiencies which more
modestly as service and installed parts sales increased over last
than offset rising delivered product costs and investments in the
year. GCS Service continued to focus on infrastructure and process
business. Acquisitions and divestitures had minimal effect on the
development in 2006 that helped improve competitive advantage
overall percentage increase in operating income.
and business scalability in the future.
U.S. Other Services operating income increased 4% in 2007.
Management rate sales of our International operations increased
Operating income increased due to pricing and higher sales volume
6% in 2006 over 2005. Acquisitions and divestitures added 1% to
which were partially offset by investments in the business and costs
the year over year sales growth. Sales in Europe increased 4% from
associated with the implementation of a new business platform for
2005. Good sales growth in the United Kingdom was partially offset
GCS. As a percentage of net sales, operating income decreased to
by slower sales growth in Germany, France and Italy. Europe also
9.0% in 2007 from 9.5% in 2006. The decrease in the ratio was
achieved geographic growth in 2006 through further expansion
primarily due to legal charges at Pest Elimination as well as
in eastern Europe. Asia Pacific sales grew 6% primarily driven
system implementation costs at GCS.
by growth in China, Australia, Thailand and Hong Kong partially
24 offset by weakness in Japan. Asia Pacific sales benefited from
International management-rate based operating income rose 2%
new corporate accounts and good results in the beverage and
in 2007. The International operating income margin was 10.0% in
2007 ECOLAB ANNUAL REPORT
brewery market. Latin America recorded strong 14% sales growth
2007 compared to 10.3% in 2006. Operating income increased
in 2006. The growth was driven by results in Mexico, the Caribbean
due to higher sales volume and pricing. However, operating income
and Venezuela. Results were due to new account gains, growth of
margin decreased due to higher delivered product costs and
existing accounts and success with new programs. Sales in Canada
significant investment in our international business in 2007. When
increased 8% in 2006, reflecting good results from all divisions.
measured at public currency rates, operating income increased
Sales benefited from pricing, account retention and new business.
12% in 2007. Acquisitions and divestitures did not have a significant
impact on operating income growth.
Operating income of our U.S. Cleaning & Sanitizing operations
increased 18% in 2006. As a percentage of net sales, operating
Operating income margins of our International operations are
income increased to 15.3% in 2006 from 14.3% in 2005.
generally less than those realized for our U.S. operations. The lower
Acquisitions and divestitures had no effect on the overall
International margins are due to (i) the additional costs caused
percentage increase in operating income. Operating income
by the difference in scale of International operations where many
increased due to pricing, higher sales volume and improved cost
operating locations are smaller in size, (ii) the additional cost
efficiencies, which more than offset higher delivered product costs
of operating in numerous and diverse foreign jurisdictions and
and investments in the business.
(iii) higher costs of importing raw materials and finished goods.
Proportionately larger investments in sales, technical support and
Operating income of our U.S. Other Services operations increased
administrative personnel are also necessary in order to facilitate
8% in 2006. As a percentage of net sales, operating income
the growth of our International operations.
decreased slightly to 9.5% in 2006 from 9.6% in 2005. Double-digit
operating income growth at Pest Elimination was offset by slow
7. sales growth as well as investments in the GCS business. Operating TOTAL DEBT TO CAPITALIZATION
income growth and operating income margin comparisons were PERCENT
also impacted by a $0.5 million regulatory expense in the second
quarter of 2006 and a $0.5 million patent settlement benefit in the
39%
34%
first quarter of 2005.
31%
Shareholders’ Equity 66%
Management-rate based operating income of International
Total Debt 34%
operations rose 7% in 2006. The International operating income
margin was 10.3% in both 2006 and 2005. Acquisitions and
divestitures occurring in 2006 and 2005 increased operating
07
05 06
income growth by 1% over 2005. Operating income growth
benefited from pricing, sales volume growth and cost efficiencies
Total debt was $1.0 billion at December 31, 2007 and decreased
which more than offset higher delivered product costs and
from total debt of $1.1 billion at December 31, 2006. The decrease
investments in the business.
in total debt was primarily due to the scheduled repayment of
INTEREST our 5.375% euronotes in February 2007, offset partially by an
Net interest expense totaled $51 million in 2007 compared to $44 increase in short-term borrowings primarily to fund acquisitions
million in 2006. The increase in our net interest expense in 2007 and share repurchases. The ratio of total debt to capitalization
is due to higher debt, primarily to fund acquisitions and share (total debt divided by the sum of shareholders’ equity plus total
repurchases. Net interest expense was $44 million for both debt) was 34% at year-end 2007 and 39% at year-end 2006. The
2006 and 2005. debt to capitalization ratio was higher in 2006, due to the new
senior notes issued in December 2006, the proceeds of which were
INCOME TAXES used to repay our 5.375% euronotes in February 2007. Excluding
The following table provides a summary of our reported tax rate: the 5.375% euronotes, the total debt to capitalization would have
been 29% for 2006 compared to 34% for 2007. 2007 increased
2007 2006 2005
due to additional short-term borrowing discussed above. We view
Reported tax rate 30.7% 35.0% 35.9%
our debt to capitalization ratio as an important indicator of our
Impact of discrete items creditworthiness.
increase (decrease) (3.7)% (0.4)% 0.3%
CASH FLOWS CASH PROVIDED BY
Reductions in our effective income tax rates over the last three
Cash provided by operating OPERATING ACTIVITIES
years have primarily been due to U.S. tax legislation, international
activities increased $170 MILLIONS
rate reductions and tax planning efforts. The 2007 reported tax
million in 2007. The increase
$798
rate was impacted by $29.5 million of discrete items including $10.2
in operating cash flow for
million of net tax benefits on special gains and charges as well as
2007 over 2006 is due to
$628
$19.3 million of discrete tax benefits. Discrete tax benefits in 2007
increased earnings, reduction
$590
included $8.4 million of tax benefit due to legislated corporate tax
of pension contributions and
$571
rate reductions in the U.K. and Germany which reduced our net
lower income tax payments
$524
deferred tax liability and $10.9 million for various audit settlements
due in 2007 compared
as well as other discrete items during 2007. 2006 included the
to 2006. The increase in
benefit of a $1.8 million tax settlement and a $0.5 million benefit
operating cash flow for 2006
related to prior years. 2005 included a $3.1 million tax charge
over 2005 reflects our higher
related to the repatriation of foreign earnings under the AJCA
earnings offset partially by
03 04 07
05 06
and other one-time benefits. 25
an increase in income tax
payments and accounts
FINANCIAL POSITION & LIQUIDITY
2007 ECOLAB ANNUAL REPORT
receivable in 2006. Historically, we have had strong operating cash
FINANCIAL POSITION
flows and we anticipate this will continue. We expect to continue
Our debt continued to be rated within the “A” categories by the
to use this cash flow to acquire new businesses, repurchase our
major rating agencies during 2007. Significant changes in our
common stock, pay down debt and meet our ongoing obligations
financial position during 2007 included the following:
and commitments.
Total assets increased to $4.7 billion as of December 31, 2007
Cash used for investing activities increased in 2007 primarily
from $4.4 billion at year-end 2006. The increase is primarily due
due to increased acquisition activity, higher capital and software
to acquisitions which added $0.4 billion and foreign currency
investments, and timing of short-term investment sales in 2006.
translation which added approximately $0.2 billion to the value of
We continue to acquire strategic businesses which compliment
non-U.S. assets on the balance sheet as the U.S. dollar weakened
our growth strategy. We also continue to invest in merchandising
against foreign currencies, primarily the euro. These increases were
equipment consisting primarily of systems used by our customers
partially offset by a decrease in cash and cash equivalents used for
to dispense our cleaning and sanitizing products. Capital software
the scheduled repayment of our 5.375% euronotes in
expenditures increased due to investments in new business
February 2007.
systems. We expect to continue to make significant capital
investments and acquisitions to support our long-term growth.
Total liabilities increased to $2.8 billion at December 31, 2007 from
$2.7 billion at December 31, 2006 primarily due to an increase in
Our cash flows from financing activities reflect issuances and
short-term borrowings and the effects of currency translation,
repayment of debt, common stock repurchases, dividend payments
offset by the scheduled repayment of our 5.375% euronotes.
and proceeds from common stock issuances related to our equity
incentive programs. Cash used for financing activities increased in
2007 due to long-term debt repayment and a significant increase in
share repurchases, offset partially by short-term borrowings.
8. Share repurchases were funded with operating cash flows, short- As of December 31, 2007, $345 million of this credit facility was
term borrowing and cash from the exercise of employee stock committed to support outstanding U.S. commercial paper, leaving
options. In October 2006, we announced an authorization to $255 million available for other uses. In addition, we have other
repurchase up to 10 million shares of Ecolab common stock. As of committed and uncommitted credit lines of approximately $241
December 31, 2007, approximately 4.7 million shares remained to million with major international banks and financial institutions to
be purchased under this authorization. Shares are repurchased for support our general global funding needs. Additional details on our
the purpose of offsetting the dilutive effect of stock options and credit facilities are included in Note 6 of the notes to consolidated
incentives and for general corporate purposes. During 2008, we financial statements.
expect to repurchase at least enough shares to offset the dilutive
A schedule of our obligations under various notes payable, long-
effect of stock options. Cash proceeds from the exercises as well
term debt agreements, operating leases with noncancelable terms
as the tax benefits will provide a portion of the funding for this
in excess of one year, interest obligations and benefit payments are
repurchase activity.
summarized in the following table:
In 2007, we increased our indicated annual dividend rate for the
PAYMENTS DUE BY PERIOD
MILLIONS
16th consecutive year. We have paid dividends on our common
LESS MORE
stock for 71 consecutive years. Cash dividends declared per share Contractual THAN 1–3 3–5 THAN
obligations TOTAL 1 YEAR YEARS YEARS 5 YEARS
of common stock, by quarter, for each of the last three years
Notes payable
were as follows: $ 400 $ 400 $ – $ – $ –
Long-term debt 603 3 5 152 443
FIRST SECOND THIRD FOURTH
Operating leases 176 53 70 31 22
QUARTER QUARTER QUARTER QUARTER YEAR
Interest* 198 35 64 44 55
2007 $0.1150 $0.1150 $0.1150 $0.1300 $0.4750
Benefit payments** 848 64 134 156 494
2006 0.1000 0.1000 0.1000 0.1150 0.4150
Total contractual
2005 0.0875 0.0875 0.0875 0.1000 0.3625 cash obligations $ 2,225 $ 555 $ 273 $ 383 $ 1,014
* Interest on variable rate debt was calculated using the interest rate at
LIQUIDITY AND CAPITAL RESOURCES
year-end 2007.
We currently expect to fund all of the requirements which are
** Benefit payments are paid out of the company’s pension and
reasonably foreseeable for 2008, including scheduled debt postretirement health care benefit plans.
repayments, new investments in the business, share repurchases,
As of December 31, 2007, our gross liability for uncertain tax
dividend payments, possible business acquisitions and pension
positions under FIN 48 was $99 million. We are not able to
contributions from operating cash flow, cash reserves and short-
reasonably estimate the amount by which the liability will increase
term and/or long-term borrowings. In the event of a significant
or decrease over time. Therefore, these amounts have been
acquisition or other significant funding need, funding may occur
excluded from the schedule of contractual obligations.
through additional short and/or long-term borrowings or through
the issuance of the company’s common stock.
We are not required to make any contributions to our U.S.
pension and postretirement health care benefit plans in 2008,
In December 2006, we issued and sold in a private placement euro
based on plan asset values as of December 31, 2007 and have
300 million ($439 million as of December 31, 2007) aggregate
not yet determined if we will do so. Certain international pension
principal amount of senior notes in two series: 4.355% Series
benefit plans are required to be funded in accordance with local
A Senior Notes due 2013 in the aggregate principal amount of
government requirements. We estimate contributions to be made to
euro 125 million and 4.585% Series B Senior Notes due 2016 in
our international plans will approximate $20 million to $30 million
the aggregate principal amount of euro 175 million (the “Notes),”
in 2008. These amounts have been excluded from the schedule of
pursuant to a Note Purchase Agreement dated July 26, 2006,
contractual obligations.
26 between the company and the purchasers. The Notes are not
subject to prepayment except where, in certain specified instances,
We lease sales and administrative office facilities, distribution
2007 ECOLAB ANNUAL REPORT
we consolidate or merge all or substantially all of our assets with
center facilities and other equipment under longer-term operating
any other Person (as defined in the Note Purchase Agreement) and
leases. Vehicle leases are generally shorter in duration. Vehicle
there is also a resulting ratings downgrade to below investment
leases have guaranteed residual value requirements that have
grade. Upon such consolidation or merger, we will offer to prepay
historically been satisfied by the proceeds on the sale of the
all of the Notes at 100% of the principal amount outstanding plus
vehicles. No amounts have been recorded for these guarantees in
accrued interest. In the event of a default by the company under
the table preceding as we believe that the potential recovery of
the Note Purchase Agreement, the Notes may become immediately
value from the vehicles when sold will be greater than the residual
due and payable for the unpaid principal amount, accrued interest
value guarantee.
and a make-whole amount determined as of the time of the default.
Except for approximately $56 million of letters of credit supporting
The proceeds were used to repay our euro 300 million 5.375%
domestic and international commercial relationships and
euronotes which became due in February 2007.
transactions, primarily our North America self-insurance program,
While cash flows could be negatively affected by a decrease
we do not have significant unconditional purchase obligations, or
in revenues, we do not believe that our revenues are highly
significant other commercial commitments, such as commitments
susceptible, in the short term, to rapid changes in technology
under lines of credit, standby letters of credit, guarantees, standby
within our industry. We have a $600 million U.S. commercial paper
repurchase obligations or other commercial commitments.
program and a $200 million European commercial paper program.
As of year-end 2007, we are in compliance with all covenants and
Both programs are rated A-1 by Standard & Poor’s and P-1 by
other requirements of our credit agreements and indentures. Our
Moody’s. To support our commercial paper programs and other
$600 million multicurrency credit agreement, as amended and
general business funding needs, we maintain a $600 million multi-
restated, no longer includes a covenant regarding the ratio of total
year committed credit agreement which expires in June 2012. We
debt to capitalization. Our euro 300 million senior notes include
can draw directly on the credit facility on a revolving credit basis.