NO1 WorldWide Love marriage specialist baba ji Amil Baba Kala ilam powerful v...
yrc worldwide2Q07_Stats_2
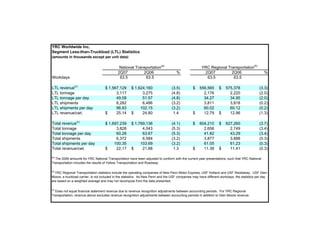
1. YRC Worldwide Inc.
Segment Less-than-Truckload (LTL) Statistics
(amounts in thousands except per unit data)
National Transportation(a) YRC Regional Transportation(b)
2Q07 2Q06 % 2Q07 2Q06 %
Workdays 63.5 63.5 63.5 63.5
LTL revenue(c) $ 1,567,129 $ 1,624,160 (3.5) $ 556,565 $ 575,378 (3.3)
LTL tonnage 3,117 3,275 (4.8) 2,176 2,220 (2.0)
LTL tonnage per day 49.08 51.57 (4.8) 34.27 34.95 (2.0)
LTL shipments 6,282 6,486 (3.2) 3,811 3,818 (0.2)
LTL shipments per day 98.93 102.15 (3.2) 60.02 60.12 (0.2)
LTL revenue/cwt. $ 25.14 $ 24.80 1.4 $ 12.79 $ 12.96 (1.3)
Total revenue(c) $ 1,697,239 $ 1,769,136 (4.1) $ 604,210 $ 627,260 (3.7)
Total tonnage 3,828 4,043 (5.3) 2,656 2,749 (3.4)
Total tonnage per day 60.28 63.67 (5.3) 41.82 43.29 (3.4)
Total shipments 6,372 6,584 (3.2) 3,877 3,888 (0.3)
Total shipments per day 100.35 103.69 (3.2) 61.05 61.23 (0.3)
Total revenue/cwt. $ 22.17 $ 21.88 1.3 $ 11.38 $ 11.41 (0.3)
(a)
The 2006 amounts for YRC National Transportation have been adjusted to conform with the current year presentations, such that YRC National
Transportation includes the results of Yellow Transportation and Roadway.
(b)
YRC Regional Transportation statistics include the operating companies of New Penn Motor Express, USF Holland and USF Reddaway. USF Glen
Moore, a truckload carrier, is not included in the statistics. As New Penn and the USF companies may have different workdays, the statistics per day
are based on a weighted average and may not recompute from the data presented.
(c)
Does not equal financial statement revenue due to revenue recognition adjustments between accounting periods. For YRC Regional
Transportation, revenue above excludes revenue recognition adjustments between accounting periods in addition to Glen Moore revenue.