7. Six months ended June 30, 2007
Corporate Total “Core Total
Lending DMO and Other Earnings” Adjustments GAAP
(unaudited)
Interest income:
FFELP Stafford and Other Student
Loans . . . . . . . . . . . . . . . . . . . . $1,413,977 $ — $ — $1,413,977 $ (451,915) $ 962,062
FFELP Consolidation Loans . . . . . . 2,722,250 — — 2,722,250 (620,150) 2,102,100
Private Education Loans . . . . . . . . . 1,350,083 — — 1,350,083 (682,311) 667,772
Other loans . . . . . . . . . . . . . . . . . . 54,426 — — 54,426 — 54,426
Cash and investments . . . . . . . . . . . 344,321 — 9,332 353,653 (98,225) 255,428
Total interest income . . . . . . . . . . . . . 5,885,057 — 9,332 5,894,389 (1,852,601) 4,041,788
Total interest expense . . . . . . . . . . . . 4,591,577 13,299 10,993 4,615,869 (1,386,550) 3,229,319
Net interest income (loss) . . . . . . . . . 1,293,480 (13,299) (1,661) 1,278,520 (466,051) 812,469
Less: provisions for losses . . . . . . . . . 444,911 — 606 445,517 (146,987) 298,530
Net interest income (loss) after
provisions for losses . . . . . . . . . . . 848,569 (13,299) (2,267) 833,003 (319,064) 513,939
Fee income . . . . . . . . . . . . . . . . . . . — 167,559 69,514 237,073 — 237,073
Collections revenue . . . . . . . . . . . . . . — 142,734 — 142,734 (80) 142,654
Other income . . . . . . . . . . . . . . . . . . 103,876 — 99,458 203,334 1,157,037 1,360,371
Total other income . . . . . . . . . . . . . . 103,876 310,293 168,972 583,141 1,156,957 1,740,098
Operating expenses(1) . . . . . . . . . . . . 353,213 189,555 171,937 714,705 40,269 754,974
Income (loss) before income taxes and
minority interest in net earnings of
subsidiaries . . . . . . . . . . . . . . . . . . 599,232 107,439 (5,232) 701,439 797,624 1,499,063
Income tax expense (benefit)(2) . . . . . . 221,716 39,752 (1,936) 259,532 155,206 414,738
Minority interest in net earnings of
subsidiaries . . . . . . . . . . . . . . . . . . — 1,701 — 1,701 — 1,701
Net income (loss) . . . . . . . . . . . . . . . $ 377,516 $ 65,986 $ (3,296) $ 440,206 $ 642,418 $1,082,624
(1)
Operating expenses for the Lending, DMO, and Corporate and Other business segments include $22 million, $7 million, and $10 mil-
lion, respectively, of stock option compensation expense.
(2)
Income taxes are based on a percentage of net income before tax for the individual reportable segment.
7
8. Six months ended June 30, 2006
Corporate Total “Core Total
Lending DMO and Other Earnings” Adjustments GAAP
(unaudited)
Interest income:
FFELP Stafford and Other Student
Loans . . . . . . . . . . . . . . . . . . . . $1,368,660 $ — $ — $1,368,660 $ (733,070) $ 635,590
FFELP Consolidation Loans . . . . . . 2,142,317 — — 2,142,317 (479,391) 1,662,926
Private Education Loans . . . . . . . . . 914,189 — — 914,189 (439,140) 475,049
Other loans . . . . . . . . . . . . . . . . . . 46,848 — — 46,848 — 46,848
Cash and investments . . . . . . . . . . . 300,338 — 1,982 302,320 (81,556) 220,764
Total interest income . . . . . . . . . . . . . 4,772,352 — 1,982 4,774,334 (1,733,157) 3,041,177
Total interest expense . . . . . . . . . . . . 3,562,895 10,622 2,623 3,576,140 (1,279,289) 2,296,851
Net interest income (loss) . . . . . . . . . 1,209,457 (10,622) (641) 1,198,194 (453,868) 744,326
Less: provisions for losses . . . . . . . . . 134,829 — (13) 134,816 (7,101) 127,715
Net interest income (loss) after
provisions for losses . . . . . . . . . . . 1,074,628 (10,622) (628) 1,063,378 (446,767) 616,611
Fee income . . . . . . . . . . . . . . . . . . . — 181,773 60,163 241,936 — 241,936
Collections revenue . . . . . . . . . . . . . . — 123,753 — 123,753 285 124,038
Other income . . . . . . . . . . . . . . . . . . 91,343 — 54,347 145,690 908,333 1,054,023
Total other income . . . . . . . . . . . . . . 91,343 305,526 114,510 511,379 908,618 1,419,997
Operating expenses(1) . . . . . . . . . . . . 324,600 174,623 108,747 607,970 31,941 639,911
Income before income taxes and
minority interest in net
earnings of subsidiaries . . . . . . . . . 841,371 120,281 5,135 966,787 429,910 1,396,697
Income tax expense(2) . . . . . . . . . . . . 311,308 44,504 1,899 357,711 161,162 518,873
Minority interest in net earnings of
subsidiaries . . . . . . . . . . . . . . . . . . — 2,445 — 2,445 — 2,445
Net income . . . . . . . . . . . . . . . . . . . $ 530,063 $ 73,332 $ 3,236 $ 606,631 $ 268,748 $ 875,379
(1)
Operating expenses for the Lending, DMO, and Corporate and Other business segments include $18 million, $5 million, and $9 mil-
lion, respectively, of stock option compensation expense.
(2)
Income taxes are based on a percentage of net income before tax for the individual reportable segment.
8
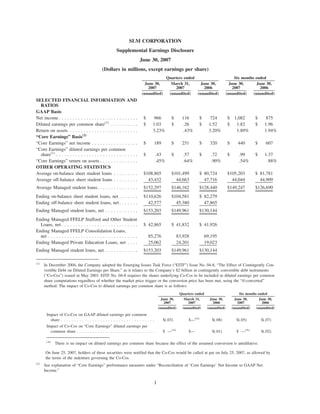
9. SLM CORPORATION
Reconciliation of “Core Earnings” Net Income to GAAP Net Income
(In thousands, except per share amounts)
Quarters ended Six months ended
June 30, March 31, June 30, June 30, June 30,
2007 2007 2006 2007 2006
(unaudited) (unaudited) (unaudited) (unaudited) (unaudited)
“Core Earnings” net income(A) . . . . . . . . $188,998 $ 251,208 $ 319,750 $ 440,206 $ 606,631
“Core Earnings” adjustments:
Net impact of securitization
accounting . . . . . . . . . . . . . . . . . . . . . (15,071) 421,485 503,083 406,414 441,022
Net impact of derivative accounting . . . . 841,564 (331,724) 164,678 509,840 125,861
Net impact of Floor Income . . . . . . . . . . (39,246) (39,021) (52,333) (78,267) (104,902)
Net impact of acquired intangibles(B) . . . (16,457) (23,906) (18,158) (40,363) (32,071)
Total “Core Earnings” adjustments before
income taxes and minority interest in net
earnings of subsidiaries . . . . . . . . . . . . . 770,790 26,834 597,270 797,624 429,910
Net tax effect(C) . . . . . . . . . . . . . . . . . . . . 6,683 (161,889) (193,242) (155,206) (161,162)
Total “Core Earnings” adjustments . . . . . . . 777,473 (135,055) 404,028 642,418 268,748
GAAP net income . . . . . . . . . . . . . . . . . . $966,471 $ 116,153 $ 723,778 $1,082,624 $ 875,379
GAAP diluted earnings per common
share . . . . . . . . . . . . . . . . . . . . . . . . . . . $ 1.03 $ .26 $ 1.52 $ 1.82 $ 1.96
(A)
“Core Earnings” diluted earnings per common
share . . . . . . . . . . . . . . . . . . . . . . . . . . . . . $ .43 $ .57 $ .72 $ .99 $ 1.37
(B)
Represents goodwill and intangible impairment and the amortization of acquired intangibles.
(C)
Such tax effect is based upon the Company’s “Core Earnings” effective tax rate for the year. The net tax effect results primarily from
the exclusion of the permanent income tax impact of the equity forward contracts.
“Core Earnings”
In accordance with the Rules and Regulations of the Securities and Exchange Commission (“SEC”), we
prepare financial statements in accordance with generally accepted accounting principles in the United States
of America (“GAAP”). In addition to evaluating the Company’s GAAP-based financial information, manage-
ment evaluates the Company’s business segments on a basis that, as allowed under SFAS No. 131, “Disclo-
sures about Segments of an Enterprise and Related Information,” differs from GAAP. We refer to
management’s basis of evaluating our segment results as “Core Earnings” presentations for each business
segment and we refer to this information in our presentations with credit rating agencies and lenders. While
“Core Earnings” are not a substitute for reported results under GAAP, we rely on “Core Earnings” to manage
each operating segment because we believe these measures provide additional information regarding the
operational and performance indicators that are most closely assessed by management.
Our “Core Earnings” are not defined terms within GAAP and may not be comparable to similarly titled
measures reported by other companies. “Core Earnings” net income reflects only current period adjustments to
GAAP net income as described below. Unlike financial accounting, there is no comprehensive, authoritative
guidance for management reporting and as a result, our management reporting is not necessarily comparable
with similar information for any other financial institution. Our operating segments are defined by the products
and services they offer or the types of customers they serve, and they reflect the manner in which financial
information is currently evaluated by management. Intersegment revenues and expenses are netted within the
appropriate financial statement line items consistent with the income statement presentation provided to
9
10. management. Changes in management structure or allocation methodologies and procedures may result in
changes in reported segment financial information. A more detailed discussion of the differences between
GAAP and “Core Earnings” follows.
Limitations of “Core Earnings”
While GAAP provides a uniform, comprehensive basis of accounting, for the reasons described above,
management believes that “Core Earnings” are an important additional tool for providing a more complete
understanding of the Company’s results of operations. Nevertheless, “Core Earnings” are subject to certain
general and specific limitations that investors should carefully consider. For example, as stated above, unlike
financial accounting, there is no comprehensive, authoritative guidance for management reporting. Our “Core
Earnings” are not defined terms within GAAP and may not be comparable to similarly titled measures
reported by other companies. Unlike GAAP, “Core Earnings” reflect only current period adjustments to GAAP.
Accordingly, the Company’s “Core Earnings” presentation does not represent a comprehensive basis of
accounting. Investors, therefore, may not compare our Company’s performance with that of other financial
services companies based upon “Core Earnings.” “Core Earnings” results are only meant to supplement GAAP
results by providing additional information regarding the operational and performance indicators that are most
closely used by management, the Company’s board of directors, rating agencies and lenders to assess
performance.
Other limitations arise from the specific adjustments that management makes to GAAP results to derive
“Core Earnings” results. For example, in reversing the unrealized gains and losses that result from
SFAS No. 133, “Accounting for Derivative Instruments and Hedging Activities,” on derivatives that do not
qualify for “hedge treatment,” as well as on derivatives that do qualify but are in part ineffective because they
are not perfect hedges, we focus on the long-term economic effectiveness of those instruments relative to the
underlying hedged item and isolate the effects of interest rate volatility, changing credit spreads and changes
in our stock price on the fair value of such instruments during the period. Under GAAP, the effects of these
factors on the fair value of the derivative instruments (but not on the underlying hedged item) tend to show
more volatility in the short term. While our presentation of our results on a “Core Earnings” basis provides
important information regarding the performance of our Managed portfolio, a limitation of this presentation is
that we are presenting the ongoing spread income on loans that have been sold to a trust managed by us.
While we believe that our “Core Earnings” presentation presents the economic substance of our Managed loan
portfolio, it understates earnings volatility from securitization gains. Our “Core Earnings” results exclude
certain Floor Income, which is real cash income, from our reported results and therefore may understate
earnings in certain periods. Management’s financial planning and valuation of operating results, however, does
not take into account Floor Income because of its inherent uncertainty, except when it is economically hedged
through Floor Income Contracts.
Pre-Tax Differences between “Core Earnings” and GAAP
Our “Core Earnings” are the primary financial performance measures used by management to evaluate
performance and to allocate resources. Accordingly, financial information is reported to management on a
“Core Earnings” basis by reportable segment, as these are the measures used regularly by our chief operating
decision maker. Our “Core Earnings” are used in developing our financial plans and tracking results, and also
in establishing corporate performance targets and determining incentive compensation. Management believes
this information provides additional insight into the financial performance of the Company’s core business
activities. “Core Earnings” net income reflects only current period adjustments to GAAP net income, as
described in the more detailed discussion of the differences between “Core Earnings” and GAAP that follows,
which includes further detail on each specific adjustment required to reconcile our “Core Earnings” segment
presentation to our GAAP earnings.
1) Securitization Accounting: Under GAAP, certain securitization transactions in our Lending operating
segment are accounted for as sales of assets. Under “Core Earnings” for the Lending operating
segment, we present all securitization transactions on a “Core Earnings” basis as long-term non-
recourse financings. The upfront “gains” on sale from securitization transactions as well as ongoing
10
11. “servicing and securitization revenue” presented in accordance with GAAP are excluded from “Core
Earnings” and are replaced by the interest income, provisions for loan losses, and interest expense as
they are earned or incurred on the securitization loans. We also exclude transactions with our off-
balance sheet trusts from “Core Earnings” as they are considered intercompany transactions on a
“Core Earnings” basis.
2) Derivative Accounting: “Core Earnings” exclude periodic unrealized gains and losses arising
primarily in our Lending operating segment, and to a lesser degree in our Corporate and Other
reportable segment, that are caused primarily by the one-sided mark-to-market derivative valuations
prescribed by SFAS No. 133 on derivatives that do not qualify for “hedge treatment” under GAAP. In
our “Core Earnings” presentation, we recognize the economic effect of these hedges, which generally
results in any cash paid or received being recognized ratably as an expense or revenue over the hedged
item’s life. “Core Earnings” also exclude the gain or loss on equity forward contracts that under
SFAS No. 133, are required to be accounted for as derivatives and are marked-to-market through
earnings.
3) Floor Income: The timing and amount (if any) of Floor Income earned in our Lending operating
segment is uncertain and in excess of expected spreads. Therefore, we exclude such income from
“Core Earnings” when it is not economically hedged. We employ derivatives, primarily Floor Income
Contracts and futures, to economically hedge Floor Income. As discussed above in “Derivative
Accounting,” these derivatives do not qualify as effective accounting hedges, and therefore, under
GAAP, they are marked-to-market through the “gains (losses) on derivative and hedging activities,
net” line on the income statement with no offsetting gain or loss recorded for the economically hedged
items. For “Core Earnings,” we reverse the fair value adjustments on the Floor Income Contracts and
futures economically hedging Floor Income and include the amortization of net premiums received in
income.
4) Acquired Intangibles: Our “Core Earnings” exclude goodwill and intangible impairment and the
amortization of acquired intangibles.
11