1. Celanese Corporation
Investor Relations
Corporate News Release 1601 West LBJ Freeway
Dallas, Texas 75234-6034
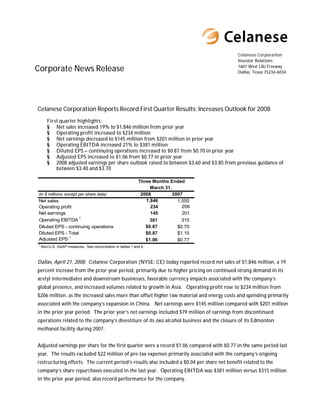
Celanese Corporation Reports Record First Quarter Results; Increases Outlook for 2008
First quarter highlights:
§ Net sales increased 19% to $1,846 million from prior year
§ Operating profit increased to $234 million
§ Net earnings decreased to $145 million from $201 million in prior year
§ Operating EBITDA increased 21% to $381 million
§ Diluted EPS – continuing operations increased to $0.87 from $0.70 in prior year
§ Adjusted EPS increased to $1.06 from $0.77 in prior year
§ 2008 adjusted earnings per share outlook raised to between $3.60 and $3.85 from previous guidance of
between $3.40 and $3.70
Three Months Ended
March 31,
2008 2007
(in $ millions, except per share data)
1,846
Net sales 1,555
206
234
Operating profit
Net earnings 145 201
1
Operating EBITDA 381 315
$0.87
Diluted EPS - continuing operations $0.70
Diluted EPS - Total $0.87 $1.15
1
Adjusted EPS $1.06 $0.77
1
Non-U.S. GAAP measures. See reconciliation in tables 1 and 6.
Dallas, April 21, 2008: Celanese Corporation (NYSE: CE) today reported record net sales of $1,846 million, a 19
percent increase from the prior year period, primarily due to higher pricing on continued strong demand in its
acetyl intermediates and downstream businesses, favorable currency impacts associated with the company’s
global presence, and increased volumes related to growth in Asia. Operating profit rose to $234 million from
$206 million, as the increased sales more than offset higher raw material and energy costs and spending primarily
associated with the company’s expansion in China. Net earnings were $145 million compared with $201 million
in the prior year period. The prior year’s net earnings included $79 million of earnings from discontinued
operations related to the company’s divestiture of its oxo alcohol business and the closure of its Edmonton
methanol facility during 2007.
Adjusted earnings per share for the first quarter were a record $1.06 compared with $0.77 in the same period last
year. The results excluded $22 million of pre-tax expenses primarily associated with the company’s ongoing
restructuring efforts. The current period’s results also included a $0.04 per share net benefit related to the
company’s share repurchases executed in the last year. Operating EBITDA was $381 million versus $315 million
in the prior year period, also record performance for the company.
2. Page 2 of 12
“Our first quarter performance illustrates the strength of our integrated business model, our solid operating
fundamentals, and our clear focus on growth and value creation,” said David Weidman, chairman and chief
executive officer. “Despite ongoing sluggish demand in certain North American consumer segments and high
raw material and energy costs across our businesses, Celanese delivered record results.”
Recent Highlights
§ Remains on track to commence additional operations at its Nanjing, China, integrated chemical complex
with four previously announced units to begin production within the next year.
§ Opened a customer application development center in Shanghai, China, to support growth in the region
for Ticona’s engineering polymers business.
§ The Celanese board of directors authorized the company to repurchase up to $400 million of its Series A
common stock. During the quarter, the company repurchased $60 million of its outstanding common
shares.
§ Upgraded by Moody’s Investors Service with a positive outlook and corporate credit rating of ‘Ba2’ from
‘Ba3.’
First Quarter Segment Overview
Advanced Engineered Materials
Advanced Engineered Materials continued to experience strong growth, particularly in Asia and non-
transportation applications, with the successful implementation of new product solutions. Net sales increased to
$294 million from $262 million in the same period last year, due to higher volumes and positive currency
impacts. The increase was partially offset by lower average pricing primarily due to product and geographic mix.
Operating profit decreased to $30 million from $36 million in the same period last year as the increased volume
was offset by continued high petroleum-based raw material and energy costs, as well as increased investment in
Ticona’s growth strategy in China. Operating EBITDA decreased to $60 million from $67 million in the prior
year period, primarily due to higher raw material and energy costs and lower earnings from its equity affiliates.
Consumer Specialties
Consumer Specialties continued to execute its strategy to provide higher, sustainable earnings. Net sales
increased five percent to $282 million compared with the same period last year, driven by higher pricing on
continued strong demand, sales from the Acetate Products Limited (APL) acquisition, which was completed in
2007, and positive currency impacts. The increase was partially offset by lower acetate flake volumes resulting
from the company’s strategic decision to shift flake production to its China ventures. Operating profit was $50
million, $2 million higher than the prior year period’s results, as the company continued to drive cost synergies
from the APL acquisition. Operating EBITDA increased to $65 million from $60 million in the same period last
year as the higher pricing and lower manufacturing costs offset significantly higher energy and raw material costs.
Industrial Specialties
Revitalization of the Industrial Specialties businesses is underway and delivering improved results. Net sales
increased to $365 million from $346 million in the same period last year, primarily driven by higher pricing on
continued strong demand and favorable currency impacts. The increase was partially offset by lower volumes
3. Page 3 of 12
primarily related to continued softness in North American housing and construction segments, elevated
European demand levels in 2007 prior to a German tax law change, and a strategic focus on higher value-added
applications. Operating profit was $17 million compared with $12 million in the prior year period as the higher
pricing more than offset higher raw material costs, primarily for vinyl acetate monomer, and the lower volumes.
Additionally, Industrial Specialties benefited from the positive impact of rebuilding inventory during the quarter
following a constrained supply in 2007. Operating EBITDA was $36 million compared with $26 million in the
first quarter of 2007.
Acetyl Intermediates
Acetyl Intermediates experienced significant sales and earnings growth from its strategic expansions in Asia and a
continued strong business environment for its products. Net sales were $1,096 million, a 31 percent increase
from the same period a year ago, driven by volume growth from its Nanjing acetic acid unit, which began
production in mid-2007, and higher pricing on continued strong demand for acetyl products across North
America, Europe and Asia. Operating profit increased to $177 million from $132 million and operating EBITDA
increased to $246 million from $174 million in the same period last year as volume and pricing more than offset
higher raw material and energy costs in the period. Increased dividends from the company’s Ibn Sina methanol
and MTBE cost affiliate also drove the improved operating EBITDA.
Taxes
The tax rate for adjusted earnings per share was 26 percent in the first quarter of 2008 compared with 28 percent
in the first quarter of 2007. The U.S. GAAP effective tax rate for continuing operations for the first quarter of
2008 was 33 percent compared with 29 percent in the first quarter of 2007. The higher effective tax rate is
primarily due to accounting accruals and the U.S. tax effect on increased foreign earnings and dividends, which
were partially offset by increased earnings in lower tax jurisdictions. The tax rate for adjusted earnings per share
is based upon the company’s previous guidance which did not include these items. Cash taxes for the first
quarter of 2008 were $30 million, approximately $41 million lower than the prior year period, primarily due to
the timing of tax benefits associated with the company’s recapitalization transaction in 2007.
Equity and Cost Investments
Earnings from equity investments and dividends from cost investments, which are reflected in the company’s
adjusted earnings and operating EBITDA, totaled $38 million in the first quarter, a $5 million increase from the
prior year period, as higher dividends from the company’s Ibn Sina cost affiliate offset lower earnings from the
Advanced Engineered Materials equity affiliates. Equity and cost investment dividends, which are included in
cash flows, were $71 million compared with $45 million in the prior year period.
Cash Flow
During the first quarter of 2008, the company generated $166 million in cash from operating activities versus $12
million in the prior year period, driven by strong business performance, lower cash taxes and lower cash used in
discontinued operations. During the quarter, the company repurchased $60 million of its outstanding common
shares and has an additional $340 million in authorized purchases remaining. Net debt at the end of the first
quarter was $2,841 million, an increase of $110 million from the end of the fourth quarter of 2007, primarily
driven by the use of cash for share repurchases and the foreign currency translation impact on non-U.S. dollar-
4. Page 4 of 12
denominated debt. Cash and cash equivalents at the end of the first quarter were $763 million versus $825
million at the end of the fourth quarter of 2007.
Outlook
Based on continued execution of its growth strategy across all of its businesses, a stronger pricing environment
for acetyls and continued global demand growth, the company increased its full year outlook for adjusted
earnings per share to between $3.60 and $3.85 from its previous guidance range of between $3.40 and $3.70. On
a comparable basis, 2007 results were $3.29 per share. The guidance is based on an adjusted tax rate of 26 percent
and an estimated year-end weighted average of 167 million diluted shares outstanding. The company also
increased its operating EBITDA guidance range to between $1,355 million and $1,415 million from its previous
range of between $1,290 million and $1,360 million.
“We continue to see challenges in North America, an overall slower European economy and continued high and
volatile raw material and energy costs; however, our global integrated business model continues to deliver strong
earnings growth,” Weidman said. “With our well-defined growth strategy, strong cash generation, and attractive
industry fundamentals, Celanese is positioned to deliver higher, sustainable earnings and create significant value
for our shareholders in 2008 and beyond.”
Contacts:
Investor Relations Media – U.S. Media - Europe
Mark Oberle Jeremy Neuhart Jens Kurth
Phone: +1 972 443 4464 Phone: +1 972 443 3750 Phone: +49 69 305 7137
Telefax: +1 972 443 8519 Telefax: +1 972 443 8519 Telefax: +49 69 305 36787
Mark.Oberle@celanese.com Jeremy.Neuhart@celanese.com J.Kurth@celanese.com
As a global leader in the chemicals industry, Celanese Corporation makes products essential to everyday living. Our
products, found in consumer and industrial applications, are manufactured in North America, Europe and Asia. Net
sales totaled $6.4 billion in 2007, with approximately 70% generated outside of North America. Known for
operational excellence and execution of its business strategies, Celanese delivers value to customers around the globe
with innovations and best-in-class technologies. Based in Dallas, Texas, the company employs approximately 8,400
employees worldwide. For more information on Celanese Corporation, please visit the company's website at
www.celanese.com.
Forward-Looking Statements
This release may contain “forward-looking statements,” which include information concerning the company’s plans, objectives, goals, strategies,
future revenues or performance, capital expenditures, financing needs and other information that is not historical information. When used in
this release, the words “outlook,” “forecast,” “estimates,” “expects,” “anticipates,” “projects,” “plans,” “intends,” “believes,” and variations of
such words or similar expressions are intended to identify forward-looking statements. All forward-looking statements are based upon current
expectations and beliefs and various assumptions. There can be no assurance that the company will realize these expectations or that these beliefs
will prove correct. There are a number of risks and uncertainties that could cause actual results to differ materially from the forward-looking
statements contained in this release. Numerous factors, many of which are beyond the company’s control, could cause actual results to differ
materially from those expressed as forward-looking statements. Certain of these risk factors are discussed in the company’s filings with the
Securities and Exchange Commission. Any forward-looking statement speaks only as of the date on which it is made, and the company
undertakes no obligation to update any forward-looking statements to reflect events or circumstances after the date on which it is made or to
reflect the occurrence of anticipated or unanticipated events or circumstances.
Reconciliation of Non-U.S. GAAP Measures to U.S. GAAP
This release reflects five performance measures, operating EBITDA, affiliate EBITDA, adjusted earnings per share, net debt and adjusted free cash
flow, as non-U.S. GAAP measures. The most directly comparable financial measure presented in accordance with U.S. GAAP in our consolidated
financial statements for operating EBITDA is operating profit; for affiliate EBITDA is equity in net earnings of affiliates; for adjusted earnings
per share is earnings per common share-diluted; for net debt is total debt; and for adjusted free cash flow is cash flow from operations.
5. Page 5 of 12
Use of Non-U.S. GAAP Financial Information
§ Operating EBITDA, a measure used by management to measure performance, is defined as operating profit from continuing
operations, plus equity in net earnings from affiliates, other income and depreciation and amortization, and further adjusted for other
charges and adjustments. We provide guidance on operating EBITDA and are unable to reconcile forecasted operating EBITDA to a
GAAP financial measure because a forecast of Other Charges and Adjustments is not practical. Our management believes operating
EBITDA is useful to investors because it is one of the primary measures our management uses for its planning and budgeting processes
and to monitor and evaluate financial and operating results. Operating EBITDA is not a recognized term under U.S. GAAP and does
not purport to be an alternative to operating profit as a measure of operating performance or to cash flows from operating activities as
a measure of liquidity. Because not all companies use identical calculations, this presentation of operating EBITDA may not be
comparable to other similarly titled measures of other companies. Additionally, operating EBITDA is not intended to be a measure of
free cash flow for management’s discretionary use, as it does not consider certain cash requirements such as interest payments, tax
payments and debt service requirements nor does it represent the amount used in our debt covenants.
§ Affiliate EBITDA, a measure used by management to measure performance of its equity investments, is defined as the proportional
operating profit plus the proportional depreciation and amortization of its equity investments. Affiliate EBITDA, including Celanese
Proportional Share of affiliate information on Table 8, is not a recognized term under U.S. GAAP and is not meant to be an
alternative to operating cash flow of the equity investments. The company has determined that it does not have sufficient ownership
for operating control of these investments to consider their results on a consolidated basis. The company believes that investors should
consider affiliate EBITDA when determining the equity investments’ overall value in the company.
§ Adjusted earnings per share is a measure used by management to measure performance. It is defined as net earnings (loss) available to
common shareholders plus preferred dividends, adjusted for other charges and adjustments, and divided by the number of basic
common shares, diluted preferred shares, and options valued using the treasury method. We provide guidance on an adjusted earnings
per share basis and are unable to reconcile forecasted adjusted earnings per share to a GAAP financial measure without unreasonable
effort because a forecast of Other Items is not practical. We believe that the presentation of this non-U.S. GAAP measure provides
useful information to management and investors regarding various financial and business trends relating to our financial condition
and results of operations, and that when U.S. GAAP information is viewed in conjunction with non-U.S. GAAP information, investors
are provided with a more meaningful understanding of our ongoing operating performance. This non-U.S. GAAP information is not
intended to be considered in isolation or as a substitute for U.S. GAAP financial information.
§ The tax rate used for adjusted earnings per share is the tax rate based on our first quarter guidance, less changes in uncertain tax
positions. We adjust this tax rate during the year only if there is a substantial change in our underlying operations; an updated
forecast would not necessarily result in a change to our tax rate used for adjusted earnings per share. The adjusted tax rate may differ
significantly from the tax rate used for U.S. GAAP reporting in any given reporting period. It is not practical to reconcile our
prospective adjusted tax rate to the actual U.S. GAAP tax rate in any future period.
§ Net debt is defined as total debt less cash and cash equivalents. We believe that the presentation of this non-U.S. GAAP measure
provides useful information to management and investors regarding changes to the company’s capital structure. Our management and
credit analysts use net debt to evaluate the company's capital structure and assess credit quality. This non-U.S. GAAP information is
not intended to be considered in isolation or as a substitute for U.S. GAAP financial information.
§ Adjusted free cash flow is defined as cash flow from operations less capital expenditures, other productive asset purchases, operating
cash from discontinued operations and certain other charges. We believe that the presentation of this non-U.S. GAAP measure
provides useful information to management and investors regarding changes to the company’s cash flow. Our management and credit
analysts use adjusted free cash flow to evaluate the company’s liquidity and assess credit quality. This non-U.S. GAAP information is
not intended to be considered in isolation or as a substitute for U.S. GAAP financial information.
Results Unaudited
The results presented in this release, together with the adjustments made to present the results on a comparable basis, have not been audited and
are based on internal financial data furnished to management. Quarterly results should not be taken as an indication of the results of operations
to be reported for any subsequent period or for the full fiscal year.
6. Page 6 of 12
Preliminary Consolidated Statements of Operations- Unaudited
Three Months Ended
March 31,
(in $ millions, except per share data) 2008 2007
1,555
Net sales 1,846
Cost of sales (1,428) (1,196)
Gross profit 418 359
Selling, general and administrative expenses (116)
(136)
1
Amortization of Intangibles (19) (18)
Research and development expenses (17)
(23)
Other (charges) gains, net (16) (1)
Foreign exchange gain, net -
7
Gain (loss) on disposition of assets, net 3 (1)
Operating profit 234 206
Equity in net earnings of affiliates 18
10
Interest expense (67) (72)
Interest income 14
9
Dividend income - cost investments 28 15
Other income (expense), net (10)
4
Earnings from continuing operations
before tax and minority interests 218 171
Income tax provision (49)
(73)
Earnings from continuing operations
before minority interests 145 122
Minority interests -
-
Earnings from continuing operations 145 122
Earnings from discontinued operations:
Earnings from operation of discontinued operations 43
-
31
Gain on disposal of discontinued operations -
5
Income tax benefit -
79
Earnings from discontinued operations -
Net earnings 145 201
Cumulative preferred stock dividends (2)
(3)
Net earnings available to common
shareholders 142 199
Earnings per common share - basic:
Continuing operations $0.93 $0.75
Discontinued operations 0.50
-
Net earnings available to common shareholders $0.93 $1.25
Earnings per common share - diluted:
Continuing operations $0.70
$0.87
Discontinued operations - 0.45
Net earnings available to common shareholders $0.87 $1.15
Weighted average shares - basic 152.0 159.3
174.4
Weighted average shares - diluted 167.3
1
Customer related intangibles
7. Page 7 of 12
Preliminary Consolidated Balance Sheets - Unaudited
March 31, December 31,
(in $ millions) 2008 2007
ASSETS
Current assets:
Cash and cash equivalents 825
763
Receivables:
Trade - third party and affiliates, net 1,009
1,079
Other 444 437
Inventories 636
709
Deferred income taxes 69 70
Other assets 86
66
Total current assets 3,130 3,063
Investments 818 814
Property, plant and equipment, net 2,362
2,477
Deferred income taxes 12 10
Other assets 518
531
Goodwill 890 866
Intangible assets, net 425
457
Total assets 8,315 8,058
LIABILITIES AND SHAREHOLDERS' EQUITY
Current liabilities:
Short-term borrowings and current
installments of long-term debt - third party and affiliates 272
253
Trade payables - third parties and affiliates 822 818
Other liabilities 888
931
Deferred income taxes 30 30
Income taxes payable 23
48
Total current liabilities 2,084 2,031
Long-term debt 3,351 3,284
Deferred income taxes 265
286
Income taxes payable 239 220
Benefit obligations 696
686
Other liabilities 544 495
Minority interests 5
6
Shareholders' equity:
-
Preferred stock -
-
-
Common stock
(403)
Treasury stock, at cost (463)
Additional paid-in capital 483 469
Retained earnings 799
935
Accumulated other comprehensive income (loss), net 164 197
Total shareholders' equity 1,119 1,062
Total liabilities and shareholders' equity 8,315 8,058
8. Page 8 of 12
Table 1
Segment Data and Reconciliation of Operating Profit (Loss) to Operating EBITDA -
a Non-U.S. GAAP Measure
Three Months Ended
March 31,
(in $ millions) 2008 2007
Net Sales
294
Advanced Engineered Materials 262
282
Consumer Specialties 269
365
Industrial Specialties 346
1,096
Acetyl Intermediates 839
1
Other Activities - 1
(191)
Intersegment eliminations (162)
Total 1,846 1,555
Operating Profit (Loss)
30
Advanced Engineered Materials 36
50
Consumer Specialties 48
17
Industrial Specialties 12
177
Acetyl Intermediates 132
1
Other Activities (40) (22)
Total 234 206
Equity Earnings and Other Income/(Expense) 2
9
Advanced Engineered Materials 14
-
Consumer Specialties -
-
Industrial Specialties -
29
Acetyl Intermediates 5
1
Other Activities 4 4
Total 42 23
Other Charges and Other Adjustments 3
1
Advanced Engineered Materials -
1
Consumer Specialties 1
5
Industrial Specialties -
8
Acetyl Intermediates 13
1
Other Activities 7 4
Total 22 18
Depreciation and Amortization Expense
20
Advanced Engineered Materials 17
14
Consumer Specialties 11
14
Industrial Specialties 14
32
Acetyl Intermediates 24
1
Other Activities 2
3
Total 83 68
Operating EBITDA
60
Advanced Engineered Materials 67
65
Consumer Specialties 60
36
Industrial Specialties 26
246
Acetyl Intermediates 174
1
Other Activities (26) (12)
Total 381 315
1
Other Activities primarily includes corporate selling, general and administrative expenses and the results from captive insurance companies.
2
Includes equity earnings from affiliates, dividends from cost investments and other income/(expense).
3
Excludes adjustments to minority interest, net interest, taxes, depreciation, amortization and discontinued operations (See Table 7).
9. Page 9 of 12
Table 2
Factors Affecting First Quarter 2008 Segment Net Sales Compared to First Quarter 2007
Other 1
(in percent) Volume Price Currency Total
Advanced Engineered Materials 6% -2% 8% 0% 12%
Consumer Specialties -10% 5% 3% 7% 5%
Industrial Specialties -11% 10% 7% -1% 5%
Acetyl Intermediates 8% 17% 6% 0% 31%
Total Company 1% 12% 7% -1% 19%
1
Primarily represents net sales from APL (Acetate), divestiture of AT Plastics Films business and captive insurance companies (Total Company).
Table 3
Cash Flow Information
Three Months Ended
March 31,
(in $ millions) 2008 2007
Net cash provided by operating activities 166 12
(138)
Net cash provided by (used in) investing activities 325
(112)
Net cash used in financing activities (17)
Exchange rate effects on cash 22 4
825
Cash and cash equivalents at beginning of period 791
Cash and cash equivalents at end of period 763 1,115
Table 4
Cash Dividends Received
Three Months Ended
March 31,
(in $ millions) 2008 2007
Dividends from equity investments 43 30
28
Dividends from cost investments 15
Total 71 45
Table 5
Net Debt - Reconciliation of a Non-U.S. GAAP Measure
March 31, December 31,
(in $ millions) 2008 2007
Short-term borrowings and current
installments of long-term debt - third party and affiliates 253 272
3,351
Long-term debt 3,284
Total debt 3,604 3,556
763
Less: Cash and cash equivalents 825
Net Debt 2,841 2,731
10. Page 10 of 12
Table 6
Adjusted Earnings Per Share - Reconciliation of a Non-U.S. GAAP Measure
Three Months Ended
March 31,
2008 2007
(in $ millions, except per share data)
Earnings from continuing operations
171
before tax and minority interests 218
Non-GAAP Adjustments:
1
Other charges and other adjustments 18
22
(2)
Refinancing costs -
Adjusted earnings from continuing operations
before tax and minority interests 240 187
2
Income tax provision on adjusted earnings (52)
(62)
-
Minority interests -
Adjusted earnings from continuing operations 178 135
Preferred dividends (3) (2)
Adjusted net earnings available to common shareholders 175 133
Add back: Preferred dividends 3 2
Adjusted net earnings for adjusted EPS 178 135
Diluted shares (millions)
Weighted average shares outstanding 159.3
152.0
Assumed conversion of Preferred Shares 12.0 12.0
Assumed conversion of Restricted Stock 0.5 -
3.1
Assumed conversion of stock options 2.8
Total diluted shares 167.3 174.4
Adjusted EPS $ 1.06 $ 0.77
1
See Table 7 for details
2
The adjusted tax rate for the three months ended March 31, 2008 is 26% based on the forecasted adjusted tax rate for 2008.
11. Page 11 of 12
Table 7
Reconciliation of Other Charges and Other Adjustments
Other Charges:
Three Months Ended
March 31,
(in $ millions) 2008 2007
Employee termination benefits 7 -
Plant/office closures 7 -
Ticona Kelsterbach plant relocation 2 -
1
Other -
Total 16 1
Other Adjustments: 1
Three Months Ended Income
March 31, Statement
Classification
(in $ millions) 2008 2007
-
Ethylene pipeline exit costs 10 Other income/expense, net
9
Business optimization 2 SG&A
Ticona Kelsterbach plant relocation (2) - Cost of Sales
(1)
Other 5 Various
6 17
Total
22 18
Total other charges and other adjustments
1
These items are included in net earnings but not included in other charges.
12. Page 12 of 12
Table 8
Equity Affiliate Preliminary Results - Total - Unaudited
Three Months Ended
(in $ millions) March 31,
2008 2007
Net Sales
1
Ticona Affiliates 355 307
2
Infraserv 548 342
Total 903 649
Operating Profit
Ticona Affiliates 33 44
Infraserv 19 17
Total 52 61
Depreciation and Amortization
Ticona Affiliates 22 14
Infraserv 27 19
Total 49 33
Affiliate EBITDA3
Ticona Affiliates 55 58
Infraserv 46 36
Total 101 94
Net Income
Ticona Affiliates 30
19
Infraserv 38 13
Total 57 43
Net Debt
Ticona Affiliates 185 160
Infraserv 325 (14)
Total 510 146
Equity Affiliate Preliminary Results - Celanese Proportional Share - Unaudited4
Three Months Ended
(in $ millions) March 31,
2008 2007
Net Sales
Ticona Affiliates 142
163
Infraserv 176 120
Total 339 262
Operating Profit
Ticona Affiliates 15 21
Infraserv 6 5
Total 21 26
Depreciation and Amortization
Ticona Affiliates 10 6
Infraserv 9 7
Total 19 13
Affiliate EBITDA3
Ticona Affiliates 27
25
Infraserv 15 12
Total 40 39
Equity in net earnings of affiliates (as reported on the Income Statement)
Ticona Affiliates 14
9
Infraserv 1 4
Total 10 18
Affiliate EBITDA in excess of Equity in net earnings of affiliates5
Ticona Affiliates 16 13
Infraserv 14 8
Total 30 21
Net Debt
Ticona Affiliates 73
85
Infraserv 102 (5)
Total 187 68
1
Ticona Affiliates includes PolyPlastics (45% ownership), Korean Engineering Plastics (50%) and Fortron Industries(50%)
2
Infraserv includes Infraserv Entities valued as equity investments (Infraserv Höchst Group - 31% ownership, Infraserv Gendorf - 39% and Infraserv Knapsack 27%)
3
Affiliate EBITDA is the sum of Operating Profit and Depreciation and Amortization, a non-U.S. GAAP measure
4
Calculated as the product of figures from the above table times Celanese ownership percentage
5
Product of Celanese proportion of Affiliate EBITDA less Equity in net earnings of affiliates; not included in Celanese operating EBITDA