(INDIRA) Call Girl Mumbai Call Now 8250077686 Mumbai Escorts 24x7
RYDERFINAL 3QTables
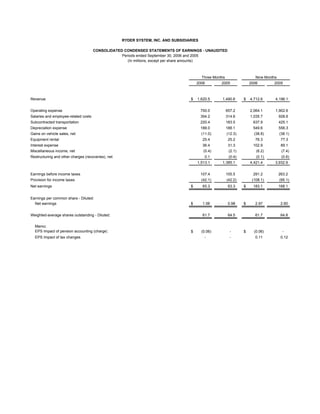
1. RYDER SYSTEM, INC. AND SUBSIDIARIES
CONSOLIDATED CONDENSED STATEMENTS OF EARNINGS - UNAUDITED
Periods ended September 30, 2006 and 2005
(In millions, except per share amounts)
Three Months Nine Months
2006 2005 2006 2005
Revenue $ 1,620.5 1,490.6 $ 4,712.6 4,196.1
Operating expense 700.0 657.2 2,064.1 1,902.6
Salaries and employee-related costs 354.2 314.6 1,035.7 928.6
Subcontracted transportation 220.4 183.5 637.9 425.1
Depreciation expense 188.0 188.1 549.6 556.3
Gains on vehicle sales, net (11.0) (12.3) (38.8) (38.1)
Equipment rental 25.4 25.2 76.3 77.3
Interest expense 36.4 31.3 102.9 89.1
Miscellaneous income, net (0.4) (2.1) (6.2) (7.4)
Restructuring and other charges (recoveries), net 0.1 (0.4) (0.1) (0.6)
1,513.1 1,385.1 4,421.4 3,932.9
Earnings before income taxes 107.4 105.5 291.2 263.2
Provision for income taxes (42.1) (42.2) (108.1) (95.1)
Net earnings $ 65.3 63.3 $ 183.1 168.1
Earnings per common share - Diluted:
Net earnings $ 1.06 0.98 $ 2.97 2.60
Weighted-average shares outstanding - Diluted: 61.7 64.5 61.7 64.8
Memo:
EPS Impact of pension accounting (charge) $ (0.06) - $ (0.06) -
EPS Impact of tax changes - - 0.11 0.12
2. RYDER SYSTEM, INC. AND SUBSIDIARIES
CONSOLIDATED CONDENSED BALANCE SHEETS
PRELIMINARY AND SUBJECT TO RECLASSIFICATION
(Dollars in millions)
(unaudited)
September 30, December 31,
2006 2005
Assets:
Cash and cash equivalents $ 128.1 128.7
Other current assets 1,249.8 1,035.1
Revenue earning equipment, net 4,303.9 3,794.4
Operating property and equipment, net 497.5 486.8
Other assets 548.9 588.3
$ 6,728.2 6,033.3
Liabilities and shareholders' equity:
Short-term debt / current portion of long-term debt $ 389.3 269.4
Other current liabilities 1,044.6 984.0
Long-term debt 2,242.9 1,916.0
Other non-current liabilities (including deferred income taxes) 1,406.0 1,336.4
Shareholders' equity 1,645.4 1,527.5
$ 6,728.2 6,033.3
SELECTED KEY RATIOS
September 30, December 31,
2006 2005
Debt to equity 160% 143%
Total obligations to equity (a) * 166% 151%
Twelve months ended September 30,
2006 2005
Return on average shareholders' equity (b) 15.3% 15.1%
Return on average assets (b) 3.9% 4.0%
Return on capital * 8.0% 7.7%
(a) Total obligations represent debt plus off-balance sheet equipment obligations.
(b) Includes discontinued operations and the effect of accounting changes.
* Non-GAAP financial measure; see reconciliation to closest GAAP financial measure included within this
release.
Note: Certain prior period amounts have been reclassified to conform to current year presentation.
3. RYDER SYSTEM, INC. AND SUBSIDIARIES
BUSINESS SEGMENT REVENUE AND EARNINGS - UNAUDITED
Periods ended September 30, 2006 and 2005
(Dollars in millions)
Three Months Nine Months
2006 2005 B(W) 2006 2005 B(W)
Revenue:
Fleet Management Solutions:
Full service lease $ 464.3 447.4 4% $ 1,375.8 1,334.6 3%
Contract maintenance 37.3 34.0 10% 104.0 101.9 2%
Contract-related maintenance 49.3 47.6 4% 144.4 143.5 1%
Commercial rental 181.5 183.4 (1%) 502.3 511.0 (2%)
Other 17.7 16.2 9% 53.2 50.3 6%
Fuel 309.9 282.2 10% 911.0 763.7 19%
Total Fleet Management Solutions 1,060.0 1,010.8 5% 3,090.7 2,905.0 6%
Supply Chain Solutions 513.8 433.4 19% 1,485.4 1,155.1 29%
Dedicated Contract Carriage 146.4 139.0 5% 428.6 400.8 7%
Eliminations (99.7) (92.6) (8%) (292.1) (264.8) (10%)
Total revenue $ 1,620.5 1,490.6 9% $ 4,712.6 4,196.1 12%
Operating Revenue: *
Fleet Management Solutions $ 750.1 728.6 3% $ 2,179.7 2,141.3 2%
Supply Chain Solutions 299.1 254.3 18% 862.8 741.6 16%
Dedicated Contract Carriage 140.7 134.6 5% 413.3 389.2 6%
Eliminations (50.3) (49.0) (3%) (147.6) (147.1) -
Total operating revenue $ 1,139.6 1,068.5 7% $ 3,308.2 3,125.0 6%
Business segment earnings:
Earnings before income taxes:
Fleet Management Solutions $ 103.7 102.6 1% $ 273.5 262.4 4%
Supply Chain Solutions 16.4 10.6 54% 45.1 25.4 77%
Dedicated Contract Carriage 11.7 9.2 27% 31.4 24.8 27%
Eliminations (8.6) (8.2) (4%) (24.6) (23.3) (6%)
123.2 114.2 8% 325.4 289.3 12%
Unallocated Central Support Services (9.8) (9.1) (8%) (28.4) (26.7) (6%)
Earnings before restructuring and
other recoveries, net and income taxes 113.4 105.1 8% 297.0 262.6 13%
Restructuring and other (charges) recoveries, net and pension (charge) (6.0) 0.4 NA (5.8) 0.6 NA
Earnings before income taxes 107.4 105.5 2% 291.2 263.2 11%
Provision for income taxes (42.1) (42.2) - (108.1) (95.1) (14%)
Net earnings $ 65.3 63.3 3% $ 183.1 168.1 9%
* Non-GAAP financial measure
Note: Certain prior period amounts have been reclassified to conform to current year presentation.
Amounts may not recalculate due to rounding.
4. RYDER SYSTEM, INC. AND SUBSIDIARIES
BUSINESS SEGMENT INFORMATION - UNAUDITED
Periods ended September 30, 2006 and 2005
(Dollars in millions)
Three Months Nine Months
2006 2005 B(W) 2006 2005 B(W)
Fleet Management Solutions
Total revenue $ 1,060.0 1,010.8 5% $ 3,090.7 2,905.0 6%
Fuel revenue (309.9) (282.2) 10% (911.0) (763.7) 19%
Operating revenue * $ 750.1 728.6 3% $ 2,179.7 2,141.3 2%
Segment earnings before income taxes $ 103.7 102.6 1% $ 273.5 262.4 4%
Earnings before income taxes as % of total revenue 9.8% 10.1% 8.9% 9.0%
Earnings before income taxes as % of operating revenue * 13.8% 14.1% 12.5% 12.3%
Supply Chain Solutions
Total revenue $ 513.8 433.4 19% $ 1,485.4 1,155.1 29%
Subcontracted transportation (214.7) (179.1) 20% (622.6) (413.5) 51%
Operating revenue * $ 299.1 254.3 18% $ 862.8 741.6 16%
Segment earnings before income taxes $ 16.4 10.6 54% $ 45.1 25.4 77%
Earnings before income taxes as % of total revenue 3.2% 2.4% 3.0% 2.2%
Earnings before income taxes as % of operating revenue * 5.5% 4.2% 5.2% 3.4%
Memo: Fuel costs $ 26.6 23.8 (12%) $ 79.3 66.5 (19%)
Dedicated Contract Carriage
Total revenue $ 146.4 139.0 5% $ 428.6 400.8 7%
Subcontracted transportation (5.7) (4.4) 30% (15.3) (11.6) 31%
Operating revenue * $ 140.7 134.6 5% $ 413.3 389.2 6%
Segment earnings before income taxes $ 11.7 9.2 27% $ 31.4 24.8 27%
Earnings before income taxes as % of total revenue 8.0% 6.6% 7.3% 6.2%
Earnings before income taxes as % of operating revenue * 8.3% 6.8% 7.6% 6.4%
Memo: Fuel costs $ 27.8 24.9 (12%) $ 80.4 67.7 (19%)
* Non-GAAP financial measure
Note: Certain prior period amounts have been reclassified to conform to current year presentation.
Amounts may not recalculate due to rounding.
5. RYDER SYSTEM, INC. AND SUBSIDIARIES
NON-GAAP FINANCIAL MEASURE RECONCILIATIONS - PRELIMINARY AND UNAUDITED
(In millions, except per share amounts)
OPERATING REVENUE RECONCILIATION Three Months Nine Months
2006 2005 2006 2005
Total revenue $ 1,620.5 1,490.6 $ 4,712.6 4,196.1
Fuel services and subcontracted transportation revenue (530.3) (465.7) (1,548.9) (1,188.8)
Fuel eliminations 49.4 43.6 144.5 117.7
Operating revenue * $ 1,139.6 1,068.5 $ 3,308.2 3,125.0
CASH FLOW RECONCILIATION Nine months ended September 30,
2006 2005
Net cash provided by operating activities $ 611.6 470.8
Proceeds from sales (primarily revenue earning equipment) 256.9 252.6
Collections of direct finance leases 51.3 49.7
Other investing, net 2.1 -
Total cash generated * 921.9 773.1
Capital expenditures (1,171.6) (1,105.8)
Acquisitions (4.1) (15.1)
Free cash flow * $ (253.8) (347.8)
DEBT TO EQUITY RECONCILIATION September 30, December 31,
2006 % to Equity % to Equity
2005
On-balance sheet debt $ 2,632.2 160% 2,185.4 143%
Off-balance sheet debt - PV of minimum lease payments and guaranteed
residual values under operating leases for vehicles (a) 91.7 117.0
Total obligations * $ 2,723.9 166% 2,302.4 151%
NET EARNINGS RECONCILIATION Three Months Nine Months
2006 2005 2006 2005
Net earnings $ 65.3 63.3 $ 183.1 168.1
Excluding tax changes and pension charge 3.5 - (3.2) (7.6)
Net earnings excluding tax changes and pension charge * $ 68.8 63.3 $ 179.9 160.5
EPS RECONCILIATION Three Months Nine Months
2006 2005 2006 2005
Earnings per share $ 1.06 0.98 $ 2.97 2.60
Excluding tax changes and pension charge 0.06 - (0.05) (0.12)
Earnings per share excluding tax changes and pension charge * $ 1.12 0.98 $ 2.91 2.48
RETURN ON CAPITAL RECONCILIATION Twelve months ended September 30,
2006 2005
Net earnings (12-month rolling period) $ 241.9 230.8
- Discontinued operations (1.7) -
+ Cumulative effect of changes in accounting principles 2.4 -
+ Income taxes 142.4 118.3
Adjusted earnings before income taxes 385.0 349.1
+ Adjusted interest expense (b) 140.4 120.8
- Adjusted income taxes (c) (202.8) (181.9)
= Adjusted net earnings for ROC (numerator) $ 322.6 288.0
Average total debt $ 2,349.6 2,035.3
+ Average off-balance sheet debt 110.4 160.4
+ Average adjusted total shareholders' equity (d) 1,577.4 1,530.6
= Adjusted average total capital (denominator) $ 4,037.4 3,726.3
Adjusted ROC * 8.0% 7.7%
Notes:
(a) Discounted at the incremental borrowing rate at lease inception.
(b) Interest expense includes implied interest on off-balance sheet vehicle obligations.
(c) Income taxes were calculated using the effective income tax rate for the period exclusive of
tax benefits recognized through September 30, 2006 and 2005.
(d) Represents shareholders' equity adjusted for discontinued operations, accounting changes and tax
benefits in those periods.
* Non-GAAP financial measure
Earnings per share amounts are calculated independently for each component and may not be additive due to rounding.
Certain prior period amounts have been reclassified to conform to current year presentation.