Call Girls Koregaon Park Call Me 7737669865 Budget Friendly No Advance Booking
tribune earnings_q3_01_tables
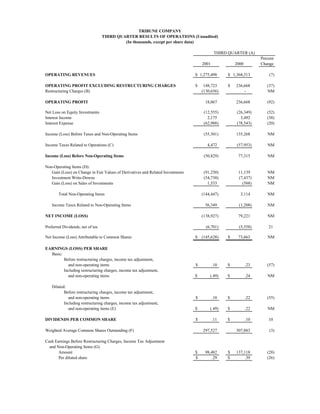
1. TRIBUNE COMPANY
THIRD QUARTER RESULTS OF OPERATIONS (Unaudited)
(In thousands, except per share data)
THIRD QUARTER (A)
Percent
2001 2000 Change
OPERATING REVENUES $ 1,275,498 $ 1,368,313 (7)
OPERATING PROFIT EXCLUDING RESTRUCTURING CHARGES $ 148,723 $ 236,668 (37)
Restructuring Charges (B) (130,656) - NM
OPERATING PROFIT 18,067 236,668 (92)
Net Loss on Equity Investments (12,555) (26,349) (52)
Interest Income 2,175 3,492 (38)
Interest Expense (62,988) (78,543) (20)
Income (Loss) Before Taxes and Non-Operating Items (55,301) 135,268 NM
Income Taxes Related to Operations (C) 4,472 (57,953) NM
Income (Loss) Before Non-Operating Items (50,829) 77,315 NM
Non-Operating Items (D):
Gain (Loss) on Change in Fair Values of Derivatives and Related Investments (91,250) 11,139 NM
Investment Write-Downs (54,730) (7,437) NM
Gain (Loss) on Sales of Investments 1,533 (588) NM
Total Non-Operating Items (144,447) 3,114 NM
Income Taxes Related to Non-Operating Items 56,349 (1,208) NM
NET INCOME (LOSS) (138,927) 79,221 NM
Preferred Dividends, net of tax (6,701) (5,558) 21
Net Income (Loss) Attributable to Common Shares $ (145,628) $ 73,663 NM
EARNINGS (LOSS) PER SHARE
Basic:
Before restructuring charges, income tax adjustment,
and non-operating items $ .10 $ .23 (57)
Including restructuring charges, income tax adjustment,
and non-operating items $ (.49) $ .24 NM
Diluted:
Before restructuring charges, income tax adjustment,
and non-operating items $ .10 $ .22 (55)
Including restructuring charges, income tax adjustment,
and non-operating items (E) $ (.49) $ .22 NM
DIVIDENDS PER COMMON SHARE $ .11 $ .10 10
Weighted Average Common Shares Outstanding (F) 297,527 307,883 (3)
Cash Earnings Before Restructuring Charges, Income Tax Adjustment
and Non-Operating Items (G)
Amount $ 98,482 $ 137,118 (28)
Per diluted share $ .29 $ .39 (26)
2. (A) 2001 quarter: July 2, 2001 to Sept. 30, 2001. (13 weeks)
2000 quarter: June 26, 2000 to Sept. 24, 2000. (13 weeks)
(B) During the second quarter of 2001, the Company announced a voluntary retirement program. In addition, various
other workforce reduction initiatives have been implemented throughout the organization. In the third quarter of
2001, the Company recorded pretax restructuring charges of $130.7 million for these initiatives, which reduced
diluted earnings per share by $.26.
(C) For the third quarter of 2001, income taxes related to operations consisted of the following:
Tax expense on third quarter income before non-operating items
and restructuring charges at 50.32% $ (37,919)
Effective tax rate adjustment (1) (8,578)
Tax benefit on restructuring charges at 39.01% 50,969
Income taxes related to operations $ 4,472
(1) The estimated effective tax rate for the full year 2001, excluding restructuring charges and non-operating items,
rose to 50.32% at the end of the third quarter from 47.25% at the end of the second quarter 2001. The increase in
the rate was attributable to lower projected earnings for full year 2001 while non-deductible expenses (mainly
amortization of goodwill) did not change. As a result of the higher tax rate, third quarter income tax expense
included a catch-up adjustment of $8.6 million for the impact of this higher rate on earnings in the first half of
2001. This adjustment reduced third quarter 2001 diluted earnings per share by $.03.
(D) The third quarter of 2001 included the following non-operating items:
Pretax Diluted
Gain (Loss) EPS
Net change in fair values of PHONES and DECS derivatives and related
AOL Time Warner (quot;AOLquot;) and Mattel shares $ (91,250) $ (.19)
Investment write-downs (54,730) (.12)
Sale of investments 1,533 .01
Total non-operating items $ (144,447) $ (.30)
The third quarter of 2000 included the following non-operating items:
Pretax Diluted
Gain (Loss) EPS
Net change in fair values of PHONES, DECS, PEPS and AOL collar
derivatives and related AOL and Mattel shares $ 11,139 $ .02
Investment write-downs (7,437) (.02)
Sale of investments (588) -
Total non-operating items $ 3,114 $ -
3. (E) For the third quarter of 2001, the Company's stock options and convertible securities were not included in the
calculation of diluted EPS because their effects were antidilutive.
For 2000, diluted EPS is computed assuming that the Series B convertible preferred shares and the LYONs
debt securities were converted into common shares. Also, weighted average common shares outstanding
was adjusted for the dilutive effect of stock options. The Company has certain other convertible securities which
were not included in the calculation of diluted EPS because their effects are antidilutive. Following is the calculation
of diluted EPS for the third quarter:
Third Quarter
2001 2000
Net income (loss) $ (138,927) $ 79,221
Additional ESOP contribution required assuming Series B
preferred shares were converted, net of tax - (2,730)
Dividends for Series B, C, D-1, and D-2 preferred stock (6,701) (2,014)
LYONs interest expense, net of tax - 1,520
Adjusted net income (loss) $ (145,628) $ 75,997
Weighted average common shares outstanding 297,527 307,883
Assumed conversion of Series B preferred shares into common - 19,405
Assumed exercise of stock options, net of common
shares assumed repurchased - 5,369
Assumed conversion of LYONs debt securities - 6,838
Adjusted weighted average common
shares outstanding 297,527 339,495
Diluted earnings (loss) per share $ (.49) $ .22
(F) The number of common shares outstanding, in thousands, at Sept. 30, 2001 was 297,772.
(G) Cash earnings was computed as net income before restructuring charges, income tax adjustment and non-operating items,
plus amortization of goodwill and other intangible assets. The calculations are summarized as follows:
Third Quarter 2001
Amount Diluted EPS
Net income before restructuring charges, income tax adjustment,
and non-operating items $ 37,436 $ .10
Amortization of intangible assets 61,046 .19
Cash earnings $ 98,482 $ .29
Third Quarter 2000
Amount Diluted EPS
Net income before non-operating items $ 77,315 $ .22
Amortization of intangible assets 59,803 .17
Cash earnings $ 137,118 $ .39
4. TRIBUNE COMPANY
THREE QUARTERS RESULTS OF OPERATIONS (Unaudited)
(In thousands, except per share data)
THREE QUARTERS (A)
Percent
2001 2000 Change
OPERATING REVENUES $ 3,935,509 $ 3,438,237 14
OPERATING PROFIT EXCLUDING RESTRUCTURING CHARGES $ 590,128 $ 710,169 (17)
Restructuring Charges (B) (145,000) - NM
OPERATING PROFIT 445,128 710,169 (37)
Net Loss on Equity Investments (48,417) (62,513) (23)
Interest Income 6,176 22,635 (73)
Interest Expense (193,128) (169,580) 14
Income from Continuing Operations Before Taxes and Non-Operating Items 209,759 500,711 (58)
Income Taxes Related to Operations (121,950) (207,137) (41)
Minority Interest Expense Related to Continuing Operations, net of tax (C) - (14,494) (100)
Income from Continuing Operations Before Non-Operating Items 87,809 279,080 (69)
Non-Operating Items (D):
Loss on Change in Fair Values of Derivatives and Related Investments (49,487) (55,164) (10)
Investment Write-Downs (89,318) (14,437) NM
Gain on Sales of Investments 1,975 59,066 (97)
Total Non-Operating Items (136,830) (10,535) NM
Income Taxes Related to Non-Operating Items 53,377 3,979 NM
Minority Interest Expense Related to Non-Operating Item, net of tax (C) - (1,841) (100)
Income from Continuing Operations 4,356 270,683 (98)
Loss from Discontinued Operations, net of tax (E) - (86,015) (100)
NET INCOME 4,356 184,668 (98)
Preferred Dividends, net of tax (20,100) (16,172) 24
Net Income (Loss) Attributable to Common Shares $ (15,744) $ 168,496 NM
5. EARNINGS (LOSS) PER SHARE
Basic:
From continuing operations
Before restructuring charges and non-operating items $ .52 $ 1.01 (49)
Including restructuring charges and non-operating items $ (.05) $ .97 NM
Discontinued operations - (.32) (100)
Total $ (.05) $ .65 NM
Diluted:
From continuing operations
Before restructuring charges and non-operating items $ .50 $ .94 (47)
Including restructuring charges and non-operating items $ (.05) $ .91 NM
Discontinued operations - (.30) (100)
Total (F) $ (.05) $ .61 NM
DIVIDENDS PER COMMON SHARE $ .33 $ .30 10
Weighted Average Common Shares Outstanding (G) 298,472 261,191 14
Cash Earnings from Continuing Operations Before Restructuring Charges
and Non-Operating Items (H)
Amount $ 356,634 $ 397,827 (10)
Per diluted share $ 1.05 $ 1.35 (22)
6. (A) 2001 first three quarters: January 1, 2001 to Sept. 30, 2001. (39 weeks)
2000 first three quarters: December 27, 1999 to Sept. 24, 2000. (39 weeks)
Times Mirror operating results are included beginning on April 17, 2000.
(B) During the second quarter of 2001, the Company announced a voluntary retirement program. In addition, various
other workforce reduction initiatives have been implemented throughout the organization. In the first three
quarters of 2001, the Company recorded pretax restructuring charges of $145.0 million ($88.4 million after-tax) for
these initiatives, which reduced diluted earnings per share by $.28.
(C) Minority interest expense was recorded for the 60.6% of Times Mirror not owned by Tribune from
April 17 through June 11, 2000.
(D) The first three quarters of 2001 included the following non-operating items:
Pretax Diluted
Gain (Loss) EPS
Net change in fair values of PHONES, DECS, and PEPS derivatives and
related AOL Time Warner (quot;AOLquot;) and Mattel shares (1Q, 2Q & 3Q) $ (49,487) $ (.10)
Investment write-downs (2Q & 3Q) (89,318) (.18)
Sale of investments (1Q, 2Q & 3Q) 1,975 .01
Total non-operating items $ (136,830) $ (.27)
The first three quarters of 2000 included the following non-operating items:
Pretax Diluted
Gain (Loss) EPS
Net change in fair values of PHONES, DECS, PEPS and AOL collar
derivatives and related AOL and Mattel shares (1Q, 2Q, & 3Q) $ (55,164) $ (.12)
Investment write-downs (2Q & 3Q) (14,437) (.03)
Sale of AOL common stock (1Q) 13,011 .03
Sale of Digital City and other investment (2Q & 3Q) 46,055 .09
Total non-operating items $ (10,535) $ (.03)
(E) Tribune Education was sold to The McGraw-Hill Companies on Sept. 5, 2000 for approximately $686 million,
including the related tax benefit of $22 million. The accompanying financial statements reflect the Education
segment as discontinued operations, which are summarized as follows:
Three Quarters
2001 2000
Income from operations, net of tax $ - $ 9,743
Loss on disposal, net of tax and income during the holding period - (95,758)
Loss from discontinued operations, net of tax $ - $ (86,015)
7. (F) For the first three quarters of 2001, the Company's stock options and convertible securities were not included in the
calculation of diluted EPS because their effects were antidilutive.
For 2000, diluted EPS was computed assuming that the Series B convertible preferred shares and the LYONs debt
securities were converted into common shares. Also, weighted average common shares outstanding was adjusted for
the dilutive effect of stock options. The Company has certain other convertible securities which were not included
in the calculation of diluted EPS because their effects were antidilutive. Following is the calculation of diluted EPS
for the first three quarters:
Three Quarters
2001 2000
Net income $ 4,356 $ 184,668
Additional ESOP contribution required assuming Series B
preferred shares were converted, net of tax - (8,281)
Dividends for Series B, C, D-1, and D-2 preferred stock (20,100) (2,807)
LYONs interest expense, net of tax - 1,766
Minority interest adjustment, net of tax - (318)
Adjusted net income (loss) $ (15,744) $ 175,028
Weighted average common shares outstanding 298,472 261,191
Assumed conversion of Series B preferred shares into common - 19,405
Assumed exercise of stock options, net of common
shares assumed repurchased - 3,799
Assumed conversion of LYONs debt securities - 2,673
Adjusted weighted average common
shares outstanding 298,472 287,068
Diluted earnings (loss) per share $ (.05) $ .61
(G) The number of common shares outstanding, in thousands, at Sept. 30, 2001 was 297,772.
(H) Cash earnings was computed as income from continuing operations before restructuring charges and non-operating
items, plus amortization of goodwill and other intangible assets. The calculations are summarized as follows:
Three Quarters 2001
Amount Diluted EPS
Income from continuing operations, before restructuring charges and
non-operating items $ 176,244 $ .50
Amortization of intangible assets 180,390 .55
Cash earnings $ 356,634 $ 1.05
Three Quarters 2000
Amount Diluted EPS
Income from continuing operations, before non-operating items $ 279,080 $ .94
Amortization of intangible assets 118,747 .41
Cash earnings $ 397,827 $ 1.35
8. TRIBUNE COMPANY (A)
BUSINESS SEGMENT DATA (Unaudited)
(In thousands)
THIRD QUARTER THREE QUARTERS
2001 2000 % Change 2001 2000 % Change
BROADCASTING AND ENTERTAINMENT
Operating Revenues
Television $ 273,943 $ 292,637 (6) $ 851,334 $ 926,014 (8)
Radio 14,310 14,932 (4) 42,610 44,788 (5)
Entertainment/Other 65,633 57,485 14 137,189 124,143 11
Total Revenues 353,886 365,054 (3) 1,031,133 1,094,945 (6)
EBITDA (B)
Television 96,597 117,038 (17) 326,935 390,536 (16)
Radio 5,028 5,874 (14) 15,285 16,514 (7)
Entertainment/Other 4,975 5,996 (17) (790) 5,524 NM
Total before Restructuring Charges 106,600 128,908 (17) 341,430 412,574 (17)
Restructuring Charges (3,654) - NM (3,821) - NM
Total EBITDA 102,946 128,908 (20) 337,609 412,574 (18)
Operating Profit
Television 67,433 89,846 (25) 241,412 308,170 (22)
Radio 4,692 5,550 (15) 14,273 15,509 (8)
Entertainment/Other 3,990 5,348 (25) (3,656) 2,842 NM
Total before Restructuring Charges 76,115 100,744 (24) 252,029 326,521 (23)
Restructuring Charges (4,190) - NM (4,357) - NM
Total Operating Profit $ 71,925 $ 100,744 (29) $ 247,672 $ 326,521 (24)
PUBLISHING
Operating Revenues
Daily Newspapers $ 799,227 $ 893,447 (11) $ 2,542,146 $ 2,089,746 22
Other Publications/Services 107,273 97,226 10 319,050 225,199 42
Total Revenues 906,500 990,673 (8) 2,861,196 2,314,945 24
EBITDA
Daily Newspapers 149,340 226,105 (34) 572,588 586,767 (2)
Other Publications/Services 16,980 19,168 (11) 55,184 41,846 32
Total before Restructuring Charges 166,320 245,273 (32) 627,772 628,613 -
Restructuring Charges (118,955) - NM (132,399) - NM
Total EBITDA 47,365 245,273 (81) 495,373 628,613 (21)
Operating Profit (Loss)
Daily Newspapers 82,008 152,683 (46) 368,046 444,173 (17)
Other Publications/Services 7,475 10,878 (31) 28,549 23,169 23
Total before Restructuring Charge 89,483 163,561 (45) 396,595 467,342 (15)
Restructuring Charges (122,500) - NM (135,944) - NM
Total Operating Profit (Loss) $ (33,017) $ 163,561 NM $ 260,651 $ 467,342 (44)
INTERACTIVE
Operating Revenues $ 15,112 $ 12,586 20 $ 43,180 $ 28,347 52
EBITDA before Restructuring Charges (4,122) (8,246) 50 (16,255) (30,400) 47
Restructuring Charges (1,622) - NM (1,891) - NM
Total EBITDA (5,744) (8,246) 30 (18,146) (30,400) 40
Operating Profit (Loss) before Restructuring Charges (7,147) (11,279) 37 (25,584) (35,730) 28
Restructuring Charges (2,551) - NM (2,917) - NM
Total Operating Profit (Loss) $ (9,698) $ (11,279) 14 $ (28,501) $ (35,730) 20
CORPORATE EXPENSES
EBITDA before Restructuring Charges $ (9,168) $ (14,759) 38 $ (30,764) $ (44,386) 31
Restructuring Charges (1,415) - NM (1,782) - NM
Total EBITDA (10,583) (14,759) 28 (32,546) (44,386) 27
Operating Profit (Loss) before Restructuring Charges (9,728) (16,358) 41 (32,912) (47,964) 31
Restructuring Charges (1,415) - NM (1,782) - NM
Total Operating Profit (Loss) $ (11,143) $ (16,358) 32 $ (34,694) $ (47,964) 28
CONSOLIDATED
Operating Revenues $ 1,275,498 $ 1,368,313 (7) $ 3,935,509 $ 3,438,237 14
EBITDA before Restructuring Charges 259,630 351,176 (26) 922,183 966,401 (5)
Restructuring Charges (125,646) - NM (139,893) - NM
Total EBITDA 133,984 351,176 (62) 782,290 966,401 (19)
Operating Profit before Restructuring Charges 148,723 236,668 (37) 590,128 710,169 (17)
Restructuring Charges (130,656) - NM (145,000) - NM
Total Operating Profit $ 18,067 $ 236,668 (92) $ 445,128 $ 710,169 (37)
(A) Times Mirror operating results are included beginning on April 17, 2000. Education operating results are excluded
from all periods presented.
(B) EBITDA is earnings before interest, taxes, depreciation, amortization of intangible assets, equity
results, non-operating items and minority interest.
9. TRIBUNE COMPANY
PRO FORMA RESULTS OF OPERATIONS (Unaudited) (A) (B)
(In thousands)
THIRD QUARTER THREE QUARTERS
Actual Actual Percent Actual Pro Forma Percent
2001 2000 Change 2001 2000 Change
OPERATING REVENUES
Broadcasting and Entertainment $ 353,886 $ 365,054 (3) $ 1,031,133 $ 1,094,945 (6)
Publishing 906,500 990,673 (8) 2,861,196 3,074,126 (7)
Interactive 15,112 12,586 20 43,180 34,569 25
Total operating revenues $ 1,275,498 $ 1,368,313 (7) $ 3,935,509 $ 4,203,640 (6)
EBITDA (C)
Broadcasting and Entertainment $ 106,600 $ 128,908 (17) $ 341,430 $ 412,574 (17)
Publishing 166,320 245,273 (32) 627,772 831,847 (25)
Interactive (4,122) (8,246) 50 (16,255) (33,696) 52
Corporate Expenses (9,168) (14,759) 38 (30,764) (57,112) 46
Total EBITDA $ 259,630 $ 351,176 (26) $ 922,183 $ 1,153,613 (20)
OPERATING PROFIT (C)
Broadcasting and Entertainment $ 76,115 $ 100,744 (24) $ 252,029 $ 326,521 (23)
Publishing 89,483 163,561 (45) 396,595 587,946 (33)
Interactive (7,147) (11,279) 37 (25,584) (42,198) 39
Corporate Expenses (9,728) (16,358) 41 (32,912) (61,968) 47
Total operating profit $ 148,723 $ 236,668 (37) $ 590,128 $ 810,301 (27)
Net Loss on Equity Investments (12,555) (26,349) (52) (48,417) (58,664) (17)
Operating profit, net of equity results $ 136,168 $ 210,319 (35) $ 541,711 $ 751,637 (28)
(A) Tribune began to include Times Mirror in its reported results as of April 17, 2000. Pro forma data assumes that Times Mirror was
acquired as of the beginning of fiscal 2000. This provides comparable financial information for year over year comparisons.
(B) Pro forma data does not reflect any potential cost savings, revenue enhancements or other synergies.
(C) 2001 data excludes restructuring charges.
10. TRIBUNE COMPANY
SUMMARY OF REVENUES (Unaudited) (A)
For Third Quarter Ended September 30, 2001
(In thousands)
Third Quarter (13 weeks) Year-to-Date (39 weeks)
Actual Actual % Actual Pro Forma %
2001 2000 Change 2001 2000 Change
Broadcasting & Entertainment
$ 273,943 $ 292,637 $ 851,334 $ 926,014
Television (B) (6) (8)
14,310 14,932 42,610 44,788
Radio (4) (5)
65,633 57,485 137,189 124,143
Entertainment/Other 14 11
Segment Total (C) 353,886 365,054 (3) 1,031,133 1,094,945 (6)
Publishing
Advertising
900,031 937,082
Retail 284,739 306,254 (7) (4)
500,315 547,173
National 150,354 165,485 (9) (9)
801,546 958,160
Classified 249,143 311,575 (20) (16)
684,236 783,314 2,201,892 2,442,415
Sub-Total (13) (10)
164,262 158,568 494,541 483,727
Circulation 4 2
164,763 147,984
Other 58,002 48,791 19 11
Segment Total (D)(E)(F) 906,500 990,673 (8) 2,861,196 3,074,126 (7)
43,180 34,569
15,112 12,586 20 25
Interactive
$ 1,275,498 $ 1,368,313 (7) $ 3,935,509 $ 4,203,640 (6)
Consolidated Revenues (G)
(A) The pro forma year-to-date 2000 data assumes that Times Mirror was acquired as of the beginning of fiscal 2000. The pro forma data does not
reflect any potential revenue enhancements or other synergies.
(B) Includes WATL-Atlanta and WNOL-New Orleans, acquired in February 2000, and Tower Distribution (formerly United Video), acquired in
April 2001. On a same station basis, television revenues decreased 9% for the quarter and 10% for the year-to-date. Third quarter includes
copyright royalties of $10.8 million in 2001 and $0.8 million in 2000. Year-to-date includes copyright royalties of $28.9 million in 2001 and
$12.4 million in 2000. Excluding acquisitions and copyright royalties, television revenues decreased 12% for the both the quarter and the
year-to-date.
(C) Excluding acquisitions and copyright royalties, broadcasting and entertainment revenues decreased 8% for the quarter and 9% for the
year-to-date.
(D) Publishing revenues for 2000 actual have been restated to conform with the 2001 presentation.
(E) Includes Virginia Gazette, acquired in February 2001 and TV Data, acquired in May 2001. Excluding these acquisitions, publishing revenues
decreased 10% for the quarter and 8% for the year-to-date.
(F) Times Mirror's and Tribune's 2000 fiscal years began on different days. This difference resulted in the seven newly acquired newspapers
having five extra days in Period 1, 2001 compared to Period 1, 2000. Excluding the effect of these extra days, advertising revenues
decreased 10% for the year-to-date. Retail, national and classified advertising were below last year by 5%, 9% and 17%, respectively.
Excluding acquisitions and the extra five days, publishing revenues decreased 10% for the quarter and 8% for the year-to-date.
(G) Excluding acquisitions, copyright royalties and the extra days in 2001 for the seven newly acquired newspapers, consolidated revenues
decreased 9% for the quarter and 8% for the year-to-date.
11. TRIBUNE COMPANY
SUMMARY OF NEWSPAPER ADVERTISING VOLUME (Unaudited) (A) (B)
For Third Quarter Ended September 30, 2001
(In thousands)
Third Quarter (13 weeks) Year-to-Date (39 weeks)
Actual Actual % Actual Pro Forma %
2001 2000 Change 2001 2000 Change
Full Run
622 710 1,970 2,227
L.A. Times (12) (12)
1,618 1,834
Chicago Tribune 515 584 (12) (12)
1,262 1,252
Newsday 413 422 (2) 1
10,341 11,118
Other Daily Newspapers (C) 3,347 3,636 (8) (7)
Total 4,897 5,352 (9) 15,191 16,431 (8)
Part Run
1,320 1,522 3,789 4,588
L.A. Times (13) (17)
4,209 4,061
Chicago Tribune 1,405 1,373 2 4
1,221 1,314
Newsday 386 438 (12) (7)
4,520 4,374
Other Daily Newspapers (C) 1,426 1,384 3 3
Total 4,537 4,717 (4) 13,739 14,337 (4)
Total Advertising Inches
Full Run
Retail 1,478 1,604 (8) 4,693 4,967 (6)
National 761 905 (16) 2,470 2,889 (15)
Classified 2,658 2,843 (7) 8,028 8,575 (6)
4,897 5,352 15,191 16,431
Sub-Total (9) (8)
Part Run 4,537 4,717 (4) 13,739 14,337 (4)
Total 9,434 10,069 (6) 28,930 30,768 (6)
Preprint Pieces
L.A. Times (D) 376,253 278,268 35 1,155,587 809,390 43
Chicago Tribune 614,702 674,738 (9) 1,944,145 2,051,963 (5)
Newsday 532,295 537,530 (1) 1,640,123 1,586,885 3
Other Daily Newspapers (C) 769,652 807,461 (5) 2,405,971 2,457,220 (2)
Total 2,292,902 2,297,997 - 7,145,826 6,905,458 3
(A) The pro forma year-to-date 2000 data assumes that Times Mirror was acquired as of the beginning of 2000. The pro forma data
does not reflect any potential revenue enhancements or other synergies.
(B) Volume for 2000 actual has been restated to conform with the 2001 presentation. Volume is based on preliminary internal data,
which may be updated in subsequent reports. Advertising volume is presented only for daily newspapers.
(C) Other daily newspapers include The Baltimore Sun, South Florida Sun-Sentinel, Orlando Sentinel, The Hartford Courant, The
Morning Call, Daily Press, The Advocate and Greenwich Time.
(D) Preprint pieces have been restated to exclude pieces distributed by L.A. Times direct mail operations.
12. TRIBUNE COMPANY
SUMMARY OF REVENUES (Unaudited) (A)
For Period 9 Ended September 30, 2001
(In thousands)
Period 9 (4 weeks) Year-to-Date (39 weeks)
Actual Actual % Actual Pro Forma %
2001 2000 Change 2001 2000 Change
Broadcasting & Entertainment
$ 86,871 $ 92,623 $ 851,334 $ 926,014
Television (B) (6) (8)
4,253 4,772 42,610 44,788
Radio (11) (5)
18,173 17,292 137,189 124,143
Entertainment/Other 5 11
Segment Total (C) 109,297 114,687 (5) 1,031,133 1,094,945 (6)
Publishing
Advertising
89,922 103,310 900,031 937,082
Retail (13) (4)
48,949 54,702 500,315 547,173
National (11) (9)
78,311 97,755 801,546 958,160
Classified (20) (16)
217,182 255,767 2,201,892 2,442,415
Sub-Total (15) (10)
51,897 49,597 494,541 483,727
Circulation 5 2
19,003 15,809 164,763 147,984
Other 20 11
Segment Total (D)(E)(F) 288,082 321,173 (10) 2,861,196 3,074,126 (7)
5,313 4,438 43,180 34,569
20 25
Interactive
$ 402,692 $ 440,298 (9) $ 3,935,509 $ 4,203,640 (6)
Consolidated Revenues (G)
(A) The pro forma year-to-date 2000 data assumes that Times Mirror was acquired as of the beginning of fiscal 2000. The pro forma data does not
reflect any potential revenue enhancements or other synergies.
(B) Includes WATL-Atlanta and WNOL-New Orleans, acquired in February 2000, and Tower Distribution (formerly United Video), acquired in
April 2001. On a same station basis, television revenues decreased 10% for both the period and the year-to-date. Period 9 includes copyright
royalties of $10.8 million in 2001 and $0.8 million in 2000. Year-to-date includes copyright royalties of $28.9 million in 2001 and $12.4 million
in 2000. Excluding acquisitions and copyright royalties, television revenues decreased 21% for the period and 12% for the year-to-date.
(C) Excluding acquisitions and copyright royalties, broadcasting and entertainment revenues decreased 17% for the period and 9% for the
year-to-date.
(D) Publishing revenues for 2000 actual have been restated to conform with the 2001 presentation.
(E) Includes Virginia Gazette, acquired in February 2001 and TV Data, acquired in May 2001. Excluding these acquisitions, publishing revenues
decreased 11% for the period and 8% for the year-to-date.
(F) Times Mirror's and Tribune's 2000 fiscal years began on different days. This difference resulted in the seven newly acquired newspapers
having five extra days in Period 1, 2001 compared to Period 1, 2000. Excluding the effect of these extra days, advertising revenues
decreased 10% for the year-to-date. Retail, national and classified advertising were below last year by 5%, 9% and 17%, respectively.
Excluding acquisitions and the extra five days, publishing revenues decreased 11% for the period and 8% for the year-to-date.
(G) Excluding acquisitions, copyright royalties and the extra days in 2001 for the seven newly acquired newspapers, consolidated revenues
decreased 12% for the period and 8% for the year-to-date.
13. TRIBUNE COMPANY
SUMMARY OF NEWSPAPER ADVERTISING VOLUME (Unaudited) (A) (B)
For Period 9 Ended September 30, 2001
(In thousands)
Period 9 (4 weeks) Year-to-Date (39 weeks)
Actual Actual % Actual Pro Forma %
2001 2000 Change 2001 2000 Change
Full Run
195 229 1,970 2,227
L.A. Times (15) (12)
163 193 1,618 1,834
Chicago Tribune (16) (12)
126 139 1,262 1,252
Newsday (9) 1
1,037 1,171 10,341 11,118
Other Daily Newspapers (C) (11) (7)
Total 1,521 1,732 (12) 15,191 16,431 (8)
Part Run
430 476 3,789 4,588
L.A. Times (10) (17)
465 454 4,209 4,061
Chicago Tribune 2 4
120 142 1,221 1,314
Newsday (15) (7)
408 452 4,520 4,374
Other Daily Newspapers (C) (10) 3
Total 1,423 1,524 (7) 13,739 14,337 (4)
Total Advertising Inches
Full Run
468 547 4,693 4,967
Retail (14) (6)
231 286 2,470 2,889
National (19) (15)
822 899 8,028 8,575
Classified (9) (6)
1,521 1,732 15,191 16,431
Sub-Total (12) (8)
1,423 1,524 13,739 14,337
Part Run (7) (4)
28,930 30,768
Total 2,944 3,256 (10) (6)
Preprint Pieces
112,698 96,530 1,155,587 809,390
L.A. Times (D) 17 43
176,362 219,934 1,944,145 2,051,963
Chicago Tribune (20) (5)
161,556 179,356 1,640,123 1,586,885
Newsday (10) 3
235,329 263,513 2,405,971 2,457,220
Other Daily Newspapers (C) (11) (2)
7,145,826 6,905,458
Total 685,945 759,333 (10) 3
(A) The pro forma year-to-date 2000 data assumes that Times Mirror was acquired as of the beginning of 2000. The pro forma data
does not reflect any potential revenue enhancements or other synergies.
(B) Volume for 2000 actual has been restated to conform with the 2001 presentation. Volume is based on preliminary internal data,
which may be updated in subsequent reports. Advertising volume is presented only for daily newspapers.
(C) Other daily newspapers include The Baltimore Sun, South Florida Sun-Sentinel, Orlando Sentinel, The Hartford Courant, The
Morning Call, Daily Press, The Advocate and Greenwich Time.
(D) Preprint pieces have been restated to exclude pieces distributed by L.A. Times direct mail operations.