SlideShare une entreprise Scribd logo
1  sur  13
Télécharger pour lire hors ligne
Catastrophe Reinsurance Program
                      Effective June 1, 2007 to May 31, 2008

Northbrook, Ill., January 30, 2007 –Our personal property catastrophe reinsurance program for
Allstate Protection, the property and casualty business unit of The Allstate Corporation (NYSE:
ALL), has now been completed with the exception of the state of Florida. The Florida program,
which will be placed later this year once the state’s recent legislative actions have been
assessed, should become effective June 1, 2007, the beginning of the hurricane catastrophe
season.

Our personal lines catastrophe reinsurance program was designed, utilizing our risk management
methodology, to address our exposure to catastrophes nationwide. Our program provides
reinsurance protection to us for catastrophes including storms named or numbered by the
National Weather Service, earthquakes and fires following earthquakes. These reinsurance
agreements are part of our catastrophe management strategy, which is intended to provide our
shareholders an acceptable return on the risks assumed in our property business and to reduce
variability of earnings, while providing protection to our customers.

Our program coordinates coverage under various agreements. As discussed below, our
reinsurance program is comprised of agreements that provide coverage for the occurrence of
certain qualifying catastrophes in specific states including New York, New Jersey, Connecticut
and Texas ( “multi-year”); other states along the southern and eastern coasts ( “South-East”)
principally for hurricanes; in California for fires following earthquakes ( “California fires following”);
in New Jersey for losses in excess of the multi year agreement (“New Jersey excess”) and in
Kentucky for earthquakes and fires following earthquakes ( “Kentucky”). Another reinsurance
agreement provides coverage nationwide, excluding Florida, for the aggregate or sum of
catastrophe losses in excess of an annual retention associated with storms named or numbered
by the National Weather Service, earthquakes and fires following earthquakes (“aggregate
excess”). The Florida component of the reinsurance program is designed separately from the
other components of the program to address the distinct needs of our separately capitalized legal
entities in that state.

During January 2007 we completed the renewal of our aggregate excess, South-East and New
Jersey excess reinsurance contracts, opted to expand coverage in the existing multi-year
contracts in the states of Texas and New Jersey and added a new agreement covering Kentucky
earthquake and fires following earthquakes. These contracts will be effective June 1, 2007 to
May 31, 2008, with the exception of the aggregate excess contract which is effective June 1,
2007 to May 31, 2009.

The multi-year agreements have various retentions and limits designed commensurate with the
amount of catastrophe risk, measured on an annual basis, in each covered state. A description
of these retentions and limits appears in the following tables and charts. The multi-year,
California fires following, New Jersey excess, South-East and Kentucky agreements cover
qualifying losses related to a specific qualifying event in excess of the agreement’s retention.
Reinsurance recoveries under each agreement are equal to the qualifying losses in excess of the
agreement’s retention for a specific event multiplied by the percentage of reinsurance placed up
to the agreement’s occurrence limit.

The South-East agreement provides coverage for Allstate Protection personal property excess
catastrophe losses for storms named or numbered by the National Weather Service, effective
June 1, 2007 for one year. The South-East agreement covers $500 million of losses in excess of
$500 million, of which Allstate retains 5%. This agreement reinsures losses in the states of
Louisiana, Mississippi, Alabama, Georgia, South Carolina, North Carolina, Virginia, Maryland,
Delaware, Pennsylvania and Rhode Island and the District of Columbia. Unlike the multi-year
agreements, the South-East agreement provides that losses resulting from the same occurrence

                                                    1
but taking place in various states may be combined to meet the agreements per occurrence
retention and limit.

The New Jersey excess agreement provides coverage for Allstate Protection personal property
excess catastrophe losses in the state of New Jersey from events such as hurricanes and
earthquakes, effective June 1, 2007 for one year. This agreement is for $200 million of coverage
in excess of our existing multi-year agreement in the state, with Allstate retaining 5%. The multi-
year agreement covers 95% of losses of $300 million in excess of $140 million.

The Kentucky agreement provides coverage for Allstate Protection personal property excess
catastrophe losses in the state of Kentucky for earthquake and fires following earthquakes,
effective June 1, 2007 for one year. This agreement is for $40 million of coverage, in excess of
$10 million with Allstate retaining 5%.

The aggregate excess agreement provides coverage for the aggregate or sum of all qualifying
losses incurred nationwide, except Florida, in excess of $2 billion of aggregated qualifying losses
up to the limit of $2 billion arising from three covered perils: storms named or numbered by the
National Weather Service, earthquakes and fires following earthquakes, with 5% retained by
Allstate in the first year and 20% retained by Allstate in the second year. Losses recoverable
from the multi-year, California fires following, New Jersey excess, South-East and Kentucky
agreements are excluded when determining the retention of the aggregate excess agreement to
the extent that the loss recoveries conform to the named peril coverage in the aggregate excess
agreement. Conversely, losses retained under, or which exceed the limits of, the multi-year,
California fires following, New Jersey excess, South-East and Kentucky agreements and
qualifying as covered named peril losses under the aggregate excess agreement are covered.
When we placed the aggregate excess agreement this year, we designed it to treat losses
recoverable from the South-East excess agreement identical to the treatment accorded the multi-
year, California fires following, New Jersey excess and Kentucky agreements, as noted above.

The multi-year, California fires following, New Jersey excess, South-East, and Kentucky
agreements expire on May 31, 2008. The aggregate excess agreement was placed with a one
year term and two year term. For the first year, effective June 1, 2007 to May 31, 2008, Allstate
retains 5% of the $2 billion reinsurance limit. The one year term for the period June 1, 2007 to
May 31, 2008 is 15% placed or $0.3 billion of the $2.0 billion limit. A separately placed two year
term is for the period June 1, 2007 to May 31, 2009 and Allstate also retains 5% of the $2.0 billion
reinsurance limit. The two year term for the period June 1, 2007 to May 31, 2009 is 80% placed
for both years or $1.6 billion of the $2.0 billion limit. For the second year of the two year term,
which expires on May 31, 2009, Allstate has the option to place an additional 15% or $300 million
of the $2.0 billion limit. Allstate has stipulated that the coverage provided by the multi-year,
California fires following, New Jersey excess, South-East and Kentucky agreements will be in
place for the purpose of making loss recoveries throughout the two-year duration of the
aggregate excess agreement.

The reinsurance agreements have been placed in the global reinsurance market, with the
majority of the limits placed with reinsurers who currently have an A.M. Best insurance financial
strength rating of A+ or better. The remaining limits are placed with reinsurers who currently
have an A.M. Best insurance financial strength rating no lower than A-, with three exceptions.
Two of the three exceptions have a Standard and Poors rating of AA- and we will have collateral
for the entire contract limit exposure for the third reinsurer which is not rated by either rating
agency.

We expanded the number of reinsurance participants on our program and placed approximately
$215 million or 11% of the aggregate excess agreement limits for June 1, 2007 to May 31, 2008
period and $30 million or 6% of the South-East agreement limit with alternative market sources.
Alternative market sources refers to a reinsurer that hedge funds, private equity firms, or
investment banks substantially or wholly support; retrocedes 100% of its assumed liability to a
specific retrocessionaire; or provides collateral to us equal to its assumed per occurrence limit.

                                                 2
We estimate that the total annualized cost of all reinsurance programs will be approximately $770
            million per year or $193 million per quarter, including an estimate for reinsurance coverage in
            Florida. This is compared to approximately $800 million per year from our total annualized cost
            during the 2006 hurricane season, or an estimated decrease of $30 million due to lower expected
            cost of coverage in Florida. This is compared to a cost of $73 million in the first quarter, $114
            million in the second quarter, $211 million in the third quarter and $209 million in the fourth
            quarter of 2006. We currently expect that a similar level of coverage will be purchased or
            renewed for the comparable 2008 period. The actual placement of the Florida program,
            contractual redeterminations and risk transfers of certain catastrophe and other liability exposures
            during 2007 may cause our total annualized cost to differ from our current estimates.

            The Florida program will be placed later this year, once the state’s recent legislative actions have
            been assessed, and should become effective on June 1, 2007 for the beginning of the hurricane
            catastrophe season.

            The terms, retentions and limits for all of Allstate’s catastrophe management reinsurance
            agreements in place as of June 30, 2007 are listed in the following table.

                                                     %                                                         Per Occurrence
(in millions)
                                 Effective Date    Placed           Reinstatement            Retention              Limit
Coordinated coverage
Aggregate excess(1)                 6/1/2007       95 for                None                        $2,000            $2,000
                                                   year 1;
                                                   80 for
                                                   year 2

California fire following(2)        2/1/2006         95          2 limits over 28 month                  520            1,500
                                                                      term, prepaid
Multi-year(3):                      6/1/2005

 Connecticut                                         95          2 limits over remaining                 129              200
                                                                      term, prepaid

 New Jersey                                          95          1 reinstatement each                    140              300
                                                              contract year over 3-year
                                                               term, premium required

 New York(4)                                         90          2 limits over remaining                 830            1,000
                                                                      term, prepaid

 Texas(5)                                            95          2 limits over remaining                 399              750
                                                                      term, prepaid

New Jersey excess(6)                6/1/2007         95       1 reinstatement, premium                   440              200
                                                                       required

South-East(7)                       6/1/2007         95       1 reinstatement premium                    500              500
                                                                       required

Kentucky (8)                        6/1/2007         95       1 reinstatement, premium                   10                40
                                                                       required


                                                             3
Coordinated Coverage
(1)
    Aggregate Excess Agreement – This agreement has a one year term, effective 6/1/2007 to 5/31/2008, and a two year
term, effective 6/1/2007 to 5/31/2009. It covers the aggregation of qualifying losses for storms named or numbered by
the National Weather Service, earthquakes and fires following earthquakes for Allstate Protection personal lines auto and
property business countrywide, except for Florida, in excess of $2 billion in aggregated losses per contract year. Losses
recoverable if any, from our California fires following, multi-year, New Jersey excess, South-East and Kentucky
agreements are excluded when determining the retention of this agreement. The one year contract is 15% placed or $.3
billion of the total $2 billion limit. The two year term contract is 80% placed or $1.6 billion of the total $2 billion limit leaving
Allstate the option to place up to an additional 15% in year two. The aggregate excess agreement in effect for 6/1/2006 to
5/31/2007 was placed prior to the South-East agreement and accordingly did not provide for its consideration.

The preliminary reinsurance premium is subject to redetermination for exposure changes.

(2)
 California Fire Following Agreement – This agreement is effective 2/1/2006 and expires 5/31/2008. This agreement
covers Allstate Protection personal property excess catastrophe losses in California for fires following earthquakes. This
agreement provides $1.5 billion of coverage for all qualifying losses with one reinstatement except when a qualifying loss
occurrence exceeds $2 billion, then for 21 days no additional recovery can occur for any losses within the same seismic
geographically affected area. The retention on this agreement is subject to remeasurement.
(3)
  Multi-year Agreements – These agreements have been in effect since 6/1/2005 and cover the Allstate brand personal
property excess catastrophe losses, expiring 5/31/2008. The retentions on these agreements are subject to annual
remeasurements on their anniversary dates. The Company is planning to elect $100 million of additional coverage
effective 6/1/2007 in the states of Texas and New Jersey.
(4)
  Two separate reinsurance agreements provide coverage for catastrophe risks in the state of New York: Allstate
Insurance Company (“AIC”) has a $512 retention and a $550 limit, and Allstate Indemnity Company (“AI”) has a $318
retention and a $450 limit.
(5)
  The Texas agreement is with Allstate Texas Lloyd’s (“ATL”), a syndicate insurance company. ATL also has a 100%
reinsurance agreement with AIC covering losses in excess of and/or not reinsured by the Texas agreement.
(6)
 New Jersey Excess – This agreement is effective 6/1/2007 for 1 year and covers Allstate Protection personal property
catastrophe losses in excess of the New Jersey multi-year agreement.
(7)
  South-East – This agreement is effective 6/1/2007 for 1 year and covers Allstate Protection personal property excess
catastrophe losses for storms named or numbered by the National Weather Service. This agreement covers personal
property business in the states of Louisiana, Mississippi, Alabama, Georgia, South Carolina, North Carolina, Virginia,
Maryland, Delaware, Pennsylvania and Rhode Island and the District of Columbia. The South-East agreement in effect
for 6/1/2006 to 5/31/2007 did not cover business in Rhode Island, provided one reinstatement of $180 million of the $400
million limit placed and was 80% placed. The preliminary reinsurance premium is subject to redetermination for exposure
changes.
(8)
  Kentucky – This agreement is effective 6/1/2007 for one-year and covers Allstate Protection’s personal property excess
catastrophe losses for earthquakes and fires following earthquakes.


                                                                 4
Current 2007 Reinsurance Programs by State (excluding Florida)
                                                                                  For Illustrative Purposes only.
                                                                        Not intended to reflect all terms of all agreements.


 $ Millions - not
    to scale
     4,000


     3,500


                                                                                       2,000 xs 2,000
                                               · 300 xs 2,000 one year contract June 1, 2007 to May 31, 2008/ 5% retained,15% placed
     3,000                                   · 1,600 xs 2,000 two year contract June 1, 2007 to May 31, 2009/ 20% retained, 80% placed
                                                                6/1/08 to 5/31/09/ 15% of the 20% retention can be placed


     2,500


     2,000


     1,500


                        1,500 xs 520
                        5% retained/
                         95% placed
     1,000
                                                                                             AIC
                                                                                          550 xs 512                                            500 xs 500
                                                                                         10% retained/                                         5% retained/
                                                                                          90% placed                                           95% placed
      750                                                                                                             750 xs 399
                                                                                                                     5% retained/
                                                                                                        AI           95% placed
                                                                                                    450 xs 318
                                                                                                   10% retained/
      500                                                            200 xs Multi-year              90% placed
                                                                       5% retained/
                                                                        95% placed


                                                                        300 xs 140
      250                                        200 xs 129            5% retained/
                                                5% retained/            95% placed
                                                95% placed


                                                                                                                                                                            40 xs 10
                                                                                                                                                                     5% retained/ 95% placed

                                                                                                   NY
                             CA                        CT                   NJ                                            TX                   South-East                     KY               All Other States ex FL
                                                                                                                                        (LA, MS, AL, GA, SC, NC,
                                                                                                                                        VA, MD, DE, PA, RI, DC)
Legend
                    Aggregate Excess Agreement – This agreement has a one year term, effective 6/1/2007 to 5/31/2008 and a two year term effective 6/1/2007 to
                    5/31/2009. It covers the aggregation of qualifying losses for storms named or numbered by the National Weather Service, earthquakes and fires following
                    earthquakes for Allstate Protection personal lines auto and property business countrywide except for Florida.

                    The one year contract (6/1/2007 to 5/31/2008) has been 15% placed or $.3 billion of the $2.0 billion limit. The two year contract (6/1/2007 to
                    5/31/2009) has been 80% placed or $1.6 billion of the $2.0 billion limit leaving Allstate the option to place up to an additional 15% in year two.

                    The preliminary reinsurance premium is subject to redetermination for exposure changes.

                    Losses recoverable, if any, from our California fires following, multi-year, the New Jersey excess, South-East and Kentucky agreements are excluded
                    when determining the retention of this agreement.

                    California Fires Following Agreement – This agreement is effective 2/1/2006 and expires 5/31/2008. This agreement covers Allstate Protection
                    personal property excess catastrophe losses in California for fires following earthquakes. This agreement provides $1.5 billion of coverage for all
                    qualifying losses with one reinstatement except when a qualifying loss occurrence exceeds $2 billion, then for 21 days no additional recovery can
                    occur for any losses within the same seismic geographically affected area. The retention on this agreement is subject to remeasurement.

                    Multi-year Agreements – These agreements have been in effect since 6/1/2005 and cover the Allstate brand personal property excess
                    catastrophe losses, expiring 5/31/2008. The retentions on these agreements are subject to annual remeasurements on their anniversary dates.
                    Two separate reinsurance agreements provide coverage for catastrophe risks in the state of New York: Allstate Insurance Company (“AIC”) has
                    a $512 retention and a $550 limit, and Allstate Indemnity Company (“AI”) has a $318 retention and a $450 limit. The Texas agreement is with
                    Allstate Texas Lloyd’s (“ATL”), a syndicate insurance company. ATL also has a 100% reinsurance agreement with AIC covering losses in
                    excess of and/or not reinsured by the Texas agreement.

                    New Jersey Excess – This agreement is effective 6/1/2007 for 1 year and covers Allstate Protection personal property catastrophe
                    losses in excess of the New Jersey multi-year agreement.

                    South-East – This agreement is effective 6/1/2007 for 1 year and covers Allstate Protection personal property excess catastrophe
                    losses for storms named or numbered by the National Weather Service. This agreement covers personal property business in the
                    states of Louisiana, Mississippi, Alabama, Georgia, South Carolina, North Carolina, Virginia, Maryland, Delaware, Pennsylvania and Rhode Island and
                    the District of Columbia. The preliminary reinsurance premium is subject to redetermination for exposure changes.

                    Kentucky- This agreement is effective 6/1/2007 for 1 year and covers Allstate Protection personal property excess catastrophe losses for earthquakes
                    and fires following earthquakes.
Reinsurance Agreements
                                    Highlights of Certain Other Contract Terms and Conditions

                                South-East                 Aggregate Excess               Multi-year, New Jersey excess, California fires
                                                                                                      following and Kentucky

Business Reinsured         Personal Lines          Personal Lines                        Personal Lines
                           Property business       Property and Auto business            Property business

Location (s)               11 states and           Nationwide except Florida             Each specific state
                           Washington, DC

Covered Losses             1 specific peril –      3 specific perils – storms named or   Multi-year and New Jersey excess: multi-perils -
                           storms named or         numbered by the National Weather      includes hurricanes and earthquakes
                           numbered by the         Service, earthquakes, and fires       California fires following: 1 specific peril – fires
                           National Weather        following earthquakes                 following earthquakes
                           Service                                                       Kentucky-earthquakes and fires following
                                                                                         earthquakes.

Brands Reinsured           Allstate Brand          Allstate Brand                        Multi-year: Allstate Brand
                           Encompass Brand         Encompass Brand                       New Jersey excess, California fires following,
                                                                                         Kentucky: Allstate Brand and Encompass Brand

Exclusions, other than     Automobile              Assessment exposure to                Automobile
typical market             Terrorism               California Earthquake Authority       Terrorism
negotiated exclusions      Commercial              Terrorism                             Commercial
                                                   Commercial

Loss Occurrence            Sum of all qualifying   Sum of all qualifying losses and      Sum of all qualifying losses for a specific
                           losses from named or    sum of all qualifying occurrences     occurrence over 168 hours
                           numbered storms         (Aggregate)
                           by the                                                        Windstorm related occurrences over 96 hours
                           National Weather        Losses over 96 hours from a
                           Service                 named or numbered storm               Riot related occurrences over 72 hours
                           over 96 hours
                                                   Losses over 168 hours for an          California fires following occurrences over 168
                                                   earthquake                            hours. No additional recovery can occur for any
                                                                                         losses within the same seismic geographically
                                                   Losses over 168 hours within a 336    affected area for an additional 336 hours when a
                                                   hour period for fires following an    qualifying loss exceeds $2 billion. Kentucky
                                                   earthquake                            earthquake and fires following earthquake
                                                                                         occurrences over 336 hours.

Loss adjustment            10% of qualifying       10% of qualifying losses              Multi-year and California fires
expenses included          losses                                                        following: actual expenses
within ultimate net loss                                                                 New Jersey excess and Kentucky: 10% of
                                                                                         qualifying losses
Illustration of Utilization of Reinsurance Coverage
The following examples are provided to illustrate to investors Allstate’s reinsurance program and should not be relied upon to determine the amount of Allstate’s net loss from any actual events that may occur
in the future. They are based on hypothetical situations. The actual amounts recoverable under our reinsurance program and the amount of our net loss from any one event or series of events could differ materially from the hypothetical
results presented in these examples due to a variety of factors, including the nature and location of the specific losses incurred, the specific lines of business covered by the various reinsurance agreements, and the impact of potential litigation.

(in millions)                                                                                                                                                                           Amounts Recoverable by Reinsurance Agreement
                                                                                                                                                                                                                                                                Allstate Floridian (c)
                                                                                                                                                                           New Jersey      California               Aggregate       FHCF                    FHCF      Excess of Excess of        Additional
                           Amount                                                  Notes                                                 South-East           Multi-year     Excess     Fire Following   Kentucky    Excess        Retention     FHCF       Sliver       Loss      Loss Sliver Excess of Loss


Example 1 - One hurricane landfalls in North Carolina, total loss of $2.1 billion (Total loss of $2.1 billion, net loss of $1.6 billion or 77.4%)

North Carolina hurricane
     South-East
Loss                           2,100.0
Retention                        500.0       500 retention
Subject Loss                  1,600.0        Total loss less 500 retention
Retained                         25.0        5% retained on 500 xs 500 retention
Recoverable                    (475.0)       95% of 500 xs 500 placed (a)                                                                           (475.0)
Retained                      1,100.0        In excess of South-East Agreement retention and limit

North Carolina loss           2,100.0
Less recoverables              (475.0)                                                                                                              (475.0)
Net loss                      1,625.0
Illustration of Utilization of Reinsurance Coverage
The following examples are provided to illustrate to investors Allstate’s reinsurance program and should not be relied upon to determine the amount of Allstate’s net loss from any actual events that may occur
in the future. They are based on hypothetical situations. The actual amounts recoverable under our reinsurance program and the amount of our net loss from any one event or series of events could differ materially from the hypothetical
results presented in these examples due to a variety of factors, including the nature and location of the specific losses incurred, the specific lines of business covered by the various reinsurance agreements, and the impact of potential litigation.

(in millions)                                                                                                                                                                                Amounts Recoverable by Reinsurance Agreement
                                                                                                                                                                                                                                                                Allstate Floridian (c)
                                                                                                                                                                               New Jersey        California                  Aggregate    FHCF              FHCF      Excess of Excess of        Additional
                           Amount                                                  Notes                                                 South-East             Multi-year       Excess       Fire Following   Kentucky       Excess     Retention   FHCF   Sliver       Loss      Loss Sliver Excess of Loss


Example 2 - First hurricane landfalls in North Carolina, total loss of $1.05 billion; second hurricane landfalls in Louisiana, total loss of $1.4 billion (Total loss of $2.45 billion, net loss of $1.5 billion or 61.2%)

Hurricane in North Carolina
     South-East
Loss                        1,050.0
Retention                     500.0          500 retention
Subject Loss                  550.0          Total loss less 500 retention
Retained                       25.0          5% retained on 500 xs 500 retention
Recoverable                  (475.0)         95% of 500 xs 500 placed (a)                                                                          (475.0)
Retained                       50.0          In excess of South-East Agreement retention and limit

North Carolina loss           1,050.0
Less recoverables              (475.0)
Net loss                        575.0

Hurricane in Louisiana
     South-East
Loss                          1,400.0
Retention                       500.0         500 retention
Subject Loss                    900.0         Total loss less 500 retention
Retained                         25.0         5% retained on 500 xs 500 retention
                                              45% of 95% of 500 xs 500 retention, limit reinstated
Recoverable                    (475.0)                                                                                                             (475.0)
Retained                        400.0         In excess of South-East Agreement retention and limit as reinstated

Louisiana loss                1,400.0
Less recoverables              (475.0)
Net loss                        925.0

Total losses                  2,450.0
Less recoverables              (950.0)
Net loss                      1,500.0                                                                                                              (950.0)
Illustration of Utilization of Reinsurance Coverage
The following examples are provided to illustrate to investors Allstate’s reinsurance program and should not be relied upon to determine the amount of Allstate’s net loss from any actual events that may occur
in the future. They are based on hypothetical situations. The actual amounts recoverable under our reinsurance program and the amount of our net loss from any one event or series of events could differ materially from the hypothetical
results presented in these examples due to a variety of factors, including the nature and location of the specific losses incurred, the specific lines of business covered by the various reinsurance agreements, and the impact of potential litigation.

(in millions)                                                                                                                                                                          Amounts Recoverable by Reinsurance Agreement
                                                                                                                                                                                                                                                                Allstate Floridian (c)
                                                                                                                                                                          New Jersey       California                    Aggregate    FHCF                  FHCF      Excess of Excess of        Additional
                          Amount                                                   Notes                                             South-East            Multi-year       Excess      Fire Following   Kentucky         Excess     Retention   FHCF       Sliver       Loss      Loss Sliver Excess of Loss


Example 3 - First hurricane landfalls in Alabama, total loss of $350 million; second hurricane landfalls in Georgia, total loss of $900 million; third hurricane landfalls in North Carolina and South Carolina, total
loss of $750 (Total loss of $2 billion, net loss of $1.4 billion or 69.1%)

Hurricane in Alabama
     South-East
Loss                           350.0
Retention                      500.0        500 retention
Recoverable                      0.0        Retention exceeds total loss

Alabama loss                    350.0
Less recoverable                 0.0
Net loss                       350.0

Hurricane in Georgia
     South-East
Loss                           900.0
Retention                      500.0        500 retention
Subject Loss                   400.0        Total loss less 500 retention
Retained                        20.0        5% retained on 400 xs 500 retention
Recoverable                   (380.0)       95% of 400 loss xs 500 retention (a)                                                               (380.0)

Georgia loss                    900.0
Less recoverables             (380.0)
Net loss                       520.0

Hurricane in North Carolina and South Carolina
     South-East
Loss                           750.0
Retention                      500.0     500 retention
Subject Loss                   250.0     Total loss less 500 retention
Retained                        12.5     5% retained on 250 xs 500 retention
                                         95% of 250 loss xs 500 retention, limit reinstated (a)
Recoverable                  (237.5)                                                                                                           (237.5)

NC and SC loss                  750.0
Less recoverables             (237.5)
Net loss                       512.5


Total loss                   2,000.0
Less recoverables             (617.5)                                                                                                          (617.5)
Net loss                     1,382.5
Illustration of Utilization of Reinsurance Coverage
The following examples are provided to illustrate to investors Allstate’s reinsurance program and should not be relied upon to determine the amount of Allstate’s net loss from any actual events that may occur
in the future. They are based on hypothetical situations. The actual amounts recoverable under our reinsurance program and the amount of our net loss from any one event or series of events could differ materially from the hypothetical
results presented in these examples due to a variety of factors, including the nature and location of the specific losses incurred, the specific lines of business covered by the various reinsurance agreements, and the impact of potential litigation.

(in millions)                                                                                                                                                                             Amounts Recoverable by Reinsurance Agreement
                                                                                                                                                                                                                                                                Allstate Floridian (c)
                                                                                                                                                                           New Jersey        California               Aggregate     FHCF                    FHCF      Excess of Excess of        Additional
                          Amount                                                   Notes                                              South-East            Multi-year       Excess       Fire Following   Kentucky    Excess      Retention     FHCF       Sliver       Loss      Loss Sliver Excess of Loss


Example 4 - First hurricane landfalls in Maryland, total loss $600 million; second hurricane landfalls in New Jersey, total loss of $700 million; third hurricane landfalls in Maine, total loss of $200 million;
fire losses reported in California following an earthquake, total loss of $1.7 billion. (Total loss of $3.2 billion, net loss of $1.5 billion or 46.6%)

Hurricane in Maryland
     South-East
Loss                            600.0
Retention                       500.0       500 retention
Subject loss                   100.0        Total loss less 500 retention
Retained                         5.0        5% retained on 100 xs 500 retention
Recoverable                    (95.0)       95% of 100 loss xs 500 retention (a)                                                                 (95.0)

Maryland loss                  600.0
Less recoverables              (95.0)
Net loss                       505.0

Hurricane in New Jersey
      Multi-Year
Loss                             700.0
Retention                        140.0      140 retention
Subject Loss                     560.0      Total loss less 140 retention
Retained                         15.0       5% retained on 300 limit xs 140 retention
Recoverable                    (285.0)      95% placed on 300 limit xs 140 retention (b)                                                                        (285.0)
 New Jersey Excess
Retained                         10.0       5% retained on 200 limit xs 440 retention
Recoverable                    (190.0)      95% placed on 200 limit xs 440 retention (b)                                                                                        (190.0)
Retained                         60.0       In excess of New Jersey Excess retention and limit

New Jersey loss                 700.0
Less recoverables              (475.0)
Net loss                        225.0

Hurricane in Maine
Loss                           200.0
Retained                       200.0        No state specific reinsurance

Maine loss                     200.0
Less recoverable                 0.0
Net loss                       200.0
Illustration of Utilization of Reinsurance Coverage
The following examples are provided to illustrate to investors Allstate’s reinsurance program and should not be relied upon to determine the amount of Allstate’s net loss from any actual events that may occur
in the future. They are based on hypothetical situations. The actual amounts recoverable under our reinsurance program and the amount of our net loss from any one event or series of events could differ materially from the hypothetical
results presented in these examples due to a variety of factors, including the nature and location of the specific losses incurred, the specific lines of business covered by the various reinsurance agreements, and the impact of potential litigation.

(in millions)                                                                                                                                                                        Amounts Recoverable by Reinsurance Agreement
                                                                                                                                                                                                                                                                Allstate Floridian (c)
                                                                                                                                                                      New Jersey        California                 Aggregate        FHCF                    FHCF      Excess of Excess of        Additional
                           Amount                                                Notes                                             South-East           Multi-year      Excess       Fire Following   Kentucky      Excess         Retention     FHCF       Sliver       Loss      Loss Sliver Excess of Loss


Example 4 - continuation

Fire losses in California following an earthquake
CA Fire Following
Loss                           1,700.0
Retention                        500.0       500 retention
Subject loss                   1,200.0       Total loss less 500 retention
Retained                          60.0       5% retained on 1,200 xs 500 retention
Recoverable                   (1,140.0)      95% placed on 1,200 xs 500 retention                                                                                                         (1140.0)

CA loss                       1,700.0
Less recoverable             (1,140.0)
Net loss                        560.0


Total loss                    3,200.0
Less recoverables            (1,710.0)                                                                                                        (95.0)        (285.0)        (190.0)        (1140.0)
Net loss                      1,490.0
Illustration of Utilization of Reinsurance Coverage
The following examples are provided to illustrate to investors Allstate’s reinsurance program and should not be relied upon to determine the amount of Allstate’s net loss from any actual events that may occur
in the future. They are based on hypothetical situations. The actual amounts recoverable under our reinsurance program and the amount of our net loss from any one event or series of events could differ materially from the hypothetical
results presented in these examples due to a variety of factors, including the nature and location of the specific losses incurred, the specific lines of business covered by the various reinsurance agreements, and the impact of potential litigation.

(in millions)                                                                                                                                                                               Amounts Recoverable by Reinsurance Agreement
                                                                                                                                                                                                                                                                    Allstate Floridian (c)
                                                                                                                                                                              New Jersey        California                      Aggregate     FHCF              FHCF      Excess of Excess of        Additional
                           Amount                                                  Notes                                                 South-East            Multi-year       Excess       Fire Following    Kentucky          Excess      Retention   FHCF   Sliver       Loss      Loss Sliver Excess of Loss


Example 5 - First hurricane landfalls in Louisiana, total loss of $3.6 billion; second hurricane landfalls in Texas, total loss of $1 billion; third hurricane landfalls in Florida, total loss of $900 million ($600 million
net of Universal and Royal Palm) (Total loss of $5.2 billion, net loss of $2.17 billion or 41.7%)

Hurricane in Louisiana
     South-East
Loss                          3,600.0
Retained                        500.0        500 retention
Subject Loss                  3,100.0        Total loss less 500 retention
Retained                         25.0        5% retained on 500 xs 500 retention
Recoverable                    (475.0)       95% of 500 xs 500 placed (a)                                                                          (475.0)
Retained                      2,600.0        In excess of South-East Agreement retention and limit

Louisiana loss                3,600.0
Less recoverables              (475.0)
Net loss                      3,125.0

 Aggregate Excess
Subject Loss                  3,125.0
Retention                     2,000.0        2,000 retention
Subject Loss                  1,125.0        Total loss less 2,000 retention
Retained                         56.2        5% retained on 1,125 xs 2,000 retention
Recoverable                  (1,068.8)       95% placed on 1,125 xs 2,000 retention                                                                                                                                               (1068.8)

Aggregate excess
recoverable                  (1,068.8)


Hurricane in Texas
      Multi-Year
Loss                          1,000.0
Retention                       399.0        399 retention
Subject Loss                    601.0        Total loss less 361 retention
Retained                         30.0        5% retained on 601 loss xs 399 retention
Recoverable                    (571.0)       95% placed on 601 loss xs 399 retention                                                                               (571.0)

Texas loss                    1,000.0
Less recoverable               (571.0)
Net loss                        429.0

 Aggregate Excess
                                             Retention for multi-year agreement (399 + 30 = 429)
Subject Loss                    429.0
Retained                         21.4        5% retained on 429 loss (limit remaining: 1900 placed less 1068.8 = 831.2)
Recoverable                    (407.6)       95% placed on 429 loss                                                                                                                                                                (407.6)

Aggregate Excess
Recoverable                    (407.6)
Illustration of Utilization of Reinsurance Coverage
The following examples are provided to illustrate to investors Allstate’s reinsurance program and should not be relied upon to determine the amount of Allstate’s net loss from any actual events that may occur
in the future. They are based on hypothetical situations. The actual amounts recoverable under our reinsurance program and the amount of our net loss from any one event or series of events could differ materially from the hypothetical
results presented in these examples due to a variety of factors, including the nature and location of the specific losses incurred, the specific lines of business covered by the various reinsurance agreements, and the impact of potential litigation.

(in millions)                                                                                                                                                                                 Amounts Recoverable by Reinsurance Agreement
                                                                                                                                                                                                                                                                               Allstate Floridian (c)
                                                                                                                                                                                New Jersey        California                    Aggregate         FHCF                     FHCF      Excess of Excess of        Additional
                              Amount                                                Notes                                                 South-East             Multi-year       Excess       Fire Following    Kentucky        Excess          Retention     FHCF        Sliver       Loss      Loss Sliver Excess of Loss


Example 5- continuation

Hurricane in Florida    (d)
   FHCF Retention
Loss                             900.0
Less Ceded                       300.0        Total loss less 300 ceded to Royal Palm and Universal
Net loss                         600.0        Royal Palm and Universal exposure excluded
Retention                         50.0        50 retention
Subject Loss                     550.0        Net loss less 50 retention
Retained                          30.0        30% retained on 100 xs 50 retention
Recoverable                      (70.0)       70% placed on 100 xs 50 retention                                                                                                                                                                      (70.0)
         FHCF
Loss                              900.0
Retention                         243.1       243.1 provisional retention for the FHCF
Subject Loss                      656.9
Total retention                    65.7       10% retained on 656.9 xs 243.1 retention
Total recoverable                (591.2)      90% placed on 656.9 xs 243.1, inclusive of Royal Palm and Universal                                                                                                                                              (591.2)
     FHCF Sliver
Net loss                         600.0        Royal Palm and Universal exposure excluded
Retention                        150.6        150.6 retention
Subject Loss                     449.4        Net loss less 150.6 retention
Recoverable                      (44.9)       10% placed on 449.4 xs of 150.6 limit up to reinsured limit of 47.6                                                                                                                                                           (44.9)
Quota Share
Recoveries
                                              Ceded to Royal Palm and Universal
Ceded loss                       (300.0)
                                              Recovery due Royal Palm and Universal (33.33% of FHCF recovery of 591.2)
FHCF cession                      197.1                                                                                                                                                                                                                            197.1
Net recoverable                  (102.9)

Florida loss                     900.0
Less ceded                       300.0        Ceded to Royal Palm and Universal
Net loss                         600.0

Total recoverables               (706.2)
Less ceded
                                              Ceded to Royal Palm and Universal
recoverable                        197.1
Net recoverables                 (509.1)
Florida loss                        90.9


Total loss                      5,200.0
Less net
recoverables                   (3,031.5)                                                                                                             (475.0)         (571.0)                                                        (1476.4)         (70.0)    (394.1)      (44.9)
Net loss                        2,168.5

(a) Reinsurance premium will be payable to the extent that the reinsurance limit can be reinstated up to a total of $500 million for all qualifying occurrences.
The contract allows one per occurrence reinstatement limit. The amount of reinstatement premium due is equal to the amount of limit reinstated multiplied by the reinsurance premium rate on line and the amount of reinsurance limit placed or 95%.
(b) Reinsurance premiums will be payable to the extent that the reinsurance limit(s) can be reinstated up to a total of $300 million for the New Jersey multi-year and $200 million
for the New Jersey excess for all qualifying occurrences. The amount of premium payable is determined pursuant to the same formula as noted in Note (a) above for the South-East agreement.
(c) Reinsurance coverage for Allstate Floridian will be placed later this year and should become effective June 1, 2007. In order to complete this example, we have assumed that Allstate Floridian's 2006 reinsurance coverage is effective as of June 1, 2007,
including its existing quota share reinsurance agreements with Universal Insurance Company and Royal Palm Insurance Company.
(d) For purposes of this example, the limit of liability and retention applicable to the FHCF have been combined for all Floridian companies

Contenu connexe

Tendances

CBI Comments on Proposed TRIA Regulatory Definitions
CBI Comments on Proposed TRIA Regulatory DefinitionsCBI Comments on Proposed TRIA Regulatory Definitions
CBI Comments on Proposed TRIA Regulatory DefinitionsJasonSchupp1
 
HB Allocation oct2013 Excess and Primary Rights and Obligations
HB Allocation oct2013 Excess and Primary Rights and ObligationsHB Allocation oct2013 Excess and Primary Rights and Obligations
HB Allocation oct2013 Excess and Primary Rights and ObligationsHB Litigation Conferences
 
sims-special features of insurance contract & mortality rate
sims-special features of insurance contract & mortality ratesims-special features of insurance contract & mortality rate
sims-special features of insurance contract & mortality rateSIMS
 
4 Types of Life Insurance
4 Types of Life Insurance4 Types of Life Insurance
4 Types of Life InsuranceMarc Firestone
 
Broker update 2019
Broker update 2019Broker update 2019
Broker update 2019Craig Morton
 
Insurance ; concept, principle, its relevance in developing country like indi...
Insurance ; concept, principle, its relevance in developing country like indi...Insurance ; concept, principle, its relevance in developing country like indi...
Insurance ; concept, principle, its relevance in developing country like indi...Ravi kumar
 
Economic Justification of Life Insurance
Economic Justification of Life Insurance Economic Justification of Life Insurance
Economic Justification of Life Insurance MUDASSAR AFZAL
 
Cover notes policy drafting
Cover notes policy draftingCover notes policy drafting
Cover notes policy draftingDominic Ho
 
I term plan brochure
I term plan brochureI term plan brochure
I term plan brochureSiva Kumar
 
Public-Private Partnerships in Risk Management
Public-Private Partnerships in Risk ManagementPublic-Private Partnerships in Risk Management
Public-Private Partnerships in Risk ManagementGlobal Risk Forum GRFDavos
 
Burnett preparing for nk rising tides-091913
Burnett preparing for nk rising tides-091913Burnett preparing for nk rising tides-091913
Burnett preparing for nk rising tides-091913riseagrant
 
Principles of Insurance
Principles of Insurance Principles of Insurance
Principles of Insurance Ishan Arora
 
Wm 5 insurance planning retirement planning
Wm 5 insurance planning retirement planningWm 5 insurance planning retirement planning
Wm 5 insurance planning retirement planningyogesh ingle
 
Life insurance concept, nature & use of life insurance, distinguishing c...
Life insurance  concept, nature & use of life insurance, distinguishing c...Life insurance  concept, nature & use of life insurance, distinguishing c...
Life insurance concept, nature & use of life insurance, distinguishing c...Ravi kumar
 

Tendances (17)

CBI Comments on Proposed TRIA Regulatory Definitions
CBI Comments on Proposed TRIA Regulatory DefinitionsCBI Comments on Proposed TRIA Regulatory Definitions
CBI Comments on Proposed TRIA Regulatory Definitions
 
HB Allocation oct2013 Excess and Primary Rights and Obligations
HB Allocation oct2013 Excess and Primary Rights and ObligationsHB Allocation oct2013 Excess and Primary Rights and Obligations
HB Allocation oct2013 Excess and Primary Rights and Obligations
 
Government Affairs Foreclosure Plan Deatiled Summary
Government Affairs Foreclosure Plan Deatiled SummaryGovernment Affairs Foreclosure Plan Deatiled Summary
Government Affairs Foreclosure Plan Deatiled Summary
 
sims-special features of insurance contract & mortality rate
sims-special features of insurance contract & mortality ratesims-special features of insurance contract & mortality rate
sims-special features of insurance contract & mortality rate
 
4 Types of Life Insurance
4 Types of Life Insurance4 Types of Life Insurance
4 Types of Life Insurance
 
Broker update 2019
Broker update 2019Broker update 2019
Broker update 2019
 
Insurance ; concept, principle, its relevance in developing country like indi...
Insurance ; concept, principle, its relevance in developing country like indi...Insurance ; concept, principle, its relevance in developing country like indi...
Insurance ; concept, principle, its relevance in developing country like indi...
 
Rethinking Floodplain Management After Katrina
Rethinking Floodplain Management After KatrinaRethinking Floodplain Management After Katrina
Rethinking Floodplain Management After Katrina
 
Economic Justification of Life Insurance
Economic Justification of Life Insurance Economic Justification of Life Insurance
Economic Justification of Life Insurance
 
Cover notes policy drafting
Cover notes policy draftingCover notes policy drafting
Cover notes policy drafting
 
National Flood Insurance Program: The New FEMA Guidelines
National Flood Insurance Program: The New FEMA GuidelinesNational Flood Insurance Program: The New FEMA Guidelines
National Flood Insurance Program: The New FEMA Guidelines
 
I term plan brochure
I term plan brochureI term plan brochure
I term plan brochure
 
Public-Private Partnerships in Risk Management
Public-Private Partnerships in Risk ManagementPublic-Private Partnerships in Risk Management
Public-Private Partnerships in Risk Management
 
Burnett preparing for nk rising tides-091913
Burnett preparing for nk rising tides-091913Burnett preparing for nk rising tides-091913
Burnett preparing for nk rising tides-091913
 
Principles of Insurance
Principles of Insurance Principles of Insurance
Principles of Insurance
 
Wm 5 insurance planning retirement planning
Wm 5 insurance planning retirement planningWm 5 insurance planning retirement planning
Wm 5 insurance planning retirement planning
 
Life insurance concept, nature & use of life insurance, distinguishing c...
Life insurance  concept, nature & use of life insurance, distinguishing c...Life insurance  concept, nature & use of life insurance, distinguishing c...
Life insurance concept, nature & use of life insurance, distinguishing c...
 

En vedette

FedEx Net Income Surges 33 Percent Dec 21, 2005
FedEx Net Income Surges 33 Percent Dec 21, 2005 FedEx Net Income Surges 33 Percent Dec 21, 2005
FedEx Net Income Surges 33 Percent Dec 21, 2005 finance7
 
walt disney Quarter2002 2nd
walt disney  Quarter2002 2ndwalt disney  Quarter2002 2nd
walt disney Quarter2002 2ndfinance7
 
ingram micro Proxy Statement 2003
ingram micro Proxy Statement 2003ingram micro Proxy Statement 2003
ingram micro Proxy Statement 2003finance7
 
allstate Quarterly Investor Information 2005 3rd Earnings Press Release
allstate Quarterly Investor Information 2005 3rd Earnings Press Release allstate Quarterly Investor Information 2005 3rd Earnings Press Release
allstate Quarterly Investor Information 2005 3rd Earnings Press Release finance7
 
FedEx Corp. Net Income Increases 23% in Third Quarter Mar 19, 2003
FedEx Corp. Net Income Increases 23% in Third Quarter Mar 19, 2003 FedEx Corp. Net Income Increases 23% in Third Quarter Mar 19, 2003
FedEx Corp. Net Income Increases 23% in Third Quarter Mar 19, 2003 finance7
 
fedex Annual Reports 2005
fedex Annual Reports 2005fedex Annual Reports 2005
fedex Annual Reports 2005finance7
 
View Summary FedEx Corp. Reports Fourth Quarter and Full Year Earnings Jun ...
View Summary  	FedEx Corp. Reports Fourth Quarter and Full Year Earnings Jun ...View Summary  	FedEx Corp. Reports Fourth Quarter and Full Year Earnings Jun ...
View Summary FedEx Corp. Reports Fourth Quarter and Full Year Earnings Jun ...finance7
 

En vedette (7)

FedEx Net Income Surges 33 Percent Dec 21, 2005
FedEx Net Income Surges 33 Percent Dec 21, 2005 FedEx Net Income Surges 33 Percent Dec 21, 2005
FedEx Net Income Surges 33 Percent Dec 21, 2005
 
walt disney Quarter2002 2nd
walt disney  Quarter2002 2ndwalt disney  Quarter2002 2nd
walt disney Quarter2002 2nd
 
ingram micro Proxy Statement 2003
ingram micro Proxy Statement 2003ingram micro Proxy Statement 2003
ingram micro Proxy Statement 2003
 
allstate Quarterly Investor Information 2005 3rd Earnings Press Release
allstate Quarterly Investor Information 2005 3rd Earnings Press Release allstate Quarterly Investor Information 2005 3rd Earnings Press Release
allstate Quarterly Investor Information 2005 3rd Earnings Press Release
 
FedEx Corp. Net Income Increases 23% in Third Quarter Mar 19, 2003
FedEx Corp. Net Income Increases 23% in Third Quarter Mar 19, 2003 FedEx Corp. Net Income Increases 23% in Third Quarter Mar 19, 2003
FedEx Corp. Net Income Increases 23% in Third Quarter Mar 19, 2003
 
fedex Annual Reports 2005
fedex Annual Reports 2005fedex Annual Reports 2005
fedex Annual Reports 2005
 
View Summary FedEx Corp. Reports Fourth Quarter and Full Year Earnings Jun ...
View Summary  	FedEx Corp. Reports Fourth Quarter and Full Year Earnings Jun ...View Summary  	FedEx Corp. Reports Fourth Quarter and Full Year Earnings Jun ...
View Summary FedEx Corp. Reports Fourth Quarter and Full Year Earnings Jun ...
 

Similaire à allstate Quarterly Investor Information Reinsurance Update2006 4th

allstate Quarter Information Reinsurance Update
allstate Quarter Information Reinsurance Update allstate Quarter Information Reinsurance Update
allstate Quarter Information Reinsurance Update finance7
 
Econ honors thesis jingting yi
Econ honors thesis jingting yiEcon honors thesis jingting yi
Econ honors thesis jingting yiDr Lendy Spires
 
INSURE Act - Summary and Analysis by Centers for Better Insurance
INSURE Act - Summary and Analysis by Centers for Better InsuranceINSURE Act - Summary and Analysis by Centers for Better Insurance
INSURE Act - Summary and Analysis by Centers for Better InsuranceJasonSchupp1
 
TRIA: Duplicative Federal Recoveries
TRIA: Duplicative Federal RecoveriesTRIA: Duplicative Federal Recoveries
TRIA: Duplicative Federal RecoveriesJasonSchupp1
 
The U.S. government subsidizes flood insurance because those who wan.pdf
The U.S. government subsidizes flood insurance because those who wan.pdfThe U.S. government subsidizes flood insurance because those who wan.pdf
The U.S. government subsidizes flood insurance because those who wan.pdfseasonsnu
 
The U_S_ Federal Crop Insurance Program
The U_S_ Federal Crop Insurance ProgramThe U_S_ Federal Crop Insurance Program
The U_S_ Federal Crop Insurance ProgramJames Callan
 
Conservation Strategies For Today Global Real Estate Market Pp[1]
Conservation Strategies For Today Global Real Estate Market Pp[1]Conservation Strategies For Today Global Real Estate Market Pp[1]
Conservation Strategies For Today Global Real Estate Market Pp[1]marksofge
 
Aig Government Bailout
Aig Government BailoutAig Government Bailout
Aig Government BailoutAIGdocs
 
AIG Third Quarter 2008 U.S. Treasury, Federal Reserve and AIG Establish Comp...
AIG Third Quarter 2008  U.S. Treasury, Federal Reserve and AIG Establish Comp...AIG Third Quarter 2008  U.S. Treasury, Federal Reserve and AIG Establish Comp...
AIG Third Quarter 2008 U.S. Treasury, Federal Reserve and AIG Establish Comp...finance2
 
Session 31 Power Point
Session 31   Power PointSession 31   Power Point
Session 31 Power Pointhiratufail
 
California Climate Insurance Working Group Sizes Up Parametric Solutions
California Climate Insurance Working Group Sizes Up Parametric SolutionsCalifornia Climate Insurance Working Group Sizes Up Parametric Solutions
California Climate Insurance Working Group Sizes Up Parametric SolutionsJasonSchupp1
 
Types of insurance By SHAMSIKADALUR MBA
Types of insurance By SHAMSIKADALUR MBATypes of insurance By SHAMSIKADALUR MBA
Types of insurance By SHAMSIKADALUR MBAshamsikadalur
 
Property & Liability Insurance
Property & Liability InsuranceProperty & Liability Insurance
Property & Liability InsuranceDeepak S. Verma
 
FIO's 2022 Climate Data Call - CBI's Comments
FIO's 2022 Climate Data Call - CBI's CommentsFIO's 2022 Climate Data Call - CBI's Comments
FIO's 2022 Climate Data Call - CBI's CommentsJasonSchupp1
 
What Is A FIxed Deferred Annuity?
What Is A FIxed Deferred Annuity?What Is A FIxed Deferred Annuity?
What Is A FIxed Deferred Annuity?Hollyortego
 
Insurance Abroad
Insurance AbroadInsurance Abroad
Insurance AbroadTICS
 
Kintera - Disaster Recovery
Kintera - Disaster RecoveryKintera - Disaster Recovery
Kintera - Disaster RecoveryEsther Chiu
 
Financial Protection Strategies and the Role of CCRIF SPC
Financial Protection Strategies and the Role of CCRIF SPCFinancial Protection Strategies and the Role of CCRIF SPC
Financial Protection Strategies and the Role of CCRIF SPCCaribbean Development Bank
 
A Comparison Of Hurricane Loss Models
A Comparison Of Hurricane Loss ModelsA Comparison Of Hurricane Loss Models
A Comparison Of Hurricane Loss ModelsAllison Thompson
 

Similaire à allstate Quarterly Investor Information Reinsurance Update2006 4th (20)

allstate Quarter Information Reinsurance Update
allstate Quarter Information Reinsurance Update allstate Quarter Information Reinsurance Update
allstate Quarter Information Reinsurance Update
 
Econ honors thesis jingting yi
Econ honors thesis jingting yiEcon honors thesis jingting yi
Econ honors thesis jingting yi
 
INSURE Act - Summary and Analysis by Centers for Better Insurance
INSURE Act - Summary and Analysis by Centers for Better InsuranceINSURE Act - Summary and Analysis by Centers for Better Insurance
INSURE Act - Summary and Analysis by Centers for Better Insurance
 
TRIA: Duplicative Federal Recoveries
TRIA: Duplicative Federal RecoveriesTRIA: Duplicative Federal Recoveries
TRIA: Duplicative Federal Recoveries
 
The U.S. government subsidizes flood insurance because those who wan.pdf
The U.S. government subsidizes flood insurance because those who wan.pdfThe U.S. government subsidizes flood insurance because those who wan.pdf
The U.S. government subsidizes flood insurance because those who wan.pdf
 
The U_S_ Federal Crop Insurance Program
The U_S_ Federal Crop Insurance ProgramThe U_S_ Federal Crop Insurance Program
The U_S_ Federal Crop Insurance Program
 
Conservation Strategies For Today Global Real Estate Market Pp[1]
Conservation Strategies For Today Global Real Estate Market Pp[1]Conservation Strategies For Today Global Real Estate Market Pp[1]
Conservation Strategies For Today Global Real Estate Market Pp[1]
 
Aig Government Bailout
Aig Government BailoutAig Government Bailout
Aig Government Bailout
 
AIG Third Quarter 2008 U.S. Treasury, Federal Reserve and AIG Establish Comp...
AIG Third Quarter 2008  U.S. Treasury, Federal Reserve and AIG Establish Comp...AIG Third Quarter 2008  U.S. Treasury, Federal Reserve and AIG Establish Comp...
AIG Third Quarter 2008 U.S. Treasury, Federal Reserve and AIG Establish Comp...
 
Session 31 Power Point
Session 31   Power PointSession 31   Power Point
Session 31 Power Point
 
CTAR Lunch & Learn: 2013 Flood Insurance Changes
CTAR Lunch & Learn: 2013 Flood Insurance ChangesCTAR Lunch & Learn: 2013 Flood Insurance Changes
CTAR Lunch & Learn: 2013 Flood Insurance Changes
 
California Climate Insurance Working Group Sizes Up Parametric Solutions
California Climate Insurance Working Group Sizes Up Parametric SolutionsCalifornia Climate Insurance Working Group Sizes Up Parametric Solutions
California Climate Insurance Working Group Sizes Up Parametric Solutions
 
Types of insurance By SHAMSIKADALUR MBA
Types of insurance By SHAMSIKADALUR MBATypes of insurance By SHAMSIKADALUR MBA
Types of insurance By SHAMSIKADALUR MBA
 
Property & Liability Insurance
Property & Liability InsuranceProperty & Liability Insurance
Property & Liability Insurance
 
FIO's 2022 Climate Data Call - CBI's Comments
FIO's 2022 Climate Data Call - CBI's CommentsFIO's 2022 Climate Data Call - CBI's Comments
FIO's 2022 Climate Data Call - CBI's Comments
 
What Is A FIxed Deferred Annuity?
What Is A FIxed Deferred Annuity?What Is A FIxed Deferred Annuity?
What Is A FIxed Deferred Annuity?
 
Insurance Abroad
Insurance AbroadInsurance Abroad
Insurance Abroad
 
Kintera - Disaster Recovery
Kintera - Disaster RecoveryKintera - Disaster Recovery
Kintera - Disaster Recovery
 
Financial Protection Strategies and the Role of CCRIF SPC
Financial Protection Strategies and the Role of CCRIF SPCFinancial Protection Strategies and the Role of CCRIF SPC
Financial Protection Strategies and the Role of CCRIF SPC
 
A Comparison Of Hurricane Loss Models
A Comparison Of Hurricane Loss ModelsA Comparison Of Hurricane Loss Models
A Comparison Of Hurricane Loss Models
 

Plus de finance7

sysco Return on Total Capital
sysco Return on Total Capitalsysco Return on Total Capital
sysco Return on Total Capitalfinance7
 
sysco Annual Reports2002
sysco Annual Reports2002sysco Annual Reports2002
sysco Annual Reports2002finance7
 
sysco Annual Reports2001
sysco Annual Reports2001sysco Annual Reports2001
sysco Annual Reports2001finance7
 
sysco Annual Reports2002
sysco Annual Reports2002sysco Annual Reports2002
sysco Annual Reports2002finance7
 
sysco Annual Reports2003
sysco Annual Reports2003sysco Annual Reports2003
sysco Annual Reports2003finance7
 
sysco Annual Reports2004
sysco Annual Reports2004sysco Annual Reports2004
sysco Annual Reports2004finance7
 
sysco Annual Reports2005
sysco Annual Reports2005sysco Annual Reports2005
sysco Annual Reports2005finance7
 
sysco Annual Reports2006
sysco Annual Reports2006sysco Annual Reports2006
sysco Annual Reports2006finance7
 
sysco Annual Reports2008
sysco Annual Reports2008sysco Annual Reports2008
sysco Annual Reports2008finance7
 
Summary of Reconciling Items 2001
Summary of Reconciling Items 2001Summary of Reconciling Items 2001
Summary of Reconciling Items 2001finance7
 
Regional Operating Income Bridge 2001
Regional Operating Income Bridge 2001Regional Operating Income Bridge 2001
Regional Operating Income Bridge 2001finance7
 
Net Income and EPS Bridge 2001
Net Income and EPS Bridge 2001Net Income and EPS Bridge 2001
Net Income and EPS Bridge 2001finance7
 
Summary of Reconciling Items 2002
Summary of Reconciling Items 2002Summary of Reconciling Items 2002
Summary of Reconciling Items 2002finance7
 
Regional Operating Income Bridge 2002
Regional Operating Income Bridge 2002Regional Operating Income Bridge 2002
Regional Operating Income Bridge 2002finance7
 
Net Income and EPS Bridge 2002
Net Income and EPS Bridge 2002Net Income and EPS Bridge 2002
Net Income and EPS Bridge 2002finance7
 
Summary of Reconciling Items 2003
Summary of Reconciling Items 2003Summary of Reconciling Items 2003
Summary of Reconciling Items 2003finance7
 
Regional Operating Income Bridge 2003
Regional Operating Income Bridge 2003Regional Operating Income Bridge 2003
Regional Operating Income Bridge 2003finance7
 
Net Income and EPS Bridge 2003
Net Income and EPS Bridge 2003Net Income and EPS Bridge 2003
Net Income and EPS Bridge 2003finance7
 
Summary of Reconciling Items 2004
Summary of Reconciling Items 2004Summary of Reconciling Items 2004
Summary of Reconciling Items 2004finance7
 
Regional Operating Income Bridge 2004
Regional Operating Income Bridge 2004Regional Operating Income Bridge 2004
Regional Operating Income Bridge 2004finance7
 

Plus de finance7 (20)

sysco Return on Total Capital
sysco Return on Total Capitalsysco Return on Total Capital
sysco Return on Total Capital
 
sysco Annual Reports2002
sysco Annual Reports2002sysco Annual Reports2002
sysco Annual Reports2002
 
sysco Annual Reports2001
sysco Annual Reports2001sysco Annual Reports2001
sysco Annual Reports2001
 
sysco Annual Reports2002
sysco Annual Reports2002sysco Annual Reports2002
sysco Annual Reports2002
 
sysco Annual Reports2003
sysco Annual Reports2003sysco Annual Reports2003
sysco Annual Reports2003
 
sysco Annual Reports2004
sysco Annual Reports2004sysco Annual Reports2004
sysco Annual Reports2004
 
sysco Annual Reports2005
sysco Annual Reports2005sysco Annual Reports2005
sysco Annual Reports2005
 
sysco Annual Reports2006
sysco Annual Reports2006sysco Annual Reports2006
sysco Annual Reports2006
 
sysco Annual Reports2008
sysco Annual Reports2008sysco Annual Reports2008
sysco Annual Reports2008
 
Summary of Reconciling Items 2001
Summary of Reconciling Items 2001Summary of Reconciling Items 2001
Summary of Reconciling Items 2001
 
Regional Operating Income Bridge 2001
Regional Operating Income Bridge 2001Regional Operating Income Bridge 2001
Regional Operating Income Bridge 2001
 
Net Income and EPS Bridge 2001
Net Income and EPS Bridge 2001Net Income and EPS Bridge 2001
Net Income and EPS Bridge 2001
 
Summary of Reconciling Items 2002
Summary of Reconciling Items 2002Summary of Reconciling Items 2002
Summary of Reconciling Items 2002
 
Regional Operating Income Bridge 2002
Regional Operating Income Bridge 2002Regional Operating Income Bridge 2002
Regional Operating Income Bridge 2002
 
Net Income and EPS Bridge 2002
Net Income and EPS Bridge 2002Net Income and EPS Bridge 2002
Net Income and EPS Bridge 2002
 
Summary of Reconciling Items 2003
Summary of Reconciling Items 2003Summary of Reconciling Items 2003
Summary of Reconciling Items 2003
 
Regional Operating Income Bridge 2003
Regional Operating Income Bridge 2003Regional Operating Income Bridge 2003
Regional Operating Income Bridge 2003
 
Net Income and EPS Bridge 2003
Net Income and EPS Bridge 2003Net Income and EPS Bridge 2003
Net Income and EPS Bridge 2003
 
Summary of Reconciling Items 2004
Summary of Reconciling Items 2004Summary of Reconciling Items 2004
Summary of Reconciling Items 2004
 
Regional Operating Income Bridge 2004
Regional Operating Income Bridge 2004Regional Operating Income Bridge 2004
Regional Operating Income Bridge 2004
 

Dernier

Stock Market Brief Deck FOR 4/17 video.pdf
Stock Market Brief Deck FOR 4/17 video.pdfStock Market Brief Deck FOR 4/17 video.pdf
Stock Market Brief Deck FOR 4/17 video.pdfMichael Silva
 
NO1 WorldWide Genuine vashikaran specialist Vashikaran baba near Lahore Vashi...
NO1 WorldWide Genuine vashikaran specialist Vashikaran baba near Lahore Vashi...NO1 WorldWide Genuine vashikaran specialist Vashikaran baba near Lahore Vashi...
NO1 WorldWide Genuine vashikaran specialist Vashikaran baba near Lahore Vashi...Amil baba
 
Tenets of Physiocracy History of Economic
Tenets of Physiocracy History of EconomicTenets of Physiocracy History of Economic
Tenets of Physiocracy History of Economiccinemoviesu
 
AfRESFullPaper22018EmpiricalPerformanceofRealEstateInvestmentTrustsandShareho...
AfRESFullPaper22018EmpiricalPerformanceofRealEstateInvestmentTrustsandShareho...AfRESFullPaper22018EmpiricalPerformanceofRealEstateInvestmentTrustsandShareho...
AfRESFullPaper22018EmpiricalPerformanceofRealEstateInvestmentTrustsandShareho...yordanosyohannes2
 
Call Girls Near Me WhatsApp:+91-9833363713
Call Girls Near Me WhatsApp:+91-9833363713Call Girls Near Me WhatsApp:+91-9833363713
Call Girls Near Me WhatsApp:+91-9833363713Sonam Pathan
 
(中央兰开夏大学毕业证学位证成绩单-案例)
(中央兰开夏大学毕业证学位证成绩单-案例)(中央兰开夏大学毕业证学位证成绩单-案例)
(中央兰开夏大学毕业证学位证成绩单-案例)twfkn8xj
 
原版1:1复刻温哥华岛大学毕业证Vancouver毕业证留信学历认证
原版1:1复刻温哥华岛大学毕业证Vancouver毕业证留信学历认证原版1:1复刻温哥华岛大学毕业证Vancouver毕业证留信学历认证
原版1:1复刻温哥华岛大学毕业证Vancouver毕业证留信学历认证rjrjkk
 
Stock Market Brief Deck for "this does not happen often".pdf
Stock Market Brief Deck for "this does not happen often".pdfStock Market Brief Deck for "this does not happen often".pdf
Stock Market Brief Deck for "this does not happen often".pdfMichael Silva
 
Bladex 1Q24 Earning Results Presentation
Bladex 1Q24 Earning Results PresentationBladex 1Q24 Earning Results Presentation
Bladex 1Q24 Earning Results PresentationBladex
 
The Core Functions of the Bangko Sentral ng Pilipinas
The Core Functions of the Bangko Sentral ng PilipinasThe Core Functions of the Bangko Sentral ng Pilipinas
The Core Functions of the Bangko Sentral ng PilipinasCherylouCamus
 
Monthly Market Risk Update: April 2024 [SlideShare]
Monthly Market Risk Update: April 2024 [SlideShare]Monthly Market Risk Update: April 2024 [SlideShare]
Monthly Market Risk Update: April 2024 [SlideShare]Commonwealth
 
NO1 WorldWide online istikhara for love marriage vashikaran specialist love p...
NO1 WorldWide online istikhara for love marriage vashikaran specialist love p...NO1 WorldWide online istikhara for love marriage vashikaran specialist love p...
NO1 WorldWide online istikhara for love marriage vashikaran specialist love p...Amil Baba Dawood bangali
 
magnetic-pensions-a-new-blueprint-for-the-dc-landscape.pdf
magnetic-pensions-a-new-blueprint-for-the-dc-landscape.pdfmagnetic-pensions-a-new-blueprint-for-the-dc-landscape.pdf
magnetic-pensions-a-new-blueprint-for-the-dc-landscape.pdfHenry Tapper
 
Quantitative Analysis of Retail Sector Companies
Quantitative Analysis of Retail Sector CompaniesQuantitative Analysis of Retail Sector Companies
Quantitative Analysis of Retail Sector Companiesprashantbhati354
 
Current Economic situation of Pakistan .pptx
Current Economic situation of Pakistan .pptxCurrent Economic situation of Pakistan .pptx
Current Economic situation of Pakistan .pptxuzma244191
 
How Automation is Driving Efficiency Through the Last Mile of Reporting
How Automation is Driving Efficiency Through the Last Mile of ReportingHow Automation is Driving Efficiency Through the Last Mile of Reporting
How Automation is Driving Efficiency Through the Last Mile of ReportingAggregage
 
NO1 WorldWide Love marriage specialist baba ji Amil Baba Kala ilam powerful v...
NO1 WorldWide Love marriage specialist baba ji Amil Baba Kala ilam powerful v...NO1 WorldWide Love marriage specialist baba ji Amil Baba Kala ilam powerful v...
NO1 WorldWide Love marriage specialist baba ji Amil Baba Kala ilam powerful v...Amil baba
 
chapter_2.ppt The labour market definitions and trends
chapter_2.ppt The labour market definitions and trendschapter_2.ppt The labour market definitions and trends
chapter_2.ppt The labour market definitions and trendslemlemtesfaye192
 
NO1 Certified Ilam kala Jadu Specialist Expert In Bahawalpur, Sargodha, Sialk...
NO1 Certified Ilam kala Jadu Specialist Expert In Bahawalpur, Sargodha, Sialk...NO1 Certified Ilam kala Jadu Specialist Expert In Bahawalpur, Sargodha, Sialk...
NO1 Certified Ilam kala Jadu Specialist Expert In Bahawalpur, Sargodha, Sialk...Amil Baba Dawood bangali
 

Dernier (20)

Stock Market Brief Deck FOR 4/17 video.pdf
Stock Market Brief Deck FOR 4/17 video.pdfStock Market Brief Deck FOR 4/17 video.pdf
Stock Market Brief Deck FOR 4/17 video.pdf
 
NO1 WorldWide Genuine vashikaran specialist Vashikaran baba near Lahore Vashi...
NO1 WorldWide Genuine vashikaran specialist Vashikaran baba near Lahore Vashi...NO1 WorldWide Genuine vashikaran specialist Vashikaran baba near Lahore Vashi...
NO1 WorldWide Genuine vashikaran specialist Vashikaran baba near Lahore Vashi...
 
Tenets of Physiocracy History of Economic
Tenets of Physiocracy History of EconomicTenets of Physiocracy History of Economic
Tenets of Physiocracy History of Economic
 
AfRESFullPaper22018EmpiricalPerformanceofRealEstateInvestmentTrustsandShareho...
AfRESFullPaper22018EmpiricalPerformanceofRealEstateInvestmentTrustsandShareho...AfRESFullPaper22018EmpiricalPerformanceofRealEstateInvestmentTrustsandShareho...
AfRESFullPaper22018EmpiricalPerformanceofRealEstateInvestmentTrustsandShareho...
 
Call Girls Near Me WhatsApp:+91-9833363713
Call Girls Near Me WhatsApp:+91-9833363713Call Girls Near Me WhatsApp:+91-9833363713
Call Girls Near Me WhatsApp:+91-9833363713
 
(中央兰开夏大学毕业证学位证成绩单-案例)
(中央兰开夏大学毕业证学位证成绩单-案例)(中央兰开夏大学毕业证学位证成绩单-案例)
(中央兰开夏大学毕业证学位证成绩单-案例)
 
原版1:1复刻温哥华岛大学毕业证Vancouver毕业证留信学历认证
原版1:1复刻温哥华岛大学毕业证Vancouver毕业证留信学历认证原版1:1复刻温哥华岛大学毕业证Vancouver毕业证留信学历认证
原版1:1复刻温哥华岛大学毕业证Vancouver毕业证留信学历认证
 
Stock Market Brief Deck for "this does not happen often".pdf
Stock Market Brief Deck for "this does not happen often".pdfStock Market Brief Deck for "this does not happen often".pdf
Stock Market Brief Deck for "this does not happen often".pdf
 
Bladex 1Q24 Earning Results Presentation
Bladex 1Q24 Earning Results PresentationBladex 1Q24 Earning Results Presentation
Bladex 1Q24 Earning Results Presentation
 
The Core Functions of the Bangko Sentral ng Pilipinas
The Core Functions of the Bangko Sentral ng PilipinasThe Core Functions of the Bangko Sentral ng Pilipinas
The Core Functions of the Bangko Sentral ng Pilipinas
 
Monthly Market Risk Update: April 2024 [SlideShare]
Monthly Market Risk Update: April 2024 [SlideShare]Monthly Market Risk Update: April 2024 [SlideShare]
Monthly Market Risk Update: April 2024 [SlideShare]
 
NO1 WorldWide online istikhara for love marriage vashikaran specialist love p...
NO1 WorldWide online istikhara for love marriage vashikaran specialist love p...NO1 WorldWide online istikhara for love marriage vashikaran specialist love p...
NO1 WorldWide online istikhara for love marriage vashikaran specialist love p...
 
magnetic-pensions-a-new-blueprint-for-the-dc-landscape.pdf
magnetic-pensions-a-new-blueprint-for-the-dc-landscape.pdfmagnetic-pensions-a-new-blueprint-for-the-dc-landscape.pdf
magnetic-pensions-a-new-blueprint-for-the-dc-landscape.pdf
 
🔝+919953056974 🔝young Delhi Escort service Pusa Road
🔝+919953056974 🔝young Delhi Escort service Pusa Road🔝+919953056974 🔝young Delhi Escort service Pusa Road
🔝+919953056974 🔝young Delhi Escort service Pusa Road
 
Quantitative Analysis of Retail Sector Companies
Quantitative Analysis of Retail Sector CompaniesQuantitative Analysis of Retail Sector Companies
Quantitative Analysis of Retail Sector Companies
 
Current Economic situation of Pakistan .pptx
Current Economic situation of Pakistan .pptxCurrent Economic situation of Pakistan .pptx
Current Economic situation of Pakistan .pptx
 
How Automation is Driving Efficiency Through the Last Mile of Reporting
How Automation is Driving Efficiency Through the Last Mile of ReportingHow Automation is Driving Efficiency Through the Last Mile of Reporting
How Automation is Driving Efficiency Through the Last Mile of Reporting
 
NO1 WorldWide Love marriage specialist baba ji Amil Baba Kala ilam powerful v...
NO1 WorldWide Love marriage specialist baba ji Amil Baba Kala ilam powerful v...NO1 WorldWide Love marriage specialist baba ji Amil Baba Kala ilam powerful v...
NO1 WorldWide Love marriage specialist baba ji Amil Baba Kala ilam powerful v...
 
chapter_2.ppt The labour market definitions and trends
chapter_2.ppt The labour market definitions and trendschapter_2.ppt The labour market definitions and trends
chapter_2.ppt The labour market definitions and trends
 
NO1 Certified Ilam kala Jadu Specialist Expert In Bahawalpur, Sargodha, Sialk...
NO1 Certified Ilam kala Jadu Specialist Expert In Bahawalpur, Sargodha, Sialk...NO1 Certified Ilam kala Jadu Specialist Expert In Bahawalpur, Sargodha, Sialk...
NO1 Certified Ilam kala Jadu Specialist Expert In Bahawalpur, Sargodha, Sialk...
 

allstate Quarterly Investor Information Reinsurance Update2006 4th

  • 1. Catastrophe Reinsurance Program Effective June 1, 2007 to May 31, 2008 Northbrook, Ill., January 30, 2007 –Our personal property catastrophe reinsurance program for Allstate Protection, the property and casualty business unit of The Allstate Corporation (NYSE: ALL), has now been completed with the exception of the state of Florida. The Florida program, which will be placed later this year once the state’s recent legislative actions have been assessed, should become effective June 1, 2007, the beginning of the hurricane catastrophe season. Our personal lines catastrophe reinsurance program was designed, utilizing our risk management methodology, to address our exposure to catastrophes nationwide. Our program provides reinsurance protection to us for catastrophes including storms named or numbered by the National Weather Service, earthquakes and fires following earthquakes. These reinsurance agreements are part of our catastrophe management strategy, which is intended to provide our shareholders an acceptable return on the risks assumed in our property business and to reduce variability of earnings, while providing protection to our customers. Our program coordinates coverage under various agreements. As discussed below, our reinsurance program is comprised of agreements that provide coverage for the occurrence of certain qualifying catastrophes in specific states including New York, New Jersey, Connecticut and Texas ( “multi-year”); other states along the southern and eastern coasts ( “South-East”) principally for hurricanes; in California for fires following earthquakes ( “California fires following”); in New Jersey for losses in excess of the multi year agreement (“New Jersey excess”) and in Kentucky for earthquakes and fires following earthquakes ( “Kentucky”). Another reinsurance agreement provides coverage nationwide, excluding Florida, for the aggregate or sum of catastrophe losses in excess of an annual retention associated with storms named or numbered by the National Weather Service, earthquakes and fires following earthquakes (“aggregate excess”). The Florida component of the reinsurance program is designed separately from the other components of the program to address the distinct needs of our separately capitalized legal entities in that state. During January 2007 we completed the renewal of our aggregate excess, South-East and New Jersey excess reinsurance contracts, opted to expand coverage in the existing multi-year contracts in the states of Texas and New Jersey and added a new agreement covering Kentucky earthquake and fires following earthquakes. These contracts will be effective June 1, 2007 to May 31, 2008, with the exception of the aggregate excess contract which is effective June 1, 2007 to May 31, 2009. The multi-year agreements have various retentions and limits designed commensurate with the amount of catastrophe risk, measured on an annual basis, in each covered state. A description of these retentions and limits appears in the following tables and charts. The multi-year, California fires following, New Jersey excess, South-East and Kentucky agreements cover qualifying losses related to a specific qualifying event in excess of the agreement’s retention. Reinsurance recoveries under each agreement are equal to the qualifying losses in excess of the agreement’s retention for a specific event multiplied by the percentage of reinsurance placed up to the agreement’s occurrence limit. The South-East agreement provides coverage for Allstate Protection personal property excess catastrophe losses for storms named or numbered by the National Weather Service, effective June 1, 2007 for one year. The South-East agreement covers $500 million of losses in excess of $500 million, of which Allstate retains 5%. This agreement reinsures losses in the states of Louisiana, Mississippi, Alabama, Georgia, South Carolina, North Carolina, Virginia, Maryland, Delaware, Pennsylvania and Rhode Island and the District of Columbia. Unlike the multi-year agreements, the South-East agreement provides that losses resulting from the same occurrence 1
  • 2. but taking place in various states may be combined to meet the agreements per occurrence retention and limit. The New Jersey excess agreement provides coverage for Allstate Protection personal property excess catastrophe losses in the state of New Jersey from events such as hurricanes and earthquakes, effective June 1, 2007 for one year. This agreement is for $200 million of coverage in excess of our existing multi-year agreement in the state, with Allstate retaining 5%. The multi- year agreement covers 95% of losses of $300 million in excess of $140 million. The Kentucky agreement provides coverage for Allstate Protection personal property excess catastrophe losses in the state of Kentucky for earthquake and fires following earthquakes, effective June 1, 2007 for one year. This agreement is for $40 million of coverage, in excess of $10 million with Allstate retaining 5%. The aggregate excess agreement provides coverage for the aggregate or sum of all qualifying losses incurred nationwide, except Florida, in excess of $2 billion of aggregated qualifying losses up to the limit of $2 billion arising from three covered perils: storms named or numbered by the National Weather Service, earthquakes and fires following earthquakes, with 5% retained by Allstate in the first year and 20% retained by Allstate in the second year. Losses recoverable from the multi-year, California fires following, New Jersey excess, South-East and Kentucky agreements are excluded when determining the retention of the aggregate excess agreement to the extent that the loss recoveries conform to the named peril coverage in the aggregate excess agreement. Conversely, losses retained under, or which exceed the limits of, the multi-year, California fires following, New Jersey excess, South-East and Kentucky agreements and qualifying as covered named peril losses under the aggregate excess agreement are covered. When we placed the aggregate excess agreement this year, we designed it to treat losses recoverable from the South-East excess agreement identical to the treatment accorded the multi- year, California fires following, New Jersey excess and Kentucky agreements, as noted above. The multi-year, California fires following, New Jersey excess, South-East, and Kentucky agreements expire on May 31, 2008. The aggregate excess agreement was placed with a one year term and two year term. For the first year, effective June 1, 2007 to May 31, 2008, Allstate retains 5% of the $2 billion reinsurance limit. The one year term for the period June 1, 2007 to May 31, 2008 is 15% placed or $0.3 billion of the $2.0 billion limit. A separately placed two year term is for the period June 1, 2007 to May 31, 2009 and Allstate also retains 5% of the $2.0 billion reinsurance limit. The two year term for the period June 1, 2007 to May 31, 2009 is 80% placed for both years or $1.6 billion of the $2.0 billion limit. For the second year of the two year term, which expires on May 31, 2009, Allstate has the option to place an additional 15% or $300 million of the $2.0 billion limit. Allstate has stipulated that the coverage provided by the multi-year, California fires following, New Jersey excess, South-East and Kentucky agreements will be in place for the purpose of making loss recoveries throughout the two-year duration of the aggregate excess agreement. The reinsurance agreements have been placed in the global reinsurance market, with the majority of the limits placed with reinsurers who currently have an A.M. Best insurance financial strength rating of A+ or better. The remaining limits are placed with reinsurers who currently have an A.M. Best insurance financial strength rating no lower than A-, with three exceptions. Two of the three exceptions have a Standard and Poors rating of AA- and we will have collateral for the entire contract limit exposure for the third reinsurer which is not rated by either rating agency. We expanded the number of reinsurance participants on our program and placed approximately $215 million or 11% of the aggregate excess agreement limits for June 1, 2007 to May 31, 2008 period and $30 million or 6% of the South-East agreement limit with alternative market sources. Alternative market sources refers to a reinsurer that hedge funds, private equity firms, or investment banks substantially or wholly support; retrocedes 100% of its assumed liability to a specific retrocessionaire; or provides collateral to us equal to its assumed per occurrence limit. 2
  • 3. We estimate that the total annualized cost of all reinsurance programs will be approximately $770 million per year or $193 million per quarter, including an estimate for reinsurance coverage in Florida. This is compared to approximately $800 million per year from our total annualized cost during the 2006 hurricane season, or an estimated decrease of $30 million due to lower expected cost of coverage in Florida. This is compared to a cost of $73 million in the first quarter, $114 million in the second quarter, $211 million in the third quarter and $209 million in the fourth quarter of 2006. We currently expect that a similar level of coverage will be purchased or renewed for the comparable 2008 period. The actual placement of the Florida program, contractual redeterminations and risk transfers of certain catastrophe and other liability exposures during 2007 may cause our total annualized cost to differ from our current estimates. The Florida program will be placed later this year, once the state’s recent legislative actions have been assessed, and should become effective on June 1, 2007 for the beginning of the hurricane catastrophe season. The terms, retentions and limits for all of Allstate’s catastrophe management reinsurance agreements in place as of June 30, 2007 are listed in the following table. % Per Occurrence (in millions) Effective Date Placed Reinstatement Retention Limit Coordinated coverage Aggregate excess(1) 6/1/2007 95 for None $2,000 $2,000 year 1; 80 for year 2 California fire following(2) 2/1/2006 95 2 limits over 28 month 520 1,500 term, prepaid Multi-year(3): 6/1/2005 Connecticut 95 2 limits over remaining 129 200 term, prepaid New Jersey 95 1 reinstatement each 140 300 contract year over 3-year term, premium required New York(4) 90 2 limits over remaining 830 1,000 term, prepaid Texas(5) 95 2 limits over remaining 399 750 term, prepaid New Jersey excess(6) 6/1/2007 95 1 reinstatement, premium 440 200 required South-East(7) 6/1/2007 95 1 reinstatement premium 500 500 required Kentucky (8) 6/1/2007 95 1 reinstatement, premium 10 40 required 3
  • 4. Coordinated Coverage (1) Aggregate Excess Agreement – This agreement has a one year term, effective 6/1/2007 to 5/31/2008, and a two year term, effective 6/1/2007 to 5/31/2009. It covers the aggregation of qualifying losses for storms named or numbered by the National Weather Service, earthquakes and fires following earthquakes for Allstate Protection personal lines auto and property business countrywide, except for Florida, in excess of $2 billion in aggregated losses per contract year. Losses recoverable if any, from our California fires following, multi-year, New Jersey excess, South-East and Kentucky agreements are excluded when determining the retention of this agreement. The one year contract is 15% placed or $.3 billion of the total $2 billion limit. The two year term contract is 80% placed or $1.6 billion of the total $2 billion limit leaving Allstate the option to place up to an additional 15% in year two. The aggregate excess agreement in effect for 6/1/2006 to 5/31/2007 was placed prior to the South-East agreement and accordingly did not provide for its consideration. The preliminary reinsurance premium is subject to redetermination for exposure changes. (2) California Fire Following Agreement – This agreement is effective 2/1/2006 and expires 5/31/2008. This agreement covers Allstate Protection personal property excess catastrophe losses in California for fires following earthquakes. This agreement provides $1.5 billion of coverage for all qualifying losses with one reinstatement except when a qualifying loss occurrence exceeds $2 billion, then for 21 days no additional recovery can occur for any losses within the same seismic geographically affected area. The retention on this agreement is subject to remeasurement. (3) Multi-year Agreements – These agreements have been in effect since 6/1/2005 and cover the Allstate brand personal property excess catastrophe losses, expiring 5/31/2008. The retentions on these agreements are subject to annual remeasurements on their anniversary dates. The Company is planning to elect $100 million of additional coverage effective 6/1/2007 in the states of Texas and New Jersey. (4) Two separate reinsurance agreements provide coverage for catastrophe risks in the state of New York: Allstate Insurance Company (“AIC”) has a $512 retention and a $550 limit, and Allstate Indemnity Company (“AI”) has a $318 retention and a $450 limit. (5) The Texas agreement is with Allstate Texas Lloyd’s (“ATL”), a syndicate insurance company. ATL also has a 100% reinsurance agreement with AIC covering losses in excess of and/or not reinsured by the Texas agreement. (6) New Jersey Excess – This agreement is effective 6/1/2007 for 1 year and covers Allstate Protection personal property catastrophe losses in excess of the New Jersey multi-year agreement. (7) South-East – This agreement is effective 6/1/2007 for 1 year and covers Allstate Protection personal property excess catastrophe losses for storms named or numbered by the National Weather Service. This agreement covers personal property business in the states of Louisiana, Mississippi, Alabama, Georgia, South Carolina, North Carolina, Virginia, Maryland, Delaware, Pennsylvania and Rhode Island and the District of Columbia. The South-East agreement in effect for 6/1/2006 to 5/31/2007 did not cover business in Rhode Island, provided one reinstatement of $180 million of the $400 million limit placed and was 80% placed. The preliminary reinsurance premium is subject to redetermination for exposure changes. (8) Kentucky – This agreement is effective 6/1/2007 for one-year and covers Allstate Protection’s personal property excess catastrophe losses for earthquakes and fires following earthquakes. 4
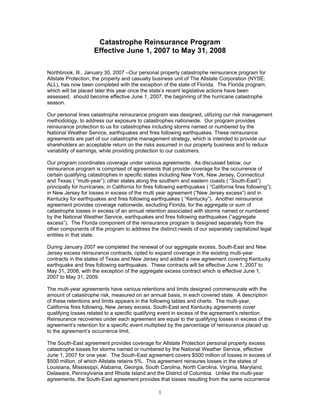
  • 5. Current 2007 Reinsurance Programs by State (excluding Florida) For Illustrative Purposes only. Not intended to reflect all terms of all agreements. $ Millions - not to scale 4,000 3,500 2,000 xs 2,000 · 300 xs 2,000 one year contract June 1, 2007 to May 31, 2008/ 5% retained,15% placed 3,000 · 1,600 xs 2,000 two year contract June 1, 2007 to May 31, 2009/ 20% retained, 80% placed 6/1/08 to 5/31/09/ 15% of the 20% retention can be placed 2,500 2,000 1,500 1,500 xs 520 5% retained/ 95% placed 1,000 AIC 550 xs 512 500 xs 500 10% retained/ 5% retained/ 90% placed 95% placed 750 750 xs 399 5% retained/ AI 95% placed 450 xs 318 10% retained/ 500 200 xs Multi-year 90% placed 5% retained/ 95% placed 300 xs 140 250 200 xs 129 5% retained/ 5% retained/ 95% placed 95% placed 40 xs 10 5% retained/ 95% placed NY CA CT NJ TX South-East KY All Other States ex FL (LA, MS, AL, GA, SC, NC, VA, MD, DE, PA, RI, DC) Legend Aggregate Excess Agreement – This agreement has a one year term, effective 6/1/2007 to 5/31/2008 and a two year term effective 6/1/2007 to 5/31/2009. It covers the aggregation of qualifying losses for storms named or numbered by the National Weather Service, earthquakes and fires following earthquakes for Allstate Protection personal lines auto and property business countrywide except for Florida. The one year contract (6/1/2007 to 5/31/2008) has been 15% placed or $.3 billion of the $2.0 billion limit. The two year contract (6/1/2007 to 5/31/2009) has been 80% placed or $1.6 billion of the $2.0 billion limit leaving Allstate the option to place up to an additional 15% in year two. The preliminary reinsurance premium is subject to redetermination for exposure changes. Losses recoverable, if any, from our California fires following, multi-year, the New Jersey excess, South-East and Kentucky agreements are excluded when determining the retention of this agreement. California Fires Following Agreement – This agreement is effective 2/1/2006 and expires 5/31/2008. This agreement covers Allstate Protection personal property excess catastrophe losses in California for fires following earthquakes. This agreement provides $1.5 billion of coverage for all qualifying losses with one reinstatement except when a qualifying loss occurrence exceeds $2 billion, then for 21 days no additional recovery can occur for any losses within the same seismic geographically affected area. The retention on this agreement is subject to remeasurement. Multi-year Agreements – These agreements have been in effect since 6/1/2005 and cover the Allstate brand personal property excess catastrophe losses, expiring 5/31/2008. The retentions on these agreements are subject to annual remeasurements on their anniversary dates. Two separate reinsurance agreements provide coverage for catastrophe risks in the state of New York: Allstate Insurance Company (“AIC”) has a $512 retention and a $550 limit, and Allstate Indemnity Company (“AI”) has a $318 retention and a $450 limit. The Texas agreement is with Allstate Texas Lloyd’s (“ATL”), a syndicate insurance company. ATL also has a 100% reinsurance agreement with AIC covering losses in excess of and/or not reinsured by the Texas agreement. New Jersey Excess – This agreement is effective 6/1/2007 for 1 year and covers Allstate Protection personal property catastrophe losses in excess of the New Jersey multi-year agreement. South-East – This agreement is effective 6/1/2007 for 1 year and covers Allstate Protection personal property excess catastrophe losses for storms named or numbered by the National Weather Service. This agreement covers personal property business in the states of Louisiana, Mississippi, Alabama, Georgia, South Carolina, North Carolina, Virginia, Maryland, Delaware, Pennsylvania and Rhode Island and the District of Columbia. The preliminary reinsurance premium is subject to redetermination for exposure changes. Kentucky- This agreement is effective 6/1/2007 for 1 year and covers Allstate Protection personal property excess catastrophe losses for earthquakes and fires following earthquakes.
  • 6. Reinsurance Agreements Highlights of Certain Other Contract Terms and Conditions South-East Aggregate Excess Multi-year, New Jersey excess, California fires following and Kentucky Business Reinsured Personal Lines Personal Lines Personal Lines Property business Property and Auto business Property business Location (s) 11 states and Nationwide except Florida Each specific state Washington, DC Covered Losses 1 specific peril – 3 specific perils – storms named or Multi-year and New Jersey excess: multi-perils - storms named or numbered by the National Weather includes hurricanes and earthquakes numbered by the Service, earthquakes, and fires California fires following: 1 specific peril – fires National Weather following earthquakes following earthquakes Service Kentucky-earthquakes and fires following earthquakes. Brands Reinsured Allstate Brand Allstate Brand Multi-year: Allstate Brand Encompass Brand Encompass Brand New Jersey excess, California fires following, Kentucky: Allstate Brand and Encompass Brand Exclusions, other than Automobile Assessment exposure to Automobile typical market Terrorism California Earthquake Authority Terrorism negotiated exclusions Commercial Terrorism Commercial Commercial Loss Occurrence Sum of all qualifying Sum of all qualifying losses and Sum of all qualifying losses for a specific losses from named or sum of all qualifying occurrences occurrence over 168 hours numbered storms (Aggregate) by the Windstorm related occurrences over 96 hours National Weather Losses over 96 hours from a Service named or numbered storm Riot related occurrences over 72 hours over 96 hours Losses over 168 hours for an California fires following occurrences over 168 earthquake hours. No additional recovery can occur for any losses within the same seismic geographically Losses over 168 hours within a 336 affected area for an additional 336 hours when a hour period for fires following an qualifying loss exceeds $2 billion. Kentucky earthquake earthquake and fires following earthquake occurrences over 336 hours. Loss adjustment 10% of qualifying 10% of qualifying losses Multi-year and California fires expenses included losses following: actual expenses within ultimate net loss New Jersey excess and Kentucky: 10% of qualifying losses
  • 7. Illustration of Utilization of Reinsurance Coverage The following examples are provided to illustrate to investors Allstate’s reinsurance program and should not be relied upon to determine the amount of Allstate’s net loss from any actual events that may occur in the future. They are based on hypothetical situations. The actual amounts recoverable under our reinsurance program and the amount of our net loss from any one event or series of events could differ materially from the hypothetical results presented in these examples due to a variety of factors, including the nature and location of the specific losses incurred, the specific lines of business covered by the various reinsurance agreements, and the impact of potential litigation. (in millions) Amounts Recoverable by Reinsurance Agreement Allstate Floridian (c) New Jersey California Aggregate FHCF FHCF Excess of Excess of Additional Amount Notes South-East Multi-year Excess Fire Following Kentucky Excess Retention FHCF Sliver Loss Loss Sliver Excess of Loss Example 1 - One hurricane landfalls in North Carolina, total loss of $2.1 billion (Total loss of $2.1 billion, net loss of $1.6 billion or 77.4%) North Carolina hurricane South-East Loss 2,100.0 Retention 500.0 500 retention Subject Loss 1,600.0 Total loss less 500 retention Retained 25.0 5% retained on 500 xs 500 retention Recoverable (475.0) 95% of 500 xs 500 placed (a) (475.0) Retained 1,100.0 In excess of South-East Agreement retention and limit North Carolina loss 2,100.0 Less recoverables (475.0) (475.0) Net loss 1,625.0
  • 8. Illustration of Utilization of Reinsurance Coverage The following examples are provided to illustrate to investors Allstate’s reinsurance program and should not be relied upon to determine the amount of Allstate’s net loss from any actual events that may occur in the future. They are based on hypothetical situations. The actual amounts recoverable under our reinsurance program and the amount of our net loss from any one event or series of events could differ materially from the hypothetical results presented in these examples due to a variety of factors, including the nature and location of the specific losses incurred, the specific lines of business covered by the various reinsurance agreements, and the impact of potential litigation. (in millions) Amounts Recoverable by Reinsurance Agreement Allstate Floridian (c) New Jersey California Aggregate FHCF FHCF Excess of Excess of Additional Amount Notes South-East Multi-year Excess Fire Following Kentucky Excess Retention FHCF Sliver Loss Loss Sliver Excess of Loss Example 2 - First hurricane landfalls in North Carolina, total loss of $1.05 billion; second hurricane landfalls in Louisiana, total loss of $1.4 billion (Total loss of $2.45 billion, net loss of $1.5 billion or 61.2%) Hurricane in North Carolina South-East Loss 1,050.0 Retention 500.0 500 retention Subject Loss 550.0 Total loss less 500 retention Retained 25.0 5% retained on 500 xs 500 retention Recoverable (475.0) 95% of 500 xs 500 placed (a) (475.0) Retained 50.0 In excess of South-East Agreement retention and limit North Carolina loss 1,050.0 Less recoverables (475.0) Net loss 575.0 Hurricane in Louisiana South-East Loss 1,400.0 Retention 500.0 500 retention Subject Loss 900.0 Total loss less 500 retention Retained 25.0 5% retained on 500 xs 500 retention 45% of 95% of 500 xs 500 retention, limit reinstated Recoverable (475.0) (475.0) Retained 400.0 In excess of South-East Agreement retention and limit as reinstated Louisiana loss 1,400.0 Less recoverables (475.0) Net loss 925.0 Total losses 2,450.0 Less recoverables (950.0) Net loss 1,500.0 (950.0)
  • 9. Illustration of Utilization of Reinsurance Coverage The following examples are provided to illustrate to investors Allstate’s reinsurance program and should not be relied upon to determine the amount of Allstate’s net loss from any actual events that may occur in the future. They are based on hypothetical situations. The actual amounts recoverable under our reinsurance program and the amount of our net loss from any one event or series of events could differ materially from the hypothetical results presented in these examples due to a variety of factors, including the nature and location of the specific losses incurred, the specific lines of business covered by the various reinsurance agreements, and the impact of potential litigation. (in millions) Amounts Recoverable by Reinsurance Agreement Allstate Floridian (c) New Jersey California Aggregate FHCF FHCF Excess of Excess of Additional Amount Notes South-East Multi-year Excess Fire Following Kentucky Excess Retention FHCF Sliver Loss Loss Sliver Excess of Loss Example 3 - First hurricane landfalls in Alabama, total loss of $350 million; second hurricane landfalls in Georgia, total loss of $900 million; third hurricane landfalls in North Carolina and South Carolina, total loss of $750 (Total loss of $2 billion, net loss of $1.4 billion or 69.1%) Hurricane in Alabama South-East Loss 350.0 Retention 500.0 500 retention Recoverable 0.0 Retention exceeds total loss Alabama loss 350.0 Less recoverable 0.0 Net loss 350.0 Hurricane in Georgia South-East Loss 900.0 Retention 500.0 500 retention Subject Loss 400.0 Total loss less 500 retention Retained 20.0 5% retained on 400 xs 500 retention Recoverable (380.0) 95% of 400 loss xs 500 retention (a) (380.0) Georgia loss 900.0 Less recoverables (380.0) Net loss 520.0 Hurricane in North Carolina and South Carolina South-East Loss 750.0 Retention 500.0 500 retention Subject Loss 250.0 Total loss less 500 retention Retained 12.5 5% retained on 250 xs 500 retention 95% of 250 loss xs 500 retention, limit reinstated (a) Recoverable (237.5) (237.5) NC and SC loss 750.0 Less recoverables (237.5) Net loss 512.5 Total loss 2,000.0 Less recoverables (617.5) (617.5) Net loss 1,382.5
  • 10. Illustration of Utilization of Reinsurance Coverage The following examples are provided to illustrate to investors Allstate’s reinsurance program and should not be relied upon to determine the amount of Allstate’s net loss from any actual events that may occur in the future. They are based on hypothetical situations. The actual amounts recoverable under our reinsurance program and the amount of our net loss from any one event or series of events could differ materially from the hypothetical results presented in these examples due to a variety of factors, including the nature and location of the specific losses incurred, the specific lines of business covered by the various reinsurance agreements, and the impact of potential litigation. (in millions) Amounts Recoverable by Reinsurance Agreement Allstate Floridian (c) New Jersey California Aggregate FHCF FHCF Excess of Excess of Additional Amount Notes South-East Multi-year Excess Fire Following Kentucky Excess Retention FHCF Sliver Loss Loss Sliver Excess of Loss Example 4 - First hurricane landfalls in Maryland, total loss $600 million; second hurricane landfalls in New Jersey, total loss of $700 million; third hurricane landfalls in Maine, total loss of $200 million; fire losses reported in California following an earthquake, total loss of $1.7 billion. (Total loss of $3.2 billion, net loss of $1.5 billion or 46.6%) Hurricane in Maryland South-East Loss 600.0 Retention 500.0 500 retention Subject loss 100.0 Total loss less 500 retention Retained 5.0 5% retained on 100 xs 500 retention Recoverable (95.0) 95% of 100 loss xs 500 retention (a) (95.0) Maryland loss 600.0 Less recoverables (95.0) Net loss 505.0 Hurricane in New Jersey Multi-Year Loss 700.0 Retention 140.0 140 retention Subject Loss 560.0 Total loss less 140 retention Retained 15.0 5% retained on 300 limit xs 140 retention Recoverable (285.0) 95% placed on 300 limit xs 140 retention (b) (285.0) New Jersey Excess Retained 10.0 5% retained on 200 limit xs 440 retention Recoverable (190.0) 95% placed on 200 limit xs 440 retention (b) (190.0) Retained 60.0 In excess of New Jersey Excess retention and limit New Jersey loss 700.0 Less recoverables (475.0) Net loss 225.0 Hurricane in Maine Loss 200.0 Retained 200.0 No state specific reinsurance Maine loss 200.0 Less recoverable 0.0 Net loss 200.0
  • 11. Illustration of Utilization of Reinsurance Coverage The following examples are provided to illustrate to investors Allstate’s reinsurance program and should not be relied upon to determine the amount of Allstate’s net loss from any actual events that may occur in the future. They are based on hypothetical situations. The actual amounts recoverable under our reinsurance program and the amount of our net loss from any one event or series of events could differ materially from the hypothetical results presented in these examples due to a variety of factors, including the nature and location of the specific losses incurred, the specific lines of business covered by the various reinsurance agreements, and the impact of potential litigation. (in millions) Amounts Recoverable by Reinsurance Agreement Allstate Floridian (c) New Jersey California Aggregate FHCF FHCF Excess of Excess of Additional Amount Notes South-East Multi-year Excess Fire Following Kentucky Excess Retention FHCF Sliver Loss Loss Sliver Excess of Loss Example 4 - continuation Fire losses in California following an earthquake CA Fire Following Loss 1,700.0 Retention 500.0 500 retention Subject loss 1,200.0 Total loss less 500 retention Retained 60.0 5% retained on 1,200 xs 500 retention Recoverable (1,140.0) 95% placed on 1,200 xs 500 retention (1140.0) CA loss 1,700.0 Less recoverable (1,140.0) Net loss 560.0 Total loss 3,200.0 Less recoverables (1,710.0) (95.0) (285.0) (190.0) (1140.0) Net loss 1,490.0
  • 12. Illustration of Utilization of Reinsurance Coverage The following examples are provided to illustrate to investors Allstate’s reinsurance program and should not be relied upon to determine the amount of Allstate’s net loss from any actual events that may occur in the future. They are based on hypothetical situations. The actual amounts recoverable under our reinsurance program and the amount of our net loss from any one event or series of events could differ materially from the hypothetical results presented in these examples due to a variety of factors, including the nature and location of the specific losses incurred, the specific lines of business covered by the various reinsurance agreements, and the impact of potential litigation. (in millions) Amounts Recoverable by Reinsurance Agreement Allstate Floridian (c) New Jersey California Aggregate FHCF FHCF Excess of Excess of Additional Amount Notes South-East Multi-year Excess Fire Following Kentucky Excess Retention FHCF Sliver Loss Loss Sliver Excess of Loss Example 5 - First hurricane landfalls in Louisiana, total loss of $3.6 billion; second hurricane landfalls in Texas, total loss of $1 billion; third hurricane landfalls in Florida, total loss of $900 million ($600 million net of Universal and Royal Palm) (Total loss of $5.2 billion, net loss of $2.17 billion or 41.7%) Hurricane in Louisiana South-East Loss 3,600.0 Retained 500.0 500 retention Subject Loss 3,100.0 Total loss less 500 retention Retained 25.0 5% retained on 500 xs 500 retention Recoverable (475.0) 95% of 500 xs 500 placed (a) (475.0) Retained 2,600.0 In excess of South-East Agreement retention and limit Louisiana loss 3,600.0 Less recoverables (475.0) Net loss 3,125.0 Aggregate Excess Subject Loss 3,125.0 Retention 2,000.0 2,000 retention Subject Loss 1,125.0 Total loss less 2,000 retention Retained 56.2 5% retained on 1,125 xs 2,000 retention Recoverable (1,068.8) 95% placed on 1,125 xs 2,000 retention (1068.8) Aggregate excess recoverable (1,068.8) Hurricane in Texas Multi-Year Loss 1,000.0 Retention 399.0 399 retention Subject Loss 601.0 Total loss less 361 retention Retained 30.0 5% retained on 601 loss xs 399 retention Recoverable (571.0) 95% placed on 601 loss xs 399 retention (571.0) Texas loss 1,000.0 Less recoverable (571.0) Net loss 429.0 Aggregate Excess Retention for multi-year agreement (399 + 30 = 429) Subject Loss 429.0 Retained 21.4 5% retained on 429 loss (limit remaining: 1900 placed less 1068.8 = 831.2) Recoverable (407.6) 95% placed on 429 loss (407.6) Aggregate Excess Recoverable (407.6)
  • 13. Illustration of Utilization of Reinsurance Coverage The following examples are provided to illustrate to investors Allstate’s reinsurance program and should not be relied upon to determine the amount of Allstate’s net loss from any actual events that may occur in the future. They are based on hypothetical situations. The actual amounts recoverable under our reinsurance program and the amount of our net loss from any one event or series of events could differ materially from the hypothetical results presented in these examples due to a variety of factors, including the nature and location of the specific losses incurred, the specific lines of business covered by the various reinsurance agreements, and the impact of potential litigation. (in millions) Amounts Recoverable by Reinsurance Agreement Allstate Floridian (c) New Jersey California Aggregate FHCF FHCF Excess of Excess of Additional Amount Notes South-East Multi-year Excess Fire Following Kentucky Excess Retention FHCF Sliver Loss Loss Sliver Excess of Loss Example 5- continuation Hurricane in Florida (d) FHCF Retention Loss 900.0 Less Ceded 300.0 Total loss less 300 ceded to Royal Palm and Universal Net loss 600.0 Royal Palm and Universal exposure excluded Retention 50.0 50 retention Subject Loss 550.0 Net loss less 50 retention Retained 30.0 30% retained on 100 xs 50 retention Recoverable (70.0) 70% placed on 100 xs 50 retention (70.0) FHCF Loss 900.0 Retention 243.1 243.1 provisional retention for the FHCF Subject Loss 656.9 Total retention 65.7 10% retained on 656.9 xs 243.1 retention Total recoverable (591.2) 90% placed on 656.9 xs 243.1, inclusive of Royal Palm and Universal (591.2) FHCF Sliver Net loss 600.0 Royal Palm and Universal exposure excluded Retention 150.6 150.6 retention Subject Loss 449.4 Net loss less 150.6 retention Recoverable (44.9) 10% placed on 449.4 xs of 150.6 limit up to reinsured limit of 47.6 (44.9) Quota Share Recoveries Ceded to Royal Palm and Universal Ceded loss (300.0) Recovery due Royal Palm and Universal (33.33% of FHCF recovery of 591.2) FHCF cession 197.1 197.1 Net recoverable (102.9) Florida loss 900.0 Less ceded 300.0 Ceded to Royal Palm and Universal Net loss 600.0 Total recoverables (706.2) Less ceded Ceded to Royal Palm and Universal recoverable 197.1 Net recoverables (509.1) Florida loss 90.9 Total loss 5,200.0 Less net recoverables (3,031.5) (475.0) (571.0) (1476.4) (70.0) (394.1) (44.9) Net loss 2,168.5 (a) Reinsurance premium will be payable to the extent that the reinsurance limit can be reinstated up to a total of $500 million for all qualifying occurrences. The contract allows one per occurrence reinstatement limit. The amount of reinstatement premium due is equal to the amount of limit reinstated multiplied by the reinsurance premium rate on line and the amount of reinsurance limit placed or 95%. (b) Reinsurance premiums will be payable to the extent that the reinsurance limit(s) can be reinstated up to a total of $300 million for the New Jersey multi-year and $200 million for the New Jersey excess for all qualifying occurrences. The amount of premium payable is determined pursuant to the same formula as noted in Note (a) above for the South-East agreement. (c) Reinsurance coverage for Allstate Floridian will be placed later this year and should become effective June 1, 2007. In order to complete this example, we have assumed that Allstate Floridian's 2006 reinsurance coverage is effective as of June 1, 2007, including its existing quota share reinsurance agreements with Universal Insurance Company and Royal Palm Insurance Company. (d) For purposes of this example, the limit of liability and retention applicable to the FHCF have been combined for all Floridian companies