1. The Walt Disney Company and Subsidiaries
M A N A G E M E N T ’ S D I S C U S S I O N A N D A N A LY S I S O F
F I N A N C I A L C O N D I T I O N A N D R E S U L T S O F O P E R AT I O N S
C O N S O L I DATE D R E S ULT S
A s - Rep o r t e d Results of O p e rat i o n s
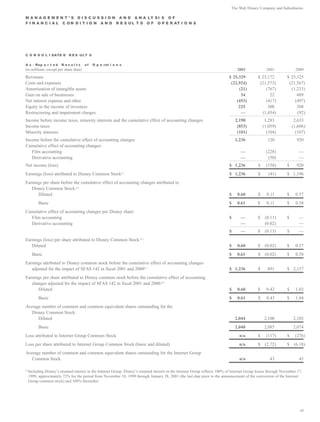
(in millions, except per share data) 2002 2001 2000
Revenues $ 25,329 $ 25,172 $ 25,325
Costs and expenses (22,924) (21,573) (21,567)
Amortization of intangible assets (21) (767) (1,233)
Gain on sale of businesses 34 22 489
Net interest expense and other (453) (417) (497)
Equity in the income of investees 225 300 208
Restructuring and impairment charges — (1,454) (92)
Income before income taxes, minority interests and the cumulative effect of accounting changes 2,190 1,283 2,633
Income taxes (853) (1,059) (1,606)
Minority interests (101) (104) (107)
Income before the cumulative effect of accounting changes 1,236 120 920
Cumulative effect of accounting changes:
Film accounting — (228) —
Derivative accounting — (50) —
Net income (loss) $ 1,236 $ (158) $ 920
Earnings (loss) attributed to Disney Common Stock $ 1,236 $ (41) $ 1,196
(1)
Earnings per share before the cumulative effect of accounting changes attributed to
Disney Common Stock:(1)
Diluted $ 0.60 $ 0.11 $ 0.57
Basic $ 0.61 $ 0.11 $ 0.58
Cumulative effect of accounting changes per Disney share:
Film accounting $ — $ (0.11) $ —
Derivative accounting — (0.02) —
$ — $ (0.13) $ —
Earnings (loss) per share attributed to Disney Common Stock: (1)
Diluted $ 0.60 $ (0.02) $ 0.57
Basic $ 0.61 $ (0.02) $ 0.58
Earnings attributed to Disney common stock before the cumulative effect of accounting changes
adjusted for the impact of SFAS 142 in fiscal 2001 and 2000(1) $ 1,236 $ 891 $ 2,157
Earnings per share attributed to Disney common stock before the cumulative effect of accounting
changes adjusted for the impact of SFAS 142 in fiscal 2001 and 2000:(1)
Diluted $ 0.60 $ 0.42 $ 1.03
Basic $ 0.61 $ 0.43 $ 1.04
Average number of common and common equivalent shares outstanding for the
Disney Common Stock:
Diluted 2,044 2,100 2,103
Basic 2,040 2,085 2,074
Loss attributed to Internet Group Common Stock n/a $ (117) $ (276)
Loss per share attributed to Internet Group Common Stock (basic and diluted) n/a $ (2.72) $ (6.18)
Average number of common and common equivalent shares outstanding for the Internet Group
Common Stock n/a 43 45
Including Disney’s retained interest in the Internet Group. Disney’s retained interest in the Internet Group reflects 100% of Internet Group losses through November 17,
(1)
1999, approximately 72% for the period from November 18, 1999 through January 28, 2001 (the last date prior to the announcement of the conversion of the Internet
Group common stock) and 100% thereafter.
49
2. C O N S O L I DATE D R E S U L T S from the cumulative effect of accounting changes ($278 million or
2002 vs. 2001 Net income for the year was $1.2 billion, compared $0.13 per Disney share) and restructuring and impairment charges
to a net loss of $158 million in the prior-year period. Net income and ($1.5 billion or $0.52 per Disney share). As-reported results also
earnings per share attributed to Disney common stock were $1.2 bil- include pre-tax gains on the sale of Infoseek Japan K.K. ($22 mil-
lion and $0.60, respectively, for the current year, compared to a net lion) in fiscal 2001, and Fairchild Publications ($243 million),
loss and loss per share of $41 million and $0.02 in the prior year. Ultraseek Corporation ($153 million) and Eurosport ($93 million)
Results for the current year include a pre-tax gain ($216 million or in fiscal 2000.
$0.07 per share) on the sale of the remaining shares of Knight- Excluding the charges and gains mentioned above, earnings per
Ridder, Inc., a pre-tax gain on the sale of the Disney Store business share attributed to Disney common stock was $0.63 and $0.56 for
in Japan ($34 million or $0.01 per share), operations of ABC Family fiscal 2001 and 2000, respectively. Results for fiscal 2001 also
acquired on October 24, 2001, incremental interest expense for bor- reflected lower amortization of intangible assets and net interest
rowings related to that acquisition and the cessation of amortization expense and other, and higher equity in the income of investees, par-
of goodwill and certain intangible assets, due to the adoption of tially offset by decreased segment operating income and higher cor-
Statement of Financial Standards No. 142, Goodwill and Other porate and unallocated shared expenses. Lower amortization of
Intangible Assets (SFAS 142) effective October 1, 2001. The prior intangible assets reflected the write-off of intangible assets associated
year included restructuring and impairment charges ($1.5 billion or with the closure of the GO.com portal business in the second quarter
$0.52 per share) and the cumulative effect of accounting changes of fiscal 2001, certain intangible assets becoming fully amortized in
($278 million or $0.13 per share). Earnings and earnings per share the first quarter of fiscal 2001 and a reduction in intangible assets
attributed to Disney common stock before the cumulative effect of related to the sale of Fairchild Publications, Ultraseek and Eurosport
accounting changes adjusted for the impact of SFAS 142 for the in fiscal 2000. Decreases in net interest expense and other were due
prior-year were $891 million and $0.42, respectively. to lower interest rates and lower average debt balances throughout
Excluding the year-over-year impact of the non-recurring items most of fiscal 2001, partially offset by increased investment income
discussed above, results for the year were driven by lower segment due to gains on the sale of certain investments. Higher equity in the
operating income and equity in income of investees and higher net income of investees reflected improved results from cable equity
interest expense and other. Decreased segment operating income investments including Lifetime Television, The History Channel and
reflected lower Media Networks and Parks and Resorts results, par- A&E Television and certain international cable equity investments,
tially offset by higher Studio Entertainment results. Lower equity in partially offset by start-up losses incurred in connection with new
the income of investees reflected the write-down of an investment in investments. Decreased segment operating income reflected lower
a Latin American cable operator, decreases at the cable investments Media Networks and Parks and Resorts results, partially offset by
resulting from the soft advertising market and higher advertising improvements at Studio Entertainment and Consumer Products.
costs at Lifetime Television. Increased corporate and unallocated shared expenses were driven by
Net interest expense and other is detailed below: costs associated with several strategic initiatives designed to improve
overall company-wide efficiency and promote the Disney brand.
Year Ended September 30,
The effective tax rate increased from 61.0% in fiscal 2000 to
2002 2001 2000 82.5% in fiscal 2001 primarily due to nondeductible impairment
charges related to intangible assets taken in fiscal 2001.
Interest expense $(723) $(544) $(599)
Interest income 23 26 22
R E S T RUCTURING AND IMPAIRM ENT CHARG E S
Investment income 247 101 80
The Company recorded restructuring and impairment charges for the
Net interest expense and other $(453) $(417) $(497)
years ended September 30, 2001 and 2000 summarized as follows:
(in millions) 2001 2000
Interest expense increased to $723 million due to incremental
borrowings in connection with the ABC Family acquisition. Higher GO.com intangible assets impairment $ 820 $—
interest expense was partially offset by increased investment income GO.com severance, fixed asset write-offs
due to the gain on the sale of Knight-Ridder shares. and other 58 —
The effective tax rate decreased from 82.5% in fiscal 2001 to Investment impairments 254 61
38.9% in fiscal 2002 due to nondeductible impairment charges Workforce reduction and other 111 —
related to intangible assets taken in fiscal 2001, and the cessation Chicago DisneyQuest closure 94 —
of nondeductible amortization of goodwill in fiscal 2002. Asset impairment 63 31
Disney Store closures 54 —
2001 vs. 2000 As-reported net loss was $158 million compared to
Total restructuring and impairment charges $1,454 $92
net income of $920 million in fiscal 2000. Net loss and loss per share
attributed to Disney common stock were $41 million and $0.02,
respectively, compared to net income and earnings per share attrib-
uted to Disney common stock of $1.2 billion and $0.57, respectively,
in the prior year. As-reported net loss in fiscal 2001 includes charges
50
3. The Walt Disney Company and Subsidiaries
The $111 million of costs associated with the workforce reduction consist primarily of severance costs and write-offs of idled facilities. As of
September 30, 2002, the Company had substantially completed its workforce reduction.
P RO FOR MA R ES U L T S OF OPERAT I O N
The Company acquired Fox Family Worldwide, Inc., subsequently re-named ABC Family Worldwide (ABC Family) on October 24, 2001. The
acquisition resulted in a $5.2 billion increase in borrowings, consisting of outstanding debt of ABC Family and new short-and long-term debt
issuances. Pro forma net interest and other has been adjusted as if these incremental borrowings had been outstanding as of the beginning of fiscal
2001. In March 2001, the Company closed the GO.com portal business and converted its Internet Group common stock into Disney common stock.
Additionally, on October 1, 2001, the Company adopted SFAS 142, and accordingly no longer amortizes substantially all of its intangible assets. To
enhance comparability, the unaudited pro forma information that follows presents consolidated results of operations as if the ABC Family acquisition,
the conversion of the Internet Group common stock, the closure of the GO.com portal business and the adoption of SFAS 142 (see Notes 3 and 6 to
the Consolidated Financial Statements) had occurred at the beginning of fiscal 2001. The unaudited pro forma information is not necessarily reflec-
tive of the results of operations had these events actually occurred at the beginning of fiscal 2001, nor is it necessarily indicative of future results.
Management believes that pro forma operating results provide additional information useful in analyzing the underlying business results.
However, pro forma operating results should be considered in addition to, not as a substitute for, as-reported results of operations.
C O N S O L I DATE D R ES ULT S
P r o Fo r m a Results of O p e rat i o n s
(unaudited; in millions, except per share data) 2001 % Change
2002
Revenues $ 25,360 $ 25,790 (2%)
Costs and expenses (22,951) (21,982) (4%)
Amortization of intangible assets (21) (23) 9%
Gain on sale of business (1) 34 22 55%
Net interest expense and other (465) (637) 27%
Equity in the income of investees 225 310 (27%)
Restructuring and impairment charges — (576) n/m
Income before income taxes, minority interests and the cumulative effect of accounting changes 2,182 2,904 (25%)
Income taxes (850) (1,128) 25%
Minority interests (101) (103) 2%
Income before the cumulative effect of accounting changes 1,231 1,673 (26%)
Cumulative effect of accounting changes:
Film accounting — (280) n/m
Derivative accounting — (50) n/m
Net income $ 1,231 $ 1,343 (8%)
Earnings per share before the cumulative effect of accounting changes (basic and diluted): $ 0.60 $ 0.80 (25%)
(2)
Earnings before the cumulative effect of accounting changes, excluding investment gain in
fiscal 2002, restructuring and impairment charges and gain on the sale of businesses $ 1,074 $ 2,041 (47%)
Earnings per share before the cumulative effect of accounting changes, excluding investment
gain in fiscal 2002, restructuring and impairment charges and gain on the sale of businesses:
Diluted $ 0.53 $ 0.97 (45%)
Basic $ 0.53 $ 0.98 (46%)
Average number of common and common equivalent shares outstanding:
Diluted 2,044 2,104
Basic 2,040 2,089
Includes the gain on sale of the Company’s Disney Store operations in Japan in 2002 and the gain on sale of Infoseek Japan K.K. in 2001.
(1)
The per share impacts of film and derivative accounting changes for the year were $(0.13) and $(0.02), respectively.
(2)
51
4. The following table provides a reconciliation of as-reported
diluted earnings per share attributed to Disney common stock to pro
forma earnings per share before the cumulative effect of accounting
changes, excluding investment gain in fiscal 2002 and restructuring
and impairment charges and gains on sale of business.
Year Ended
September 30,
(unaudited) 2002 2001
As-reported diluted earnings (loss) per share
attributed to Disney common stock $ 0.60 $(0.02)
Adjustment to exclude the cumulative effect
of accounting changes — 0.13
Adjustment to reflect the impact of the new
SFAS 142 accounting rules — 0.31
As-reported diluted earnings per share
attributed to Disney common stock before
the cumulative effect of accounting changes
adjusted for the impact of SFAS 142 in
fiscal 2001 0.60 0.42
Adjustment to attribute 100% of Internet Group
operating results to Disney common stock
(72% included in as-reported amounts) — (0.06)
Adjustment to exclude GO.com restructuring
and impairment charges — 0.41
Adjustment to exclude pre-closure GO.com
portal operating results — 0.04
Adjustment to include ABC Family operations — (0.01)
Pro forma diluted earnings per share before
the cumulative effect of accounting changes 0.60 0.80
Adjustment to exclude restructuring and
impairment charges — 0.17
Adjustment to exclude gain on sale
of business (0.01) —
Adjustment to exclude fiscal 2002
investment gain (0.07) —
Pro forma diluted earnings per share before
the cumulative effect of accounting changes,
excluding investment gain in fiscal 2002
and restructuring and impairment charges
and gain on sale of business $ 0.53 $ 0.97
The impact of gain on sale of business on fiscal 2001 and
the 2002 pro forma impact of ABC Family each had less than
$0.01 impact.
Earnings per share amounts for fiscal 2002 do not add due to
rounding.
52
5. The Walt Disney Company and Subsidiaries
BUSI NESS SEGMENT RESULT S
Pro Forma
As Reported (unaudited) %
(in millions) 2002 2001 2000 2002 2001 Change
Revenues:
Media Networks $ 9,733 $ 9,569 $ 9,836 $ 9,763 $10,157 (4%)
Parks and Resorts 6,465 7,004 6,809 6,465 7,004 (8%)
Studio Entertainment 6,691 6,009 5,918 6,691 6,009 11%
Consumer Products 2,440 2,590 2,762 2,441 2,620 (7%)
$25,329 $25,172 $25,325 $25,360 $25,790 (2%)
Segment operating income:
Media Networks $ 986 $ 1,758 $ 1,985 $ 990 $ 1,949 (49%)
Parks and Resorts 1,169 1,586 1,615 1,169 1,586 (26%)
Studio Entertainment 273 260 126 273 260 5%
Consumer Products 394 401 386 394 419 (6%)
$ 2,822 $ 4,005 $ 4,112 $ 2,826 $ 4,214 (33%)
The Company evaluates the performance of its operating segments based on segment operating income. The following table reconciles segment
operating income to income before income taxes, minority interests and the cumulative effect of accounting changes.
Pro Forma
As Reported (unaudited)
(in millions) 2002 2001 2000 2002 2001
Segment operating income $2,822 $ 4,005 $ 4,112 $2,826 $4,214
Corporate and unallocated shared expenses (417) (406) (354) (417) (406)
Amortization of intangible assets (21) (767) (1,233) (21) (23)
Gain on sale of businesses 34 22 489 34 22
Net interest expense and other (453) (417) (497) (465) (637)
Equity in the income of investees 225 300 208 225 310
Restructuring and impairment charges — (1,454) (92) — (576)
Income before income taxes, minority interests and the cumulative effect
of accounting changes $2,190 $ 1,283 $ 2,633 $2,182 $2,904
Segment earnings before interest, income taxes, depreciation and amortization (EBITDA) is as follows:
Pro Forma
As Reported (unaudited)
(in millions) 2002 2001 2000 2002 2001
Media Networks $1,166 $1,934 $2,154 $1,171 $2,134
Parks and Resorts 1,817 2,190 2,197 1,817 2,190
Studio Entertainment 319 307 180 319 307
Consumer Products 452 491 495 452 509
$3,754 $4,922 $5,026 $3,759 $5,140
Management believes that segment EBITDAprovides additional information useful in analyzing the underlying business results. However, seg-
ment EBITDAis a non-GAAPfinancial metric and should be considered in addition to, not as a substitute for, reported segment operating income.
53
6. M e d i a N e two r k s contracts on the Company’s results over the remaining term of the
The following table provides supplemental revenue and segment contracts is dependent upon a number of factors, including the
operating income detail for the Media Networks segment. strength of advertising markets, effectiveness of marketing efforts
and the size of viewer audiences.
Pro Forma As
The costs of these contracts are charged to expense based on the
(unaudited) Reported
ratio of each period’s gross revenues to estimated total gross reve-
(in millions) 2002 2001 2000
nues over the remaining contract period. The Company’s contract to
Revenues: broadcast the NFLis for an eight year term commencing with the
Broadcasting $5,064 $ 5,945 $6,327 1998 season. The initial five year period is non-cancelable with the
Cable Networks 4,699 4,212 3,509 remaining three years renewable at the option of the NFL.
Programming rights costs for the initial five year period have been
$9,763 $10,157 $9,836
charged to expense based upon the ratio of current period’s gross rev-
enues to estimated total revenues for this period of time. Estimates of
Segment Operating Income: total gross revenues can change significantly and, accordingly, they
Broadcasting $ (36) $ 783 $ 970 are reviewed periodically and amortization and carrying amounts are
Cable Networks 1,026 1,166 1,015 adjusted, if necessary. Such adjustments could have a material effect
$ 990 $ 1,949 $1,985 on results of operations in future periods.
The Company has investments in cable operations that are
accounted for as unconsolidated equity investments. The table
2002 vs. 2001 On a pro forma basis, revenues decreased 4%, or
below presents operating income from cable television activities,
$394 million, to $9.8 billion, reflecting a decrease of 15%, or $881
which comprise the Cable Networks and the Company’s cable
million, at Broadcasting, partially offset by an increase of 12%, or
equity investments.
$487 million, at the Cable Networks. The decrease at Broadcasting
was driven by declines at the ABC television network and the Pro Forma (unaudited)
Company’s owned television stations due to lower ratings and lower (in millions) 2002 2001 % Change
advertising rates. Additionally, the prior year included revenues from
Operating Income:
a non-recurring sale of a film library at ABC Family. Increases at the
Cable Networks $1,026 $1,166 (12%)
Cable Networks were driven by higher affiliate revenues reflecting
Equity Investments:
higher rates at ESPN and subscriber growth at both ESPN and the
A&E Television and
International Disney Channels, partially offset by lower advertising
Lifetime Television 598 698 (14%)
revenues due to the soft advertising market and lower revenues from
Other 140 191 (27%)
Adelphia Communications Company (Adelphia) in the United States
Operating Income from Cable
and KirchMedia & Company (Kirch) in Germany as a result of their
Television Activities 1,764 2,055 (14%)
financial difficulties.
Partner Share of Operating Income (618) (712) 13%
On a pro forma basis, segment operating income decreased 49%,
or $959 million, to $1.0 billion, driven by decreases of $819 million Disney Share of Operating Income $1,146 $1,343 (15%)
at Broadcasting, primarily due to decreased revenues. Cable operat-
ing income decreased 12%, or $140 million, as revenue gains were Note: Operating income from cable television activities presented in this
more than offset by cost increases. Costs and expenses increased 7%, table represents 100% of both the Company’s owned cable businesses and its
or $565 million, driven by higher sports programming costs at ESPN, cable equity investees. The Disney share of operating income represents the
Company’s ownership interest in cable television operating income. Cable
principally for NFLbroadcasts, and increased advertising costs at the
Networks are reported in “Segment operating income” in the statements of
Cable Networks, partially offset by lower costs at the Internet Group
income. Equity investments are reported in “Equity in the income of investees”
and proceeds from an insurance settlement. in the statements of income.
As-reported revenues increased 2%, or $164 million, to $9.7
billion and segment operating income decreased 44% to $1.0 bil- We believe that operating income from cable television activities
lion. As-reported amounts include a partial period of ABC Family provides additional information useful in analyzing the underlying
operations in the current period and losses associated with the business results. However, operating income from cable television
GO.com portal (which was closed on January 29, 2001) in the activities is a non-GAAPfinancial metric and should be considered
prior-year period. in addition to, not as a substitute for, segment operating income.
The Company has various contractual commitments for the pur- The Company’s share of cable television operating income
chase of broadcast rights for sports and other programming, including decreased 15%, or $197 million, to $1.1 billion. The decrease was
the National Football League (NFL), National Basketball Association driven by lower revenues due to the weak advertising market at both
(NBA), Major League Baseball (MLB), National Hockey League ESPN and the cable equity affiliates, higher sports programming
(NHL) and various college football conference and bowl games. The costs at ESPN and higher advertising expense at the cable equity
costs of these contracts have increased significantly in recent years. affiliates, partially offset by higher affiliate revenues at ESPN.
We have implemented a variety of strategies, including marketing Additionally, the current period reflects the write-down of an invest-
efforts, to reduce the impact of the higher costs. The impact of these ment in a Latin American cable operator.
54
7. The Walt Disney Company and Subsidiaries
2001 vs. 2000 On an as-reported basis, revenues decreased 3%, or or $122 million, driven primarily by volume decreases, reduced mar-
$267 million, to $9.6 billion, driven by decreases of $601 million at keting expenses and permanent cost reduction initiatives across all
Broadcasting, partially offset by increases of $334 million at the segment businesses and the absence of pre-opening costs for Disney’s
Cable Networks. The decrease at Broadcasting was driven by lower California Adventure. These cost decreases were partially offset by
ratings and the soft advertising market at the ABC television network higher employee benefit and insurance costs.
and the Company’s owned television stations and radio operations.
Additionally, revenue declines at the television network reflected 2001 vs. 2000 Revenues increased 3%, or $195 million, to $7.0 bil-
lower sports advertising revenues due to ABC airing the Super Bowl lion, driven primarily by growth of $278 million at the Disneyland
in fiscal 2000. The increase at the Cable Networks was driven by Resort, $44 million from Disney Cruise Line and $20 million in
annual contractual rate adjustments at ESPN combined with sub- higher royalties from Tokyo Disneyland, partially offset by a decrease
scriber growth at ESPN, the Disney Channel domestically and inter- of $187 million at the Walt Disney World Resort. At the Disneyland
nationally, partially offset by the soft advertising market during fiscal Resort, the opening of Disney’s California Adventure, Downtown
2001. Subscriber growth at the Disney Channel reflected increasing Disney and Disney’s Grand Californian Hotel during the second
satellite (DBS) and digital subscribers and the continuing conversion quarter of fiscal 2001 drove increased attendance, higher occupied
of the Disney Channel from a premium to a basic service. room nights and increased guest spending. At the Walt Disney World
Segment operating income decreased 11%, or $227 million, to Resort, decreased revenues were driven by decreased attendance and
$1.8 billion, driven by a decrease of $275 million at Broadcasting lower occupied room nights reflecting fiscal 2000 success of the
resulting primarily from decreased revenues and higher programming Millennium Celebration, partially offset by increased guest spending
costs, partially offset by an increase of $48 million at the Cable and increased revenues at Disney Cruise Line reflecting the strength
Networks, driven by revenue growth. Costs and expenses decreased of the 7-day cruise package that was introduced in the fourth quarter
1%, or $40 million for fiscal 2001, but increased as a percentage of of fiscal 2000. Both the Disneyland Resort and Walt Disney World
revenue. The Company experienced higher programming costs at Resort were impacted by park closures on September 11th and from
ESPN, the primetime ABC television network and the Company’s lower attendance and hotel occupancy due to cancellations and
owned television stations and radio operations and start-up costs at reduced travel during the last three weeks of September 2001.
the international Disney Channels, offset by lower sports program- Segment operating income decreased 2%, or $29 million, to $1.6
ming costs at the ABC television network due to higher costs for the billion, driven by increased costs at the Disneyland Resort, partially
Super Bowl and two additional National Football League (NFL) reg- offset by revenue growth at Disneyland, continued growth at Disney
ular season games in fiscal 2000 and lower costs at the Internet Cruise Line and ongoing productivity improvements and cost reduc-
Group due to the closure of toysmart.com in fiscal 2000 and cost tion initiatives at Walt Disney World. Costs and expenses increased
saving initiatives. 4% or $224 million. Higher costs at the Disneyland Resort were due
to the opening of Disney’s California Adventure, Downtown Disney
Pa rks and Re s o rt s and Disney’s Grand Californian Hotel.
2002 vs. 2001 Revenues decreased 8%, or $539 million, to $6.5
St u d i o Ent er t a i n m e n t
billion, driven primarily by decreases of $496 million at the Walt
Disney World Resort, $40 million at the Disneyland Resort and $24 2002 vs. 2001 Revenues increased 11%, or $682 million, to $6.7
million at Disney Cruise Line, partially offset by increased royalties billion, driven by growth of $603 million in worldwide home enter-
of $52 million from the Tokyo Disney Resort. At the Walt Disney tainment and $76 million in domestic theatrical motion picture distri-
World Resort, decreased revenues reflected lower attendance, guest bution, partially offset by a decline of $95 million in international
spending and hotel occupancy driven by decreases in international theatrical motion picture distribution. Improvements in worldwide
and domestic visitation resulting from continued disruption in travel home entertainment revenues reflected strong DVD and VHS sales
and tourism and softness in the economy. At the Disneyland Resort, driven by successful titles including Disney/Pixar’s Monsters, Inc.,
decreased revenues were driven primarily by lower guest spending. Pearl Harbor, Snow White and the Seven Dwarfs and Cinderella II:
Lower guest spending at both Walt Disney World and Disneyland Dreams Come True along with the success of Miyazaki’s Spirited
was driven by ticket and other promotional programs as well as a Away in Japan, which is distributed in certain markets by a Japanese
higher mix of local guests, who have higher annual pass usage and subsidiary of the Company. In domestic theatrical motion picture
tend to spend less per visit. The increased royalties at Tokyo Disney distribution, revenue increases were driven by the performance of
Resort were due to the opening of the Tokyo DisneySea theme park Monsters, Inc., Signs and Lilo & Stitch. Despite the success of
and the Tokyo DisneySea Hotel Mira Costa in the fourth quarter of Monsters, Inc., decreased international theatrical motion picture dis-
the prior year. tribution revenues reflected stronger performance of prior-year titles,
Segment operating income decreased 26%, or $417 million, to which included Pearl Harbor, Unbreakable and Dinosaur.
$1.2 billion, driven by revenue declines at the Walt Disney World Segment operating income increased 5%, or $13 million, to $273
Resort and Disneyland Resort, partially offset by decreased costs and million, due to increases in worldwide home entertainment, partially
expenses and increased royalties from the Tokyo Disney Resort. offset by a decline in worldwide theatrical motion picture distribu-
Costs and expenses, which consist principally of labor, costs of mer- tion. Costs and expenses, which consist primarily of production cost
chandise, food and beverages sold, depreciation, repairs and mainte- amortization, distribution and selling expenses, product costs and par-
nance, entertainment and marketing and sales expense, decreased 2%, ticipation costs, increased 12%, or $669 million, driven by increases
55
8. in worldwide home entertainment and worldwide theatrical motion successful releases during the current year including Lucky Man: A
picture distribution. Increased costs in worldwide home entertainment Memoir by Michael J. Fox and Hope Through Heartsongs.
reflected higher marketing, distribution and participation costs due On a pro forma basis, segment operating income decreased 6%,
to Monsters, Inc. and Pearl Harbor on DVD and VHS. Higher costs or $25 million, to $394 million, primarily driven by declines in mer-
in worldwide theatrical motion distribution reflected increased mar- chandise licensing and at Disney Interactive, partially offset by
keting and distribution costs and higher participation costs for increases at the Disney Store and Disney Catalog. Costs and
Monsters, Inc. and Signs and an aggregate $98 million impairment expenses, which consist primarily of labor, product costs, including
write-down for Treasure Planet, including a $74 million reduction in product development costs, distribution and selling expenses and
capitalized film production costs recorded after the film was released leasehold expenses, decreased 7% or $154 million, primarily driven
on November 27, 2002 (see Note 16 to the Consolidated Financial by lower costs at the Disney Store due to the sale of the Japan busi-
Statements). ness, closures of Disney Store locations domestically and lower
advertising costs. Decreased costs also reflected lower Disney
2001 vs. 2000 Revenues increased 2%, or $91 million to, $6.0 bil- Interactive sales volumes as well as cost reductions at the Disney
lion, driven by growth of $312 million in worldwide home entertain- Catalog. These decreases were partially offset by volume increases
ment and $126 million in stage plays, partially offset by a decline at the continuing Disney Stores and at publishing.
of $306 million in worldwide theatrical motion picture distribution. As-reported revenues decreased 6% to $2.4 billion and segment
Improvements in worldwide home entertainment revenues reflected operating income decreased 2% to $394 million. As-reported amounts
strong DVD and VHS performance driven by successful animated include ABC Family operations commencing on the acquisition date,
titles including Disney/Pixar’s Toy Story 2, Dinosaur, The Emperor’s October 24, 2001.
New Groove and Lady and the Tramp II and stronger performing live-
action titles including Spy Kids, Scary Movie, Gone in 60 Seconds 2001 vs. 2000 On an as-reported basis, revenues decreased 6%, or
and Remember the Titans. Growth in stage plays reflected perform- $172 million, to $2.6 billion, primarily reflecting declines of $157
ances of The Lion King in additional cities and improved perform- million at the Disney Stores, which were driven by lower compara-
ance of AIDA. In worldwide theatrical motion picture distribution, the tive store sales in North America and the impact of the disposition of
success of Pearl Harbor, Spy Kids and Princess Diaries, faced diffi- Fairchild Publications in the first quarter of fiscal 2000.
cult comparisons to fiscal 2000 titles, which included Toy Story 2, Segment operating income increased 4%, or $15 million, to $401
Tarzan, Dinosaur, Scary Movie and The Sixth Sense. million, primarily driven by benefits from cost reduction initiatives,
Segment operating income increased $134 million, to $260 mil- partially offset by declines at the Disney Stores in North America.
lion, due to increases in worldwide home entertainment and stage Costs and expenses decreased 8% or $187 million, primarily due to
plays. Costs and expenses decreased 1%, or $43 million, driven by lower sales volume at the Disney Stores in North America, decreased
decreases in worldwide theatrical motion picture distribution, par- catalog circulation and advertising costs and the impact of cost reduc-
tially offset by increases in worldwide home entertainment. In world- tion initiatives.
wide theatrical motion picture distribution, cost decreases reflected
S TOCK OP TION AC C O U N T I N G
lower distribution expenses and production costs amortization in fis-
cal 2001 as well as higher participation expenses in fiscal 2000, due The Company has elected to continue using the intrinsic-value
to Toy Story 2 and The Sixth Sense. The increased costs in worldwide method of accounting for stock-based awards granted to employees
home entertainment reflected higher distribution expense and produc- until a uniform method of valuing and expensing stock options is
tion costs amortization driven by an increase in VHS and DVD unit promulgated. Accordingly, the Company has not recognized compen-
sales and higher participation costs due to the success of Toy Story 2 sation expense for the fair value of its stock-based awards to employ-
in fiscal 2001. Stage plays operating expenses also increased due to ees in its Consolidated Statements of Income. Companies electing to
more productions in fiscal 2001. remain with the intrinsic-value method accounting in APB 25 must
make pro forma disclosures, as if the fair value based method of
Consumer Pro d u c t s accounting had been applied.
2002 vs. 2001 On a pro forma basis, revenues decreased 7%, or
$179 million, to $2.4 billion, reflecting declines of $81 million in
merchandise licensing, $63 million at Disney Interactive and $57 mil-
lion at the Disney Store, partially offset by increases of $22 million
in publishing operations. The decline in merchandise licensing
reflected lower guarantee payments in the current year and soft mer-
chandise licensing performance domestically and internationally.
Lower revenues at Disney Interactive were due to weaker performing
personal computer CD-ROM and video game titles. At the Disney
Store, higher comparative store sales were more than offset by lower
revenues due to the sale of the Disney Store business in Japan during
the third quarter of the current year as well as the impact of store clo-
sures domestically. Higher publishing revenues were driven by the
56
9. The Walt Disney Company and Subsidiaries
L I QUIDITY AND CA PI T A L RESOURC E S
The following table reflects pro forma net income (loss) and earn-
ings (loss) per share had the Company elected to record an expense Cash provided by operations decreased 25%, or $762 million, to $2.3
for employee stock options pursuant to the provisions of SFAS 123. billion, reflecting lower pretax income before non-cash charges and
increased film and television production spending and an increase in
Year Ended September 30,
accounts receivable due to the timing of home video releases, par-
(in millions, except for per share data) 2001 2000
2002 tially offset by lower cash tax payments, and the timing of accounts
payable and NFL payments.
Net income (loss) attributed to
During the year, the Company invested $1.1 billion in parks,
Disney common stock:
resorts and other properties. Investments in parks, resorts and other
As reported $1,236 $ (41) $1,196
properties by segment are as follows:
Pro forma after option
expense 930 (325) 958
Year Ended
Diluted earnings (loss) per share
September 30,
attributed to Disney common
(in millions) 2002 2001
stock:
Media Networks $ 151 $ 207
As reported 0.60 (0.02) 0.57
Parks and Resorts 636 1,278
Pro forma after option
Studio Entertainment 37 36
expense 0.45 (0.15) 0.46
Consumer Products 58 70
Corporate and unallocated shared expenditures 204 204
These pro forma amounts may not be representative of future
disclosures since the estimated fair value of stock options is amor- $1,086 $1,795
tized to expense over the vesting period, and additional options may
be granted in future years.
Corporate and unallocated shared capital expenditures primarily
Fully diluted shares outstanding and diluted earnings per share
include hardware and capitalized software costs for new company
include the effect of in-the-money stock options calculated based
wide finance and administrative systems.
on the average share price for the period. The dilution from employee
Lower spending was driven by decreased Parks and Resorts capi-
options increases as the Company’s share price increases, as shown
tal expenditures reflecting the completion of Disney’s California
below:
Adventure which opened in February 2001, and certain other resort
properties in Florida.
Total Percentage
Disney In-the- Incremental of Average Hypothetical On October 24, 2001, the Company acquired ABC Family for
Share Money Diluted Shares FY2002 $5.2 billion, funded with $2.9 billion of new long-term borrowings,
Price Options Shares(1) Outstanding EPS Impact(3)
plus the assumption of $2.3 billion of borrowings (of which $1.1 bil-
$20.40 24 million —(2) $0.00 lion was subsequently repaid).
During the year, the Company received proceeds totaling $601
25.00 104 million 8 million .39% 0.00
million from the sale of investments, primarily the remaining shares
30.00 135 million 19 million .93% 0.00
of Knight-Ridder, Inc. that the Company received in connection
40.00 207 million 43 million 2.10% (0.01)
with the disposition of certain publishing assets in fiscal 1997.
50.00 216 million 61 million 2.98% (0.01)
Additionally, the Company received aggregate proceeds of $200 mil-
Represents the incremental impact on fully diluted shares outstanding
(1)
lion from the sale of the Disney Store business in Japan and the sale
assuming the average share prices indicated, using the treasury stock method.
of certain real estate properties in the U.K. and Florida.
Under the treasury stock method, the tax effected proceeds that would be
During fiscal 2001, the Company invested $480 million to acquire
received from the exercise of all in-the-money options are assumed to be
the copyright for certain intellectual property, radio station and pub-
used to repurchase shares.
Fully diluted shares outstanding for the year ended September 30, 2002 total
(2)
lishing assets and the rights to a music library. In fiscal 2001, invest-
2,044 million and include the dilutive impact of in-the-money options at the ing activities also included $137 million of cash proceeds generated
average share price for the period of $20.40. At the average share price of
primarily from the sale of Infoseek Japan, K.K. Additionally, cash
$20.40, the dilutive impact of in-the-money options was 4 million shares
proceeds from the sale of investments resulted primarily from the
for the year.
sale of Knight-Ridder, Inc. shares. During fiscal 2000, investing
Based upon fiscal 2002 earnings of $1,236 million or $0.60 per share.
(3)
activities included cash proceeds from the sale of Fairchild
Publications and Eurosport. Fiscal 2000 cash proceeds from the sale
of investments were driven by the sale of Inktomi shares acquired
through the disposition of Ultraseek.
57
10. During the year, the Company’s borrowing activity was as Total commitments to purchase broadcast programming approxi-
follows: mated $14.6 billion at September 30, 2002, including approximately
$1.1 billion for available programming. These amounts include
(in millions) Additions Payments Total
approximately $11.3 billion related to sports programming rights,
Commercial paper borrowings including a six year agreement with the NBAto televise more than
(net change for the year) $ — $ (33) $ (33) 100 regular and post-season games on the ABC Television Network
US medium term notes and other and ESPN, an eight year contract for NFLprogramming, which com-
USD denominated debt 3,049 (986) 2,063 menced with the 1998 season, multiple contracts for college football
European medium term notes 989 — 989 programming, and two six year contracts for MLB programming,
Other — (76) (76) which commenced in fiscal 2001 and 2002, respectively.
Debt repaid in connection with Contractual commitments relating to broadcast programming
the ABC Family acquisition — (1,051) (1,051) rights are payable as follows (in millions):
$4,038 $(2,146) $ 1,892
2003 $ 4,198
2004 3,107
The borrowings issued have effective interest rates, including the 2005 2,882
impact of cross-currency and interest rate swaps, ranging from 2.2% 2006 2,296
to 7.0% and mature in fiscal 2005 through fiscal 2032. See Note 7 to 2007 1,128
the Consolidated Financial Statements for more detailed information Thereafter 980
regarding the Company’s borrowings.
$14,591
Commercial paper borrowings outstanding as of September 30,
2002 totaled $721 million, with maturities of up to one year, sup-
ported by $4.5 billion of bank facilities, half scheduled to expire in The Company expects the ABC Television Network, ESPN and
2003, and the other half expiring in 2005. These bank facilities allow the Company’s television and radio stations to continue to enter into
for borrowings at LIBOR-based rates plus a spread, depending upon programming commitments to purchase the broadcast rights for vari-
the Company’s public debt rating. As of September 30, 2002, the ous feature films, sports and other programming.
Company had not borrowed against these bank facilities. Over the past year, significant changes have occurred in the com-
The Company has a U.S. shelf registration statement which mercial insurance market which are impacting the cost and avail-
allows the Company to borrow up to $7.5 billion of which $3.4 bil- ability of the Company’s insurance coverage. The Company has
lion is available at September 30, 2002. The Company also has a successfully renewed all of its significant policies in this current
Euro medium-term note program, which permits the issuance of up to fiscal year, though the premiums and deductibles have increased.
approximately $4 billion of additional debt instruments, which has a During the third quarter of the current year, the Company established
$2.4 billion of capacity at September 30, 2002. a wholly owned captive insurance company to insure certain compo-
During fiscal 2001, the Company acquired approximately 63.9 nents of loss exposure which were previously insured by third party
million shares of Disney common stock and 1.8 million shares of insurance companies. Accordingly, the Company’s risk of loss
Internet Group common stock for approximately $1.1 billion and $10 has increased.
million, respectively. No shares were repurchased during the current As disclosed in the Notes 8 and 14 to the Consolidated Financial
year. As of September 30, 2002, the Company was authorized Statements, the Company has exposure for certain legal and tax mat-
to purchase up to approximately 330 million shares of company ters. Management believes that it is currently not possible to estimate
common stock. the impact, if any, that the ultimate resolution of these matters will
The Company declared a dividend ($0.21 per Disney share) on have on the Company’s financial position or cash flows.
December 3, 2002 related to fiscal 2002, which will be payable As disclosed in Note 4 to the Consolidated Financial Statements,
January 9, 2003 to shareholders of record on December 13, 2002. the Company’s investment portfolio includes commercial aircraft
The Company paid a $434 million dividend ($0.21 per Disney share) leveraged lease investments made between 1992 and 1994 totaling
during the first quarter of fiscal 2000 applicable to fiscal 1999, paid a $289 million, which are diversified across three air carriers (United
$438 million dividend ($0.21 per Disney share) during the first quar- Airlines – $114 million, Delta Airlines – $119 million, and FedEx –
ter of fiscal 2001 applicable to fiscal 2000 and paid a $428 million $56 million) and eleven aircraft. Risk of loss under these transactions
dividend ($0.21 per Disney share) during the first quarter of the cur- is primarily related to the ability of the air carriers to make underly-
rent year applicable to fiscal 2002. See Note 10 to the Consolidated ing lease payments.
Financial Statements. We continue to monitor our investment in commercial aircraft
The Company has a 39% interest in Euro Disney S.C.A., which leasing transactions given the current status of the airline industry.
operates the Disneyland Resort Paris. As of September 30, 2002, We have, in particular, been monitoring United Airlines which has
Euro Disney has drawn $61 million under a $164 million line of indicated that if it does not obtain significant concessions from each
credit with the Company and it is expected that Euro Disney will of its employee unions, achieve cost savings in other operating
draw additional amounts under the credit line during fiscal 2003. As areas of the company and obtain a loan guarantee from the Airline
of September 30, 2002, Euro Disney had on a US GAAPbasis, total Transportation Stabilization Board, it will have to file for bank-
assets of $3.0 billion and total liabilities of $2.9 billion, including ruptcy protection. To date, all payments on these leases have been
borrowings of $2.2 billion.
58
11. The Walt Disney Company and Subsidiaries
made when due. The inability of any of the companies to make accounting rules. The values of the television program licenses and
their lease payments or the termination of our leases through a rights are reviewed using a daypart methodology. The Company’s
bankruptcy proceeding could result in material charges related to a dayparts are: early morning, daytime, late night, prime time, news,
write-down of some or all of our investment and could accelerate children and sports. A daypart is defined as an aggregation of pro-
income tax payments. grams broadcast during a particular time of day or programs of a sim-
The Company believes that its financial condition is strong and ilar type. Estimated values are based upon assumptions about future
that its cash, other liquid assets, operating cash flows, access to debt demand and market conditions. If actual demand or market condi-
and equity capital markets and borrowing capacity, taken together, tions are less favorable than our projections, potentially significant
provide adequate resources to fund ongoing operating requirements film, television or programming cost write-downs may be required.
and future capital expenditures related to the expansion of existing
businesses and development of new projects. However, the Revenue Recognition The Company has revenue recognition poli-
Company’s operating cash flow and access to the capital markets can cies for its various operating segments, which are appropriate to the
be impacted by macroeconomic factors outside of its control. In addi- circumstances of each business. See Note 2 to the Consolidated
tion to macroeconomic factors, the Company’s borrowing costs can Financial Statements for a summary of these revenue recognition
be impacted by short- and long-term debt ratings assigned by inde- policies.
pendent rating agencies, which are based, in significant part, on the We record reductions to revenues for estimated future returns of
Company’s performance as measured by certain credit measures merchandise, primarily home video, DVD and software products, and
such as interest coverage and leverage ratios. On October 4, 2002, for customer programs and sales incentives. These estimates are
Standard & Poor’s Ratings Services lowered its long-term ratings on based upon historical return experience, current economic trends and
the Company to BBB+ from A- and removed the Company’s ratings projections of customer demand for and acceptance of our products.
from CreditWatch where they were placed with negative implications Differences may result in the amount and timing of our revenue for
on August 2, 2002. At the same time, the A-2 short-term corporate any period if actual performance varies from our estimates.
credit rating, which was not on CreditWatch, was affirmed. The cur-
rent outlook is stable. On October 18, 2002, Moody’s Investors Goodwill, Intangible Assets, Long-lived Assets and Investments
Service downgraded the Company’s long-term debt rating to Baa1 Effective October 1, 2001, we adopted SFAS 142, as described more
from A3, concluding the review for possible downgrade that com- fully in Note 2 of the Consolidated Financial Statements. SFAS 142
menced on August 5, 2002. The Company’s short-term rating of P2 requires that goodwill and other intangible assets be tested for
was affirmed and the outlook is stable. impairment within six months of the date of adoption and then on a
periodic basis thereafter. During the first half of the current fiscal
OTHER MAT T E R S year, we completed our impairment testing and determined that there
Accounting Policies and Estimat e s were no impairment losses related to goodwill and other intangible
We believe that the application of the following accounting policies, assets. On October 1, 2002, we updated our impairment test and
which are important to our financial position and results of opera- determined that there was no impairment. In assessing the recover-
tions, requires significant judgments and estimates on the part of ability of goodwill and other intangible assets, projections regarding
management. For a summary of all of our accounting policies, estimated future cash flows and other factors are made to determine
including the accounting policies discussed below, see Note 2 of the fair value of the respective assets. If these estimates or related
the Consolidated Financial Statements. projections change in the future, we may be required to record
impairment charges for these assets.
Film and Television Revenues and Costs We expense the cost of Long-lived assets include certain long-term investments. The fair
film and television production and participations as well as multi- value of the long-term investments is dependent on the performance
year sports rights over the applicable product life cycle based upon of the companies we invest in, as well as volatility inherent in the
the ratio of the current period’s gross revenues to the estimated external markets for these investments. In assessing potential impair-
remaining total gross revenues. These estimates are calculated on an ment for these investments, we will consider these factors as well as
individual production basis for film and television and on an individ- forecasted financial performance of our investees. If these forecasts
ual contract basis for sports rights. Estimates of total gross revenues are not met, impairment charges may be required.
can change due to a variety of factors, including the level of market
acceptance, advertising rates and subscriber fees. Contingencies and Litigation We are currently involved in certain
Television network and station rights for theatrical movies, series legal proceedings and, as required, have accrued our estimate of the
and other programs are charged to expense based on the number of probable costs for the resolution of these claims. This estimate has
times the program is expected to be shown. Estimates of usage of tel- been developed in consultation with outside counsel and is based
evision network and station programming can change based on com- upon an analysis of potential results, assuming a combination of liti-
petition and audience acceptance. Accordingly, revenue estimates and gation and settlement strategies. It is possible, however, that future
planned usage are reviewed periodically and are revised if necessary. results of operations for any particular quarterly or annual period
A change in revenue projections or planned usage could have an could be materially affected by changes in our assumptions or the
impact on our results of operations. effectiveness of our strategies related to these proceedings. See Note
Costs of film and television productions and programming costs 14 to the Consolidated Financial Statements for more detailed infor-
are subject to valuation adjustments pursuant to the applicable mation on litigation exposure.
59
12. Income Tax Audits As a matter of course, the Company is regularly In June 2002, the FASB issued Statement of Financial Accounting
audited by Federal, state and foreign tax authorities. From time to Standards No. 146, Accounting for Costs Associated with Exit or
time, these audits result in proposed assessments. Among current Disposal Activities (SFAS 146). SFAS 146 requires that a liability for
audits, the Internal Revenue Service (IRS) is in the final stages of its a cost associated with an exit or disposal activity be recognized when
examination of the Company’s federal income tax returns for 1993 the liability is incurred. SFAS 146 requires that the initial measure-
through 1995. In connection with this examination, the IRS has pro- ment of a liability be at fair value. SFAS 146 will be effective for exit
posed assessments that challenge certain of the Company’s tax posi- or disposal activities that are initiated after December 31, 2002 with
tions which, if upheld through the administrative and legal process, early adoption encouraged. The Company plans to adopt SFAS 146
could have a material impact on the Company’s earnings and cash effective October 1, 2002 and does not expect that the adoption will
flow. The Company believes that its tax positions comply with appli- have a material impact on its consolidated results of operations and
cable tax law and it intends to defend its positions vigorously. The financial position.
Company believes it has adequately provided for any reasonably Effective October 1, 2000, the Company adopted AICPA
foreseeable outcome related to these matters, and it does not antici- Statement of Position No. 00-2, Accounting by Producers or
pate any material earnings impact from their ultimate resolution. Distributors of Films (SOP00-2). The Company’s results of opera-
During 2002, the Company negotiated the settlement of a number of tions and financial position reflect the impact of the new standard
proposed assessments, and it continues to pursue favorable settlement commencing October 1, 2000 and the Company recorded a one-time
of the remaining items. See Note 8 to the Consolidated Financial after-tax charge of $228 million, or $0.11 per share, representing the
Statements for more detailed information on the Company’s income cumulative effect of the adoption of SOP00-2 in its consolidated
tax exposure. financial statements for the year ended September 30, 2001.
In June 1998, the Financial Accounting Standards Board (FASB)
Accounting Change s issued Statement of Financial Accounting Standards No. 133
In July 2001, the FASB issued Statement of Financial Accounting Accounting for Derivative Instruments and Hedging Activities (SFAS
Standards No. 141, Business Combinations (SFAS 141), which 133), subsequently amended by SFAS No. 137 and SFAS No. 138.
requires that all business combinations initiated after June 30, 2001 SFAS 133 requires the Company to record all derivatives on the bal-
be accounted for under the purchase method. SFAS 141 super- ance sheet at fair value. Changes in derivative fair values will either
seded APB Opinion No. 16, Business Combinations, and State- be recognized in earnings as offsets to the changes in fair value of
ment of Financial Accounting Standards No. 38, Accounting for related hedged assets, liabilities and firm commitments or, for fore-
Preacquisition Contingencies of Purchased Enterprises and is effec- casted transactions, deferred and recorded as a component of accu-
tive for all business combinations initiated after June 30, 2001. mulated other comprehensive income (AOCI) until the hedged
Effective October 1, 2001, the Company adopted SFAS 142 transactions occur and are recognized in earnings. The ineffective
which addresses the financial accounting and reporting for acquired portion of a hedging derivative’s change in fair value will be immedi-
goodwill and other intangible assets. As a result of adopting SFAS ately recognized in earnings.
142, goodwill and a substantial amount of the Company’s intangible As a result of adopting SFAS 133 as of October 1, 2000, and in
assets are no longer amortized. Pursuant to SFAS 142, intangible accordance with the transition provisions, the Company recorded a
assets must be periodically tested for impairment, and the new stan- one-time after-tax charge of $50 million, or $0.02 per share, in its
dard provides six months to complete the impairment review. During Consolidated Statements of Income representing the cumulative
the second quarter of fiscal 2002, the Company completed its impair- effect of the adoption and an after-tax unrealized gain of $60 million
ment review, which indicated that there was no impairment. See Note to AOCI.
6 to the Consolidated Financial Statements.
Fo r wa r d - L o o k i n g S tat e m e n t s
The FASB also issued Statement of Financial Accounting
Standards No. 143, Accounting for Obligations Associated with the The Private Securities Litigation Reform Act of 1995 provides a
Retirement of Long-Lived Assets (SFAS 143) in August 2001, which safe harbor for forward-looking statements made by or on behalf of
establishes accounting standards for the recognition and measurement the Company. We may from time to time make written or oral state-
of an asset retirement obligation and its associated asset retirement ments that are “forward-looking,” including statements contained
cost. The Company expects that the provisions of SFAS 143 will not in this report and other filings with the Securities and Exchange
have a material impact on its consolidated results of operations and Commission and in reports to our stockholders. Such statements may,
financial position upon adoption. The Company plans to adopt SFAS for example, express expectations or projections about future actions
143 effective October 1, 2002. that we may take, including restructuring or strategic initiatives or
The Company adopted Statement of Financial Accounting about developments beyond our control including changes in domes-
Standards No. 144, Accounting for the Impairment or Disposal of tic or global economic conditions. These statements are made on the
Long-Lived Assets (SFAS 144) effective October 1, 2001, which did basis of management’s views and assumptions as of the time the
not have a material impact on the Company’s consolidated results of statements are made. There can be no assurance, however, that our
operations and financial position. SFAS 144 establishes a single expectations will necessarily come to pass.
accounting model for the impairment or disposal of long-lived assets,
including discontinued operations.
60
13. The Walt Disney Company and Subsidiaries
M ARKET RISK
Factors that may affect forward-looking statements. For an enter-
prise as large and complex as the Company, a wide range of factors The Company is exposed to the impact of interest rate changes,
could materially affect future developments and performance, includ- foreign currency fluctuations and changes in the market values of
ing the following: its investments.
Changes in Company-wide or business-unit strategies, which may
Policies and Pro c e d u r e s
result in changes in the types or mix of businesses in which the
In the normal course of business, the Company employs established
Company is involved or chooses to invest;
policies and procedures to manage its exposure to changes in interest
Changes in U.S., global or regional economic conditions, which rates, foreign currencies and the fair market value of certain of its
may affect attendance and spending at the Company’s parks and investments in debt and equity securities using a variety of financial
resorts, purchases of Company-licensed consumer products, the instruments.
advertising market for broadcast and cable television program- Our objective in managing exposure to interest rate changes are to
ming and the performance of the Company’s theatrical and home limit the impact of interest rate changes on earnings and cash flows
entertainment releases; and to lower overall borrowing costs. To achieve these objectives,
we primarily use interest rate swaps to manage net exposure to inter-
Changes in U.S. and global financial and equity markets, includ-
est rate changes related to the Company’s portfolio of borrowings.
ing market disruptions and significant interest rate fluctuations,
The Company maintains fixed rate debt as a percentage of its net
which may impede the Company’s access to, or increase the cost
debt between a minimum and maximum percentage, which is set
of, external financing for its operations and investments;
by policy.
Increased competitive pressures, both domestically and interna- Our objective in managing exposure to foreign currency fluctua-
tionally, which may, among other things, affect the performance tions is to reduce earnings and cash flow volatility in order to allow
of the Company’s parks and resorts operations and lead to management to focus on core business issues and challenges.
increased expenses in such areas as television programming Accordingly, the Company enters into various contracts that change
acquisition and motion picture production and marketing; in value as foreign exchange rates change to protect the value of its
existing foreign currency assets, liabilities, commitments and fore-
Legal and regulatory developments that may affect particular
casted foreign currency revenues. The Company utilizes option
business units, such as regulatory actions affecting environmental
strategies and forward contracts that provide for the sale of foreign
activities, consumer products, theme park safety, broadcasting or
currencies to hedge probable, but not firmly committed, revenues.
Internet activities or the protection of intellectual property; the
The Company also uses forward contracts to hedge foreign currency
imposition by foreign countries of trade restrictions or motion pic-
assets and liabilities in the same principal currencies. The principal
ture or television content requirements or quotas, and changes in
currencies hedged are European euro, British pound, Japanese yen
international tax laws or currency controls;
and Canadian dollar. By policy, the Company maintains hedge cover-
Adverse weather conditions or natural disasters, such as hurri- age between minimum and maximum percentages of its forecasted
canes and earthquakes, which may, among other things, impair foreign exchange exposures generally for periods not to exceed five
performance at the Company’s parks and resorts; years. The gains and losses on these contracts offset changes in the
value of the related exposures.
Technological developments that may affect the distribution of the
In addition, we use various financial instruments to minimize the
Company’s creative products or create new risks to the Company’s
exposure to changes in fair market value of certain investments in
ability to protect its intellectual property;
debt and equity securities.
Labor disputes, which may lead to increased costs or disruption of It is the Company’s policy to enter into foreign currency and
operations in any of the Company’s business units; interest rate transactions and other financial instruments only to the
extent considered necessary to meet its objectives as stated above.
Changing public and consumer taste, which may among other
The Company does not enter into these transactions for speculative
things, affect the Company’s entertainment, broadcasting and con-
purposes.
sumer products businesses generally or the Company’s parks and
resorts operating specifically, or result in increases in broadcasting
losses or loss of advertising revenue; and
International, political and military developments that may affect
among other things, travel and leisure businesses generally or the
Company’s parks and resorts operations specifically, or result
in increases in broadcasting costs or loss of advertising revenue.
This list of factors that may affect future performance and
the accuracy of forward-looking statements is illustrative, but by
no means exhaustive. Accordingly, all forward-looking statements
should be evaluated with the understanding of their inherent
uncertainty.
61
14. Value at Ris k
The Company utilizes a “Value-at-Risk” (VAR) model to determine
the maximum potential one-day loss in the fair value of its interest
rate, foreign exchange and qualifying equity sensitive financial
instruments. The VAR model estimates were made assuming normal
market conditions and a 95% confidence level. Various modeling
techniques can be used in a VAR computation. The Company’s com-
putations are based on the interrelationships between movements in
various interest rates, currencies and equity prices (a “variance/co-
variance” technique). These interrelationships were determined by
observing interest rate, foreign currency and equity market changes
over the preceding quarter for the calculation of VAR amounts at
year-end and over each of the four quarters for the calculation of
average VAR amounts during the year. The model includes all of the
Company’s debt as well as all interest rate and foreign exchange
derivative contracts and qualifying equity investments. The values of
foreign exchange options do not change on a one-to-one basis with
the underlying currencies, as exchange rates vary. Therefore, the
hedge coverage assumed to be obtained from each option has been
adjusted to reflect its respective sensitivity to changes in currency
values. Forecasted transactions, firm commitments and receivables
and accounts payable denominated in foreign currencies, which cer-
tain of these instruments are intended to hedge, were excluded from
the model.
The VAR model is a risk analysis tool and does not purport
to represent actual losses in fair value that will be incurred by the
Company, nor does it consider the potential effect of favorable
changes in market factors. See Note 13 to the Consolidated Finan-
cial Statements regarding the Company’s financial instruments at
September 30, 2002 and 2001.
The estimated maximum potential one-day loss in fair value, cal-
culated using the VAR model, is as follows (unaudited, in millions):
Interest
Rate Currency Equity
Sensitive Sensitive Sensitive
Financial Financial Financial Combined
Instruments Instruments Instruments Portfolio
VAR as of
September 30, 2002 $39 $15 $1 $33
Average VAR during
the year ended
September 30, 2002 $36 $13 $1 $33
Highest VAR during
the year ended
September 30, 2002 $40 $15 $3 $36
Lowest VAR during
the year ended
September 30, 2002 $27 $10 $1 $27
62