1. | 2003 Annual Report
HCA
Hospital Corporation of America
> In the future, hospitals will:
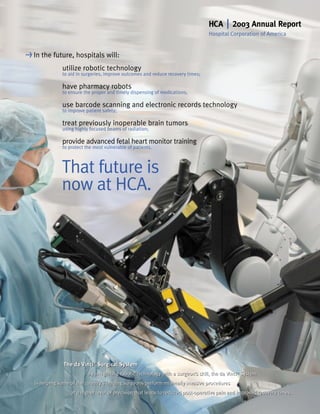
utilize robotic technology
to aid in surgeries, improve outcomes and reduce recovery times;
have pharmacy robots
to ensure the proper and timely dispensing of medications;
use barcode scanning and electronic records technology
to improve patient safety;
treat previously inoperable brain tumors
using highly focused beams of radiation;
provide advanced fetal heart monitor training
to protect the most vulnerable of patients.
That future is
now at HCA.
The da Vinci® Surgical System
®
By integrating robotic technology with a surgeon’s skill, the da Vinci® System
is helping some of the country’s leading surgeons perform minimally invasive procedures
at a higher level of precision that leads to reduced post-operative pain and improved recovery times.
2. HCA 2003 Annual Report Table of Contents for this PDF file
Mission Statement 2
Introduction 3
Financial Highlights 4
Letter to Shareholders 5
Map of HCA Locations 11
Board of Directors (photos) 13
Selected Financial Data 14
Management’s Discussion and Analysis of
Financial Condition and Results of Operations 16
Report of Management 31
Report of Independent Auditors 31
Consolidated Financial Statements
Income Statements 32
Balance Sheets 33
Stockholders’ Equity 34
Cash Flows 35
Notes to Consolidated Financial Statements 36
Quarterly Consolidated Financial Information 57
Senior Officers 58
Board of Directors 58
Corporate Information 59
Use the Bookmarks option in this PDF file to easily navigate
the document. To access the Bookmarks, press the Bookmarks
button in the upper left hand side of the menu bar and the
Bookmarks will appear. Press on the page you wish to access.
Mission and Values Statement
Above all else, we are committed to the care and improvement of human life. In
recognition of this commitment, we will strive to deliver high quality, cost-effective
healthcare in the communities we serve. In pursuit of our mission, we believe the following
value statements are essential and timeless:
1. We recognize and affirm the unique and intrinsic worth of each individual.
2. We treat all those we serve with compassion and kindness.
3. We act with absolute honesty, integrity and fairness in the way we conduct our business
and the way we live our lives.
4. We trust our colleagues as valuable members of our healthcare team and pledge to treat
one another with loyalty, respect, and dignity
HCA 2003 Annual Report
2
3. “As a physician, my primary
concern is the health and
well-being of my patients.
The commitment that HCA
is making to improve each
hospital with the most
technologically advanced
equipment, to invest in
the nursing and ancillary
personnel, and to support
patient safety initiatives
allows me to more effectively
care for my patients.”
Cindy C. Chang, MD
Menorah Medical Center
Emergency Department
Overland Park, Kansas
HCA combines the Cover page: Surgical teams at select HCA hospitals use the da Vinci®
Surgical System to perform a variety of the latest medical procedures,
clinical expertise of our
including mitral valve repairs, prostatectomies and single vessel
physicians and caregivers endoscopic coronary artery bypass surgery. A surgeon using the robot
with our operational operates from a console with a magnified three-dimensional viewer,
while robotic arms inside the patient mimic the skilled movements of
knowledge and financial
the surgeon’s hands. HCA hospitals such as Centennial Medical Center
resources to continually in Nashville, Tulane University Hospital and Clinic in New Orleans and
improve patient care. Henrico Doctors Hospital in Richmond, Va. are among the nation’s most
active users of this innovative surgical technology. Developed by
Intuitive Surgical, the da Vinci® System can reduce trauma to the body,
blood loss and post-operative pain and result in substantially shorter
hospital stays and recovery times.
HCA 2003 Annual Report
3
4. HCA Financial Highlights
2003 2002
as of and for the Years Ended December 31
(Dollars in millions, except per share amounts)
Results of Operations
Revenues $ 21,808 $ 19,729
Net income (a) $ 1,332 $ 833
Diluted earnings per share:
Net income (a) $ 2.61 $ 1.59
Shares used in computing diluted earnings
per share (in thousands) 510,874 525,219
Financial Position
Assets $ 21,063 $ 18,741
Working capital 1,654 766
Long-term debt, including amounts due within one year 8,707 6,943
Minority interests in equity of consolidated entities 680 611
Stockholders’ equity 6,209 5,702
Ratio of debt to debt plus common and minority equity 55.8% 52.4%
Other Data (b)
Number of hospitals at end of period 184 173
Licensed beds at end of period 42,108 39,932
Average daily census 22,234 21,509
Admissions 1,635,200 1,582,800
Outpatient revenues as a percentage of total patient revenues 37.2% 37.0%
Emergency room visits 5,130,500 4,802,800
Outpatient surgeries 814,300 809,900
a) The operating results for 2003 include a favorable change in estimate related to Medicaid cost report balances for cost
report years ended 1997 and prior of $41 million pretax, or $0.05 per diluted share, gains on sales of facilities of $85
million pretax, or $0.10 per diluted share, impairment of long-lived assets of ($130) million pretax, or ($0.16) per diluted
share, and investigation related costs of ($8) million pretax, or ($0.01) per diluted share. The operating results for 2002
include a ($603) million pretax charge, or ($0.80) per diluted share, related to the settlement with government agencies,
gains on the sales of facilities of $6 million pretax, or $0.01 per diluted share, a ($168) million pretax charge, or ($0.20)
per diluted share, on the impairment of investment securities, an impairment of long-lived assets of ($19) million pretax,
or ($0.03) per diluted share, and investigation related costs of ($58) million pretax, or ($0.07) per diluted share.
b) Excludes data for seven hospitals at December 31, 2003 and six hospitals at December 31, 2002 that are not consolidated
(accounted for using the equity method) for financial reporting purposes.
The terms “HCA” or the “Company” as used in this Annual Report refer to HCA Inc. and its affiliates, unless otherwise stated
or indicated by context. The term “facilities” refers to entities owned or operated by subsidiaries or affiliates of HCA.
References herein to “HCA employees” or to “our employees” refer to employees of affiliates of HCA.
HCA Inc. is one of the leading health care services companies in the United
States. As of December 31, 2003, the Company operated 191 hospitals and
83 freestanding surgery centers, including 7 hospitals and 4 freestanding
surgery centers operated by equity method joint ventures. The Company’s
facilities are located in 23 states, England and Switzerland.
HCA 2003 Annual Report
4
5. Dr. Thomas Frist, Sr.
co-founder of HCA
Bettering the human condition is the
“
greatest good any individual can achieve.”
Dear Shareholder,
While in many respects 2003 was a very successful year for HCA, we
were somewhat disappointed with our financial results. Our 2003 results
were affected by the troublesome economy and attendant unemployment
Robotic Surgical Systems
levels, which we believe limited the rate at which the American public
sought, and were able to pay for, health care services. While HCA fared
better than many in the industry, the reduced rate of growth in patient
volume and an increase in uninsured and bad debt levels slowed our
earnings growth. Even though our hospital management teams did an
Pharmacy Robots
exemplary job reacting to these forces by effectively managing operating
expenses, we still experienced an earnings shortfall primarily as a result
of these two issues.
An obvious concern of our Board and management was to determine
whether such changes in these fundamental issues are short-term in
Patient Safety Technology
nature or whether they reflect a more permanent dynamic with which
the health care industry and HCA must contend.
Accordingly, in the fall of 2003, we embarked on a comprehensive
analysis of our industry, our market position within the industry, and the
other political and economic factors that could affect our future growth.
Innovative Radiation Treatment
As you would expect, our review included a thorough analysis of
population and health care utilization trends, pricing and reimbursement
stability, expense trends, effectiveness of our operating model, the
appropriateness of our organizational structure, the implications of
developing technology, and an assessment of the consumers’ (our
Advanced Clinical Training
patients, physicians, insurance payers and shareholders) perspective of
our industry.
The results of this effort reinforced our belief in the positive, long-
term growth prospects for the health care industry, and in particular, HCA
and the appropriateness of our strategy and market positions. In short,
HCA 2003 Annual Report
5
6. while we have experienced a slowdown in the demand for health care (left to right)
Richard M. Bracken, President and COO
services, over the long-term we believe the underlying macroeconomic
and Jack O. Bovender, Jr., Chairman and CEO
factors that affect demand, such as favorable population growth trends in
in front of a portrait of Dr. Thomas Frist, Sr.,
our markets, our suburban locations, an increasing utilization rate due to co-founder of HCA
an aging public, and a broadening scope of available health care services
continue to create a compelling future for HCA.
We believe our strategy of operating networks of hospitals and
treatment centers with substantial market share, in large urban and
suburban areas located predominantly in the Southern and Western
United States, remains a good one. We will also continue to selectively
consider acquisition opportunities that fit this objective. We see no need
to substantially diversify our lines of business, materially change our
market locations, or otherwise significantly alter our operating strategy.
Our overall assessment did lead us, however, to strengthen our
outpatient services organization. Prompted by new technologies, as well
as increased competition, we elected to create a new level of focus on
and leadership of our outpatient facility development and operations.
We achieved this by creating a new outpatient structure within our
organization that will be solely focused on the growth and improvement
of this growing sector of our industry.
We remain convinced our future growth, both in terms of patient
demand and financial returns, will be primarily from our existing markets
and base of hospitals. These hospitals will be supported by a robust
capital spending program and a very focused patient and physician
satisfaction strategy. To that end, we remain committed to operate our
hospitals, and our surgery, imaging and treatment centers with an ever-
improving level of clinical effectiveness, patient safety and administrative
efficiency. Consider the following developments in 2003:
HCA 2003 Annual Report
6
7. efficiently dispense medications
Robotic pharmacies that
s We invested over $1.8 billion in our existing facilities. This investment of
Pharmacy Robot
$44,200 per bed is among the highest in the industry and serves to
ROBOT-Rx™ is a centralized robotic
assure our hospitals are technologically up-to-date, maintained for the
drug distribution system that can fill
more than 1,200 drug doses an optimum level of performance and aesthetically pleasing to our patients
hour and run 24 hours a day. In use and their families.
at several HCA hospitals, this s We created additional capacity for future growth of our operating units.
system, which was developed by More specifically, we added over 450 beds to our hospitals; constructed
McKesson Automation, Inc.,
two new hospitals with approximately 180 beds; increased operating
automates the storage, retrieval
room capacity, added imaging equipment or expanded emergency
and dispensing of barcoded unit-
departments at approximately 75 percent of our hospitals; and developed
dose inpatient medications,
almost one million square feet of medical office buildings to house
improving medication safety,
physicians desiring to practice near our hospital campuses. These
speeding up delivery and reducing
investments will position us favorably to accommodate the patient
inventory and labor costs. By
demand we forecast in the communities we serve.
automating drug dispensation and
s In April 2003, we completed the acquisition of Health Midwest, an 11-
reducing repetitive, mundane,
hospital system located within the greater Kansas City area. With
manual tasks in the central
approximately $900 million in annual revenues and an estimated 35
pharmacy, the ROBOT-Rx allows
hospital pharmacists to help percent market share, we believe it was the largest not-for-profit
improve patient care by spending acquisition on record in our industry. We plan to invest more than $450
more time reviewing patient charts million within four years in this market, which includes a commitment to
and collaborating with physicians. build two replacement hospitals.
s We invested $130 million rebuilding our information technology and
administrative infrastructure. Several years ago, we embarked on an
aggressive program to reinvent our revenue and supply chain operations.
We created 12 regional centers across America to handle these
functions, rather than having operations at each individual
hospital. This effort was essentially completed in 2003 with our
HCA 2003 Annual Report
7
8. enhance patient safety
Medication administration systems to
revenue and supply chain operations now being handled by this new eMAR & Barcoding
organizational architecture. These new centers not only improve the Part of HCA’s industry-leading patient
safety effort, eMAR (Electronic
accuracy of our billing and collection functions, but also improve our
Medication Administration Record)
supply expense and cash management processes, and reduce the fixed
& Barcoding, use wireless barcoding
cost of our operations.
technology to ensure that the right
s In 2003, we continued the advancement of our patient safety and
medication is delivered to the right
satisfaction initiatives. We invested over $30 million to develop and patient, at the right time, through the
deploy new patient safety technologies aimed at reducing medication right means and in the right dosage.
errors. Barcode assisted medication administration is fully implemented The system includes individually
packaged and coded medications,
in almost half our hospitals, and we expect by mid-year of 2005 it will
mobile scanners, barcoded patient
be in all HCA hospitals. We are now monitoring emergency department
wristbands and electronic medication
length of stay in all hospitals, aimed at speeding time to treatment and
records to improve medication
reducing wait times for patients. Cardiovascular outcomes continue to
procedures. eMAR & Barcoding
improve as we expand our focus from cardiovascular surgery to various
provide a greater level of reassurance
aspects of cardiovascular disease. to patients, nurses and physicians
s This was also a year in which we made a concerted effort to be the about the safety of medication
employer of choice in all of our markets. Labor costs are at favorable administration. It is estimated that
technology of this kind is only
levels for the company and, equally as important, employee satisfaction
available in about one percent of U.S.
rates are at an all-time high. Our hospital management teams have
hospitals. Developed by HCA’s Quality
reduced turnover rates of our employees for four consecutive years.
Department, clinical staff from HCA
hospitals across the country and
All of these improvements were possible because of our strong cash
MEDITECH, a leading medical
position. Our ability to consistently generate significant cash flow gives us
software company, eMAR & Barcoding
the flexibility to examine new ways in which to increase shareholder value.
have been deployed at 82 HCA
In 2003 we continued our hospitals and will be in every HCA
share repurchase plan. During hospital by mid-year of 2005.
the year, we repurchased over
31 million shares at a total
HCA 2003 Annual Report
8
9. Innovative clinical technology that can save lives
Leksell Gamma Knife® cost of approximately $1.1 billion, an average share price of $35.76. Since
we began our share repurchase program in 1997, we have repurchased 234.5
Gamma Knife® is among the most
million shares at a cost of $6.9 billion, an average share price of $29.51.
advanced technology available to
treat vascular malformations, Additionally in 2003, we positioned the company to increase our
tumors and functional disorders. dividend payout. In January 2004, our Board approved a quarterly dividend
Developed by Elekta, Gamma of $0.13 per share payable June 1 to shareholders of record on May 1.
Knife® is not actually a knife, but a Annualizing this quarterly dividend would represent a payout of
device that directs 201 focused
approximately 20 percent of 2003 net earnings. This is the first time we
beams of radiation at the target
have increased our dividend in over 10 years, reflecting the enhanced
area, allowing doctors to treat
attractiveness of cash dividends as a means of providing increased and more
tumors without opening the brain
predictable returns to our shareholders and our confidence in the financial
or risking damage to delicate
strength of our company.
tissues. Precise and powerful, the
Finally in 2003, we redefined our goal of strengthening our balance
20-ton Gamma Knife® can destroy
sheet to reduce the company’s level of risk. Accordingly, we set to reduce
deep-seated vascular
our ratio of debt to debt plus common and minority equity from
malformations and brain tumors
approximately 55 percent to 50 percent by the end of 2005. Though our
previously considered inoperable.
emphasis in each of these efforts was on a longer-term rather than
For patients whose age or other
medical conditions prevent them immediate value, we are proud of the steps taken in 2003 that we believe
from undergoing open will continue to create shareholder value in the years to come. Going
neurosurgery, Gamma Knife® can forward, we are now targeting earnings per share growth of low double-
be a life-saving procedure. digits. That is not to say we expect low double-digit EPS growth in every
reporting period. As in the past several years, we would expect to have some
quarters that grow below and some quarters above the target level.
In addition to the analysis of our business strategy, our asset
enhancement efforts, and the steps taken to increase shareholder value,
2003 also was a year in which we assessed our role in the solution
to a nationwide problem: the uninsured. There are
approximately 44 million Americans without health
HCA 2003 Annual Report
9
10. improve patient outcomes
Specialized clinical training to
insurance and many sectors of society — government, employers and the Fetal Heart
individual – must play a role in crafting a solution; nevertheless, this is a Monitor Certification
problem that poses particular challenges for the hospital industry and our HCA has adopted fetal heart
company. In 2003, we implemented a new charity care and financial monitoring principles and practices
established by the Association of
discount policy, which provides free care for those patients receiving non-
Women’s Health, Obstetric and
elective care, whose incomes are at or below 200 percent of the Federal
Neonatal Nurses (AWHONN). As a
Poverty Level (FPL), and applies graduated discounts for those whose
result, registered nurses in HCA
incomes fall between 200 and 400 percent of the FPL. We believe HCA’s
obstetrics departments receive
charity care and financial discount policy will significantly help many
industry-leading fetal heart monitor
uninsured patients.
training that is improving patient
When we reflect on 2003, we view it as a year with much change and
outcomes. HCA requires that all
many accomplishments and a year in which we invested our capital dollars
its obstetrical nurses receive this
wisely to position our company for the long-term. One of the founders of nationally recognized training to
HCA, Dr. Thomas F. Frist, Sr., was a guiding force behind the philosophy help them quickly identify and
that drives our company, a patient-first philosophy. Though the health care respond to signs of fetal distress.
industry has changed significantly since the days when HCA was started, As part of this effort, approximately
this philosophy continues to serve us well. The goal of doing what is right 4,600 nurses have received this
for the patient continues to drive not only our daily operating strategy, but specialized instruction and
every HCA hospital
our financial strategy as well. We believe HCA is positioned to continue to
has a certified
be a leader in the health care delivery system in the United States.
instructor to provide
training and expertise.
Sincerely,
Jack O. Bovender, Jr. / Chairman and CEO
Richard M. Bracken / President and COO
HCA 2003 Annual Report
10
11. HCA Locations
= Hospital = Surgery Center
Alaska
Alaska
Alaska Regional Hospital / Anchorage
California
Good Samaritan Hospital / San Jose
Los Gatos Surgical Center / Los Gatos
Los Robles Regional Medical Center / Thousand Oaks
Regional Medical Center of San Jose / San Jose
Riverside Community Hospital / Riverside
Riverside Community Surgi-Center / Riverside
San Jose Medical Center / San Jose
West Hills Hospital & Medical Center / West Hills
West Hills Surgical Center / West Hills
Colorado
Centrum Surgical Center / Greenwood Village
Lakewood Surgical Center / Lakewood
Midtown Surgical Center / Denver
North Suburban Medical Center / Thornton
Presbyterian/St. Luke’s Medical Center / Denver
Rose Medical Center / Denver
Sky Ridge Medical Center / Lone Tree
Spalding Rehabilitation Hospital / Aurora
Swedish Medical Center / Englewood
The Medical Center of Aurora / Aurora
Florida
Ambulatory Surgery Center / Tampa
Aventura Hospital and Medical Center / Aventura
Belleair Surgery Center / Clearwater
Blake Medical Center / Bradenton
Brandon Regional Hospital / Brandon
Brandon Surgery Center / Brandon Same Day Surgicenter of Orlando / Orlando
Capital Regional Medical Center / Tallahassee South Bay Hospital / Sun City Center
Cedars Medical Center / Miami Southwest Florida Regional Medical Center / Ft. Myers
Center for Special Surgery / St. Petersburg St. Lucie Medical Center / Port St. Lucie
Central Florida Regional Hospital / Sanford St. Lucie Surgery Center / Port St. Lucie
Central Florida Surgicenter / Lakeland St. Petersburg General Hospital / St. Petersburg
Columbia Hospital / West Palm Beach Surgery Center at Coral Springs / Coral Springs
Community Hospital / New Port Richey Surgery Center at St. Andrews / Venice
Countryside Surgery Center / Clearwater Surgery Center Bonita Bay / Bonita Springs
Doctors Hospital of Sarasota / Sarasota Surgical Park Center / Miami
Doctors Same Day Surgery Center / Sarasota Tallahassee Outpatient Surgery Center / Tallahassee
Tampa Eye & Specialty Surgery Center / Tampa
Edward White Hospital / St. Petersburg
Indiana
Englewood Community Hospital / Englewood Twin Cities Hospital / Niceville
University Hospital & Medical Center / Taramac
Fawcett Memorial Hospital / Port Charlotte Terre Haute Regional Hospital / Terre Haute
Florida Surgery Center / Altamonte Springs West Florida Hospital / Pensacola
Kansas
Fort Walton Beach Medical Center / Ft. Walton Beach Westside Regional Medical Center / Plantation
Gulf Coast Hospital / Fort Myers Allen County Hospital / Iola
Georgia
Gulf Coast Medical Center / Panama City Menorah Medical Center / Overland Park
Gulf Coast Surgery Center / Bradenton Overland Park Regional Medical Center / Overland Park
Atlanta Outpatient Peachtree Dunwoody Center / Atlanta
Jacksonville Surgery Center / Jacksonville Surgicare of Wichita / Wichita
Atlanta Outpatient Surgery Center / Atlanta
JFK Medical Center / Atlantis Surgicenter of Johnson County / Overland Park
Augusta Surgical Center / Augusta
Kendall Regional Medical Center / Miami Wesley Medical Center / Wichita
Buckhead Ambulatory Surgery Center / Atlanta
Kissimmee Surgery Center / Kissimmee Cartersville Medical Center / Cartersville
Kentucky
Lake City Medical Center / Lake City Coliseum Medical Centers / Macon
Largo Medical Center / Largo Frankfort Regional Medical Center / Frankfort
Coliseum Psychiatric Center / Macon
Lawnwood Regional Medical Center and Heart Institute / Ft. Pierce Greenview Regional Hospital / Bowling Green
Coliseum Same Day Surgery Center / Macon
Memorial Hospital Jacksonville / Jacksonville Doctors Hospital / Augusta
Louisiana
Merritt Island Surgery Center / Merritt Island Doctors Hospital / Columbus
New Port Richey Surgery Center / New Port Richey Avoyelles Hospital / Marksville
Doctors Hospital Surgery Center / Evans
North County Surgicenter / Palm Beach Gardens Dauterive Hospital / New Iberia
Emory Dunwoody Medical Center / Atlanta
North Florida Regional Medical Center / Gainesville DePaul-Tulane Behavioral Health Center / New Orleans
Emory Eastside Medical Center / Snellville
North Miami Beach Surgical Center / North Miami Beach Lafayette Surgery Center / Lafayette
Fairview Park Hospital / Dublin
Northside Hospital / St. Petersburg Lakeside Hospital / Metairie
Hughston Sports Medicine Hospital / Columbus
Northwest Medical Center / Margate Lakeview Regional Medical Center / Covington
Macon Northside Hospital / Macon
Oak Hill Hospital / Spring Hill North Monroe Medical Center / Monroe
Marietta Surgical Center / Marietta
Ocala Regional Medical Center / Ocala Oakdale Community Hospital / Oakdale
Northlake Medical Center / Tucker
Orange Park Medical Center / Orange Park Rapides Regional Medical Center / Alexandria
Northlake Surgical Center / Tucker
Orange Park Surgery Center / Orange Park Savoy Medical Center / Mamou
Palmyra Medical Centers / Albany
Osceola Regional Medical Center / Kissimmee Southwest Medical Center - Lafayette / Lafayette
Pediatric Center at Atlanta Outpatient / Atlanta
Outpatient Surgical Services / Plantation Tulane University Hospital and Clinic / New Orleans
Polk Medical Center / Cedartown
Palms West Hospital / Loxahatchee Winn Parish Medical Center / Winnfield
Redmond Regional Medical Center / Rome
Women’s & Children’s Hospital / Lafayette
Parkside Surgery Center / Jacksonville The Surgery Center of Rome / Rome
Plantation General Hospital / Plantation
Mississippi
Idaho
Plaza Surgery Center / Jacksonville
Raulerson Hospital / Okeechobee Garden Park Medical Center / Gulfport
Eastern Idaho Regional Medical Center / Idaho Falls
Regional Medical Center Bayonet Point / Hudson Gulf Port Outpatient Surgical Center / Gulfport
West Valley Medical Center / Caldwell
HCA 2003 Annual Report
11
12. Switzerland
United Kingdom
Las Palmas Medical Center / El Paso
Mainland Medical Center / Texas City
Medical Center of Arlington / Arlington
Medical Center of Lewisville / Lewisville
Medical Center of Plano / Plano
Medical City Dallas Hospital / Dallas
Methodist Ambulatory Surgery Center-Central San Antonio / San Antonio
Methodist Ambulatory Surgery Center-North Central / San Antonio
Methodist Ambulatory Surgery Center-Northeast / San Antonio
Methodist Ambulatory Surgery Hospital-Northwest / San Antonio
Methodist Children’s Hospital of South Texas / San Antonio
Methodist Specialty & Transplant Hospital / San Antonio
Metropolitan Methodist Hospital / San Antonio
North Austin Medical Center / Austin
North Central Medical Center / McKinney
North Hills Hospital / North Richland Hills
Northeast Methodist Hospital / San Antonio
Northwest Regional Hospital / Corpus Christi
Oakwood Surgery Center / Round Rock
Park Central Surgical Center / Dallas
Plaza Day Surgery / Fort Worth
Plaza Medical Center of Fort Worth / Fort Worth
Rio Grande Regional Hospital / McAllen
Rio Grande Surgery Center / McAllen
Round Rock Medical Center / Round Rock
South Austin Hospital / Austin
Southwest Texas Methodist Hospital / San Antonio
Spring Branch Medical Center / Houston
St. David’s Medical Center / Austin
St. David’s Pavilion / Austin
St. David’s Rehabilitation Center / Austin
Surgery Center of Plano / Plano
Surgical Center of El Paso / El Paso
Surgicare of Corpus Christi / Corpus Christi
Surgicare of South Austin / Austin
Texas Orthopedic Hospital / Houston
Texas Pediatric Surgery Center / North Richland Hills
Valley Regional Medical Center / Brownsville
West Houston Medical Center / Houston
Westpark Surgery Center / McKinney
Woman’s Hospital of Texas / Houston
Utah
Brigham City Community Hospital / Brigham City
Lakeview Hospital / Bountiful
Mountain View Hospital / Payson
Ogden Regional Medical Center / Ogden
St. Mark’s Hospital / Salt Lake City
Missouri St. Marks Outpatient Surgery Center / Salt Lake City
Baptist-Lutheran Medical Center / Kansas City Timpanogos Regional Hospital / Orem
Independence Regional Health Center / Independence
Virginia
Lafayette Regional Health Center / Lexington
Lee’s Summit Hospital / Lee’s Summit Alleghany Regional Hospital / Low Moor
Medical Center of Independence / Independence CJW Medical Center / Richmond
Research Belton Hospital / Belton Clinch Valley Medical Center / Richlands
Tennessee
Research Medical Center / Kansas City Dominion Hospital / Falls Church
Atrium Memorial Surgery Center / Chattanooga
Research Psychiatric Center / Kansas City Fairfax Surgical Center / Fairfax
Centennial Medical Center / Nashville Hanover Outpatient Surgery Center / Mechanicsville
Nevada Centennial Surgery Center / Nashville Henrico Doctor’s Hospital / Richmond
Grandview Medical Center / Jasper
Flamingo Surgery Center / Las Vegas John Randolph Medical Center / Hopewell
Hendersonville Medical Center / Hendersonville
Las Vegas Surgery Center / Las Vegas Lewis-Gale Medical Center / Salem
Horizon Medical Center / Dickson
MountainView Hospital / Las Vegas Montgomery Regional Hospital / Blacksburg
Parkridge Medical Center / Chattanooga
Sahara Surgery Center / Las Vegas Northern Virginia Community Hospital / Arlington
Southern Hills Hospital & Medical Center / Las Vegas Parkridge East Hospital / Chattanooga Pulaski Community Hospital / Pulaski
Parkridge Valley Hospital / Chattanooga
Sunrise Hospital and Medical Center / Las Vegas Reston Hospital Center / Reston
River Park Hospital / McMinnville The Retreat Hospital / Richmond
New Hampshire Skyline Medical Center / Nashville Tuckahoe Surgery Center / Richmond
Southern Hills Medical Center / Nashville
Parkland Medical Center / Derry
Washington
StoneCrest Medical Center / Smyrna
Portsmouth Regional Ambulatory Surgery Center / Portsmouth
Summit Medical Center / Hermitage
Portsmouth Regional Hospital / Portsmouth Capital Medical Center / Olympia
Salem Surgery Center / Salem
Texas West Virginia
North Carolina Bailey Square Surgery Center / Austin Putnam General Hospital / Hurricane
Bay Area Surgicare Center / Webster
Brunswick Community Hospital / Supply Raleigh General Hospital / Beckley
Bayshore Medical Center / Pasadena Saint Francis Hospital / Charleston
Oklahoma Bayshore Surgery Center / Pasadena St. Joseph’s Hospital / Parkersburg
Clear Lake Regional Medical Center / Webster
Edmond Medical Center / Edmond
United Kingdom
Conroe Regional Medical Center / Conroe
Oklahoma Surgicare / Oklahoma City
Corpus Christi Medical Center / Corpus Christi
OU Medical Center / Oklahoma City Lister Hospital / London
Del Sol Medical Center / El Paso
Southwestern Medical Center / Lawton London Bridge Hospital / London
Denton Regional Medical Center / Denton
Surgicare Midtown / Oklahoma City Princess Grace Hospital / London
East El Paso Surgery Center / El Paso The Harley Street Clinic / London
South Carolina East Houston Regional Medical Center / Houston The Portland Hospital for Women and Children / London
Gramercy Outpatient Surgery Center / Houston
Ambulatory Surgery and Diagnostic Center / Walterburo The Wellington Hospital / London
Green Oaks Hospital / Dallas
Colleton Medical Center / Walterboro
Switzerland
Kingwood Medical Center / Kingwood
Grand Strand Regional Medical Center / Myrtle Beach
Las Colinas Medical Center / Irving
Grande Dunes Surgery Center / Myrtle Beach Clinique De Carouge / Carouge
Las Colinas Surgery Center / Irving
Trident Medical Center / Charleston Hopital de la Tour / Meyrin/Geneve
HCA 2003 Annual Report
12
13. 1 2 3
HCA Board of Directors
C. Michael Armstrong
1
Chairman, Comcast Corporation
4 5 6
Magdalena H. Averhoff, M.D.
2
Practicing Physician
Jack O. Bovender, Jr.
3
Chairman and Chief Executive Officer, HCA
Richard M. Bracken
4
President and Chief Operating Officer, HCA
Martin Feldstein
5
Professor of Economics, Harvard University
President and CEO, National Bureau of
Economic Research
Thomas F. Frist, Jr., M.D. 7 8 9
6
Chairman Emeritus, HCA
Frederick W. Gluck
7
Retired Vice Chairman, Bechtel Group, Inc.
Retired Managing Director, McKinsey & Company, Inc.
Glenda A. Hatchett
8
Host of Syndicated Television
Court Show, “Judge Hatchett”
Retired Chief Judge, Fulton County Juvenile Court
Charles O. Holliday, Jr.
9
Chairman and Chief Executive Officer, DuPont
T. Michael Long 10 11 12
10
Partner, Brown Brothers Harriman & Co.
John H. McArthur
11
Retired Dean, Harvard University Graduate
School of Business Administration
Kent C. Nelson
12
Retired Chairman and Chief Executive Officer,
United Parcel Service
Frank S. Royal, M.D.
13
Practicing Physician
Harold T. Shapiro
14
13 14
President Emeritus, Princeton University
HCA 2003 Annual Report
13
14. HCA Inc. Selected Financial Data as of and for the Years Ended December 31
(Dollars in millions, except per share amounts)
2003 2002 2001 2000 1999
Summary of Operations:
Revenues $ 21,808 $ 19,729 $ 17,953 $ 16,670 $ 16,657
Salaries and benefits 8,682 7,952 7,279 6,639 6,694
Supplies 3,522 3,158 2,860 2,640 2,645
Other operating expenses 3,676 3,341 3,238 3,208 3,306
Provision for doubtful accounts 2,207 1,581 1,376 1,255 1,269
(Gains) losses on sales of investment securities (1) 2 (63) (123) (55)
Equity in earnings of affiliates (199) (206) (158) (126) (90)
Depreciation and amortization 1,112 1,010 1,048 1,033 1,094
Interest expense 491 446 536 559 471
Settlement with government agencies (41) 603 262 840 —
Gains on sales of facilities (85) (6) (131) (34) (297)
Impairment of investment securities — 168 — — —
Impairment of long-lived assets 130 19 17 117 220
Restructuring of operations and
investigation related costs 8 58 65 62 116
Loss on retirement of debt — — 28 — —
19,502 18,126 16,357 16,070 15,373
Income before minority interests
and income taxes 2,306 1,603 1,596 600 1,284
Minority interests in earnings of
consolidated entities 150 148 119 84 57
Income before income taxes 2,156 1,455 1,477 516 1,227
Provision for income taxes 824 622 591 297 570
Reported net income 1,332 833 886 219 657
Goodwill amortization, net of income taxes — — 69 73 83
Adjusted net income $ 1,332 $ 833 $ 955 $ 292 $ 740
Basic earnings per share:
Reported net income $ 2.66 $ 1.63 $ 1.69 $ 0.39 $ 1.12
Goodwill amortization, net of income taxes — — 0.13 0.13 0.15
Adjusted net income $ 2.66 $ 1.63 $ 1.82 $ 0.52 $ 1.27
Diluted earnings per share:
Reported net income $ 2.61 $ 1.59 $ 1.65 $ 0.39 $ 1.11
Goodwill amortization, net of income taxes — — 0.13 0.13 0.15
Adjusted net income $ 2.61 $ 1.59 $ 1.78 $ 0.52 $ 1.26
Shares used in computing earnings
per share (in thousands):
Basic earnings per share 501,799 511,824 524,112 555,553 585,216
Diluted earnings per share 510,874 525,219 538,177 567,685 591,029
Cash dividends per common share $ 0.08 $ 0.08 $ 0.08 $ 0.08 $ 0.08
HCA 2003 Annual Report
14
15. (Dollars in millions, except per share amounts)
2003 2002 2001 2000 1999
Financial Position:
Assets $ 21,063 $ 18,741 $ 17,730 $ 17,568 $ 16,885
Working capital 1,654 766 957 312 480
Long-term debt, including amounts
due within one year 8,707 6,943 7,360 6,752 6,444
Minority interests in equity of
consolidated entities 680 611 563 572 763
Company-obligated mandatorily
redeemable securities of affiliate
holding solely Company securities — — 400 — —
Forward purchase contracts and put options — — — 769 —
Stockholders’ equity 6,209 5,702 4,762 4,405 5,617
Cash Flow Data:
Cash provided by operating activities $ 2,166 $ 2,750 $ 1,413 $ 1,547 $ 1,223
Cash provided by (used in) investing activities (2,862) (1,740) (1,300) (1,087) 925
Cash provided by (used in) financing activities 650 (934) (342) (336) (2,255)
Operating Data:
Number of hospitals at end of period(a) 184 173 178 187 195
Number of freestanding outpatient surgical
centers at end of period(b) 79 74 76 75 80
Number of licensed beds at end of period(c) 42,108 39,932 40,112 41,009 42,484
Weighted average licensed beds(d) 41,568 39,985 40,645 41,659 46,291
Admissions(e) 1,635,200 1,582,800 1,564,100 1,553,500 1,625,400
Equivalent admissions(f) 2,405,400 2,339,400 2,311,700 2,300,800 2,425,100
Average length of stay (days)(g) 5.0 5.0 4.9 4.9 4.9
Average daily census(h) 22,234 21,509 21,160 20,952 22,002
Occupancy(i) 54% 54% 52% 50% 48%
Emergency room visits(j) 5,130,500 4,802,800 4,676,800 4,534,400 4,765,900
Outpatient surgeries(k) 814,300 809,900 804,300 823,500 886,700
Inpatient surgeries(l) 528,600 518,100 507,800 486,600 485,900
(a) Excludes seven facilities in 2003, six facilities in 2002, six facilities in 2001, nine facilities in 2000 and 12 facilities in 1999 that are not consolidated (accounted
for using the equity method) for financial reporting purposes.
(b) Excludes four facilities in 2003, four facilities in 2002, three facilities in 2001, three in 2000 and three facilities in 1999 that are not consolidated (accounted
for using the equity method) for financial reporting purposes.
(c) Licensed beds are those beds for which a facility has been granted approval to operate from the applicable state licensing agency.
(d) Weighted average licensed beds represents the average number of licensed beds, weighted based on periods owned.
(e) Represents the total number of patients admitted to HCA’s hospitals and is used by management and certain investors as a general measure of inpatient volume.
(f) Equivalent admissions are used by management and certain investors as a general measure of combined inpatient and outpatient volume. Equivalent admissions
are computed by multiplying admissions (inpatient volume) by the sum of gross inpatient revenue and gross outpatient revenue and then dividing the resulting
amount by gross inpatient revenue. The equivalent admissions computation “equates” outpatient revenue to the volume measure (admissions) used to measure
inpatient volume, resulting in a general measure of combined inpatient and outpatient volume.
(g) Represents the average number of days admitted patients stay in HCA’s hospitals.
(h) Represents the average number of patients in HCA’s hospital beds each day.
(i) Represents the percentage of hospital licensed beds occupied by patients. Both average daily census and occupancy rate provide measures of the utilization of
inpatient rooms.
(j) Represents the number of patients treated in the Company’s emergency rooms.
(k) Represents the number of surgeries performed on patients who were not admitted to the Company’s hospitals. Pain management and endoscopy procedures are
not included in outpatient surgeries.
(l) Represents the number of surgeries performed on patients who have been admitted to the Company’s hospitals. Pain management and endoscopy procedures are
not included in inpatient surgeries.
HCA 2003 Annual Report
15
16. HCA Inc. Management’s Discussion and Analysis of Financial Condition and Results of Operations
The selected financial data and the accompanying consolidated financial statements present certain information
with respect to the financial position, results of operations and cash flows of HCA Inc. which should be read in
conjunction with the following discussion and analysis. The terms “HCA” or the “Company,” as used herein, refer
to HCA Inc. and its affiliates unless otherwise stated or indicated by context. The term “affiliates” means direct and
indirect subsidiaries of HCA Inc. and partnerships and joint ventures in which such subsidiaries are partners.
Forward-Looking Statements
This annual report includes certain disclosures which contain “forward-looking statements.” Forward-looking
statements include all statements that do not relate solely to historical or current facts, and can be identified by the
use of words like “may,” “believe,” “will,” “expect,” “project,” “estimate,” “anticipate,” “plan,” “initiative” or
“continue.” These forward-looking statements are based on the current plans and expectations of HCA and are
subject to a number of known and unknown uncertainties and risks, many of which are beyond HCA’s control, that
could significantly affect current plans and expectations and HCA’s future financial position and results of
operations. These factors include, but are not limited to, (i) the highly competitive nature of the health care business,
(ii) the efforts of insurers, health care providers and others to contain health care costs, (iii) possible changes in the
Medicare and Medicaid programs that may impact reimbursements to health care providers and insurers, (iv) the
ability to achieve operating and financial targets, achieve expected levels of patient volumes and control the costs
of providing services, (v) increases in the amount and risk of collectibility of uninsured accounts and deductibles
and copay amounts for insured accounts, (vi) the ability to attract and retain qualified management and personnel,
including affiliated physicians, nurses and medical support personnel, (vii) potential liabilities and other claims that
may be asserted against HCA, (viii) fluctuations in the market value of HCA’s common stock, (ix) changes in
accounting practices, (x) changes in general economic conditions, (xi) future divestitures which may result in
additional charges, (xii) changes in revenue mix and the ability to enter into and renew managed care provider
arrangements on acceptable terms, (xiii) the availability and terms of capital to fund the expansion of the
Company’s business, (xiv) changes in business strategy or development plans, (xv) delays in receiving payments for
services provided, (xvi) the possible enactment of Federal or state health care reform, (xvii) the outcome of pending
and any future tax audits and litigation associated with HCA’s tax positions, (xviii) the outcome of HCA’s continuing
efforts to monitor, maintain and comply with appropriate laws, regulations, policies and procedures and HCA’s
corporate integrity agreement with the government, (xix) changes in Federal, state or local regulations affecting the
health care industry, (xx) the impact of the charity care and self-pay discounting policy changes, (xxi) the ability
to successfully integrate the operations of Health Midwest, (xxii) the ability to develop and implement the payroll
and human resources information systems within the expected time and cost projections and, upon implementation,
to realize the expected benefits and efficiencies, and (xxiii) other risk factors described in this annual report. As a
consequence, current plans, anticipated actions and future financial position and results may differ from those
expressed in any forward-looking statements made by or on behalf of HCA. You are cautioned not to unduly rely
on such forward-looking statements when evaluating the information presented in this report.
2003 Operations Summary
The general economic environment for the general, acute care hospital industry during 2003 was negatively
impacted by the following trends: a reduction in the growth rate of inpatient admissions, increasing competition
from specialty facilities for cardiac, orthopedic and outpatient surgery services, and rising levels of uninsured and
patient due accounts, and the resulting increase in the provision for doubtful accounts.
During 2003, same facility admissions increased 0.6%, compared to 2.5% and 2.7% increases attained during
2002 and 2001, respectively. Same facility outpatient surgeries declined 3.0% during 2003, compared to an increase
of 2.2% in 2002 and a decrease of 1.2% in 2001. The provision for doubtful accounts increased to 10.1% of revenues
in 2003 from 8.0% and 7.7% of revenues for 2002 and 2001, respectively. The difference between 10.1% and 8.0%
of 2003 revenues is $462 million. Management expects these negative volume and bad debt trends to remain
significant challenges for HCA in 2004.
During 2003, HCA was able to manage salaries and benefits and other operating expenses effectively and
adjustments were made to react timely to the volume trends. Salaries and benefits were reduced to 39.8% of revenues
in 2003 compared to 40.3% and 40.5% of revenues in 2002 and 2001, respectively. Other operating expenses were
reduced to 16.8% of revenues in 2003 compared to 16.9% and 18.1% of revenues in 2002 and 2001, respectively.
During 2003, the remaining aspects of the governmental investigations into HCA’s business practices that began
in 1997 were concluded. Over the past five years, HCA paid approximately $2 billion in settlement payments to the
HCA 2003 Annual Report
16
17. HCA Inc. Management’s Discussion and Analysis of Financial Condition and Results of Operations
applicable government agencies and for legal and investigation related costs. The investigations also demanded
significant time requirements for management and numerous employees over the past years. Management is pleased
that these investigations have been concluded.
While the Company has faced both operational and investigation related challenges during the past three years,
management believes that it is important to recognize that HCA has generated cash provided by operating activities
of $2.166 billion, $2.750 billion and $1.413 billion during 2003, 2002 and 2001, respectively.
Investigations and Settlement of Certain Government Claims
Commencing in 1997, HCA became aware it was the subject of governmental investigations and litigation
relating to its business practices. The governmental investigations included activities for certain entities for periods
prior to their acquisition by the Company and activities for certain entities that have been divested. As part of the
investigations, the United States intervened in a number of qui tam actions brought by private parties.
The investigations were concluded through a series of agreements executed in 2000 and 2003. In December
2000, HCA entered into a Plea Agreement with the Criminal Division of the Department of Justice (the “DOJ”) and
various U.S. Attorneys’ offices (the “Plea Agreement”) and a Civil and Administrative Settlement Agreement with
the Civil Division of the DOJ (the “Civil Agreement”). The agreements resolved all Federal criminal issues
outstanding against HCA and certain issues involving Federal civil claims by, or on behalf of, the government
against HCA relating to DRG coding, outpatient laboratory billing and home health issues. The civil issues that were
not covered by the Civil Agreement included claims related to physician relations, cost reports and wound care
issues. The Civil Agreement was approved by the Federal District Court of the District of Columbia in August 2001.
HCA paid the government $900 million (including accrued interest of $60 million), as provided by the Civil
Agreement and Plea Agreement, during 2001. In January 2001, HCA entered into an eight-year Corporate Integrity
Agreement (“CIA”) with the Office of Inspector General of the Department of Health and Human Services.
The remaining aspects of the investigations were resolved during 2003. In June 2003, HCA announced that the
Company and the Civil Division of the DOJ had signed agreements, documenting the understanding announced in
December 2002, whereby the United States would dismiss the various claims it had brought related to physician
relations, cost reports and wound care issues (the “DOJ Agreement”). The DOJ Agreement received court approval
in July 2003, and HCA paid the DOJ $641 million (including accrued interest of $10 million) during July 2003. The
DOJ Agreement does not affect qui tam cases in which the government has not intervened. HCA also finalized an
agreement with a negotiating team representing states that may have claims against the Company. Under this
agreement, HCA paid $17.7 million in July 2003 to state Medicaid agencies to resolve these claims. HCA also paid
$33 million for legal fees of the private parties. In connection with the DOJ Agreement, HCA recorded a pretax
charge of $603 million ($418 million after-tax) in the fourth quarter of 2002. The consolidated income statement
for the year ended December 31, 2003 includes a pretax favorable change in estimate of $41 million ($25 million
after-tax) related to Medicaid cost report balances for cost report years ended December 31, 1997 and prior.
During June 2003, HCA announced that the Company and the Centers for Medicare and Medicaid Services
(“CMS”) had signed an agreement, documenting the understanding announced in March 2002, to resolve all
Medicare cost report, home office cost statement and appeal issues between HCA and CMS (the “CMS Agreement”)
for cost report periods ended before August 1, 2001. As a result of the CMS Agreement, HCA paid CMS $250 million
in June 2003. HCA recorded a pretax charge of $260 million ($165 million after-tax), consisting of the accrual of
$250 million for the settlement payment and the write-off of $10 million of net Medicare cost report receivables.
This charge was recorded in the consolidated income statement for the year ended December 31, 2001.
During September 2003, HCA reached an understanding with attorneys representing shareholder groups to settle
class action securities lawsuits originally filed in 1997. Under the terms of the settlement, a $49.5 million settlement
fund has been established to pay class members based on their individual claims. HCA also reached an
understanding with its insurance carriers under which the insurers will pay the majority of the settlement amount.
Final approval of the settlement was granted by the court on February 4, 2004.
HCA remains the subject of a December 1997 formal order of investigation by the Securities and Exchange
Commission (the “SEC”). HCA understands that the investigation includes the anti-fraud, insider trading, periodic
reporting and internal accounting control provisions of the Federal securities laws.
If HCA was found to be in violation of Federal or state laws relating to Medicare, Medicaid or similar programs
or breach of the CIA, HCA could be subject to substantial monetary fines, civil and criminal penalties and/or
exclusion from participation in the Medicare and Medicaid programs. Any such sanctions or expenses could have
a material adverse effect on HCA’s financial position, results of operation and liquidity.
HCA 2003 Annual Report
17
18. HCA Inc. Management’s Discussion and Analysis of Financial Condition and Results of Operations
Business Strategy
HCA is committed to providing the communities it serves high quality, cost-effective, health care while
maintaining consistency with HCA’s ethics and compliance program, governmental regulations and guidelines, and
industry standards. As a part of this strategy, HCA’s management focuses on the following areas:
• Commitment to the care and improvement of human life: The foundation of HCA is built on putting patients
first and providing quality health care services in the communities it serves. HCA continues to increase efforts
and funding for the Company’s patient safety agenda. Management believes patient outcomes will increasingly
influence physician and patient choices concerning health care delivery.
• Commitment to ethics and compliance: HCA is committed to a corporate culture highlighted by the following
values — compassion, honesty, integrity, fairness, loyalty, respect and kindness. The Company’s comprehensive
ethics and compliance program articulates a set of values and behavioral standards to reinforce HCA’s dedication
to these values and to ensure integrity.
• Focus on core communities: HCA strives to maintain market-leading positions in large, growing urban and
suburban communities, primarily in the Southern and Western regions of the United States.
• Becoming the health care employer of choice: HCA uses a number of industry leading practices to help ensure
its hospitals are the health care employer of choice in their communities. The Company’s labor initiatives provide
strategies to the hospitals for recruiting, compensation and productivity, and include various leadership and
career development programs. The Company also maintains an internal contract labor agency to provide
improved quality and reduce costs.
• Continuing to strive for operational excellence: The Company’s focus on operational excellence includes a group
purchasing organization that achieves pricing efficiencies in purchasing and supply contracts. HCA also uses a
shared services model to process revenue and accounts receivable through ten regional patient accounting
services centers. In a natural progression of the Company’s ongoing strategy, HCA is increasing focus on
operating outpatient services with improved accessibility and more convenient service for patients and increased
predictability and efficiency for physicians. As part of this focus, HCA may buy or build outpatient facilities to
improve its market presence.
• Allocating capital to strategically complement its operational strategy and enhance stockholder value: HCA’s
capital spending is intended to increase bed capacity, provide new or expanded services in existing facilities,
maintain or replace equipment and renovate existing facilities or construct replacement facilities. The Company
also selectively evaluates acquisitions that may complement its strategies in existing or new markets. Capital
may also be allocated to take advantage of opportunities such as repayment of indebtedness, stock repurchases
and payment of dividends. In 2004, HCA’s Board of Directors approved an increase in its quarterly dividend from
$0.02 per share to $0.13 per share.
Critical Accounting Policies and Estimates
The preparation of HCA’s consolidated financial statements requires management to make estimates and
assumptions that affect the reported amounts of assets and liabilities, the disclosure of contingent liabilities and
the reported amounts of revenues and expenses. HCA’s management base their estimates on historical experience
and various other assumptions that they believe are reasonable under the circumstances. Management evaluates
its estimates on an ongoing basis and makes changes to the estimates and related disclosures as experience
develops or new information becomes known. Actual results may differ from these estimates under different
assumptions or conditions.
Management believes that the following critical accounting policies affect its more significant judgments and
estimates used in the preparation of its consolidated financial statements.
HCA 2003 Annual Report
18
19. HCA Inc. Management’s Discussion and Analysis of Financial Condition and Results of Operations
Revenues
Revenues are recorded during the period the health care services are provided, based upon the estimated amounts
due from payers. Estimates of contractual allowances under managed care health plans are based upon the payment
terms specified in the related contractual agreements. Laws and regulations governing the Medicare and Medicaid
programs are complex and subject to interpretation. The estimated reimbursement amounts are made on a payer-
specific basis and are recorded based on the best information available regarding management’s interpretation of
the applicable laws, regulations and contract terms. Management continually reviews the contractual estimation
process to consider and incorporate updates to laws and regulations and the frequent changes in managed care
contractual terms that result from contract renegotiations and renewals. Management has invested significant
resources to refine and improve the information system data used to make these contractual estimates and to
develop a standardized calculation process and train employees.
HCA does not pursue collection of amounts related to patients that meet the Company’s guidelines to qualify as
charity care; therefore, they are not reported in revenues. The revenues associated with uninsured patients that do
not meet the Company’s guidelines to qualify as charity care have generally been reported in revenues at gross
charges. During 2003, the Company announced that patients treated at an HCA wholly-owned hospital for
nonelective care who have income at or below 200% of the Federal poverty level are eligible for charity care, a
standard HCA estimates that 70% of its hospitals were previously using. The Federal poverty level is established by
the Federal government and is based on income and family size. On October 1, 2003, HCA began implementing a
sliding scale of discounts for uninsured patients, treated at HCA wholly-owned hospitals for nonelective care, with
income between 200% and 400% of the Federal poverty level.
Due to the complexities involved in these estimations of revenues earned, the health care services authorized
and provided and related reimbursement are often subject to interpretations that could result in payments that are
different from our estimates.
Provision for Doubtful Accounts and the Allowance for Doubtful Accounts
The collection of outstanding receivables from Medicare, managed care payers, other third-party payers and
patients is HCA’s primary source of cash and is critical to the Company’s operating performance. The primary
collection risks relate to the uninsured patient accounts and patient accounts for which the primary insurance
carrier has paid the amounts covered by the applicable agreement, but patient responsibility amounts (deductibles
and copayments) remain outstanding. The provision for doubtful accounts and the allowance for doubtful accounts
relate primarily to amounts due directly from patients. Because HCA does not pursue collection of amounts related
to patients that meet the Company’s guidelines to qualify as charity care, they are not reported in revenues and do
not have an impact on the provision for doubtful accounts. HCA expects the revised charity care and self-pay
discounting policy changes will result in reductions to both revenues and the provision for doubtful accounts in
future periods.
The amount of the provision for doubtful accounts is based upon management’s assessment of historical write-
offs and expected net collections, business and economic conditions, trends in Federal and state governmental and
private employer health care coverage and other collection indicators. Management relies on the results of detailed
reviews of historical write-offs and recoveries at facilities that represent a majority of HCA’s revenues and accounts
receivable (the “hindsight analysis”) as a primary source of information in estimating the collectability of HCA’s
accounts receivable. Prior to the third quarter of 2003, the Company performed the hindsight analysis on an annual
basis. The results of the annual hindsight analysis that was completed during the second quarter of 2003 indicated
an increasing proportion of accounts receivable being comprised of uninsured accounts and the collectability of this
category of accounts had deteriorated. Beginning with the third quarter of 2003, HCA began performing a quarterly,
rolling twelve-month hindsight analysis to enable a more timely reaction to trends affecting the collectability of
the accounts receivable. At December 31, 2003, HCA’s allowance for doubtful accounts, as a percentage of patient
due accounts, was approximately 88%. For the year ended December 31, 2003, the provision for doubtful accounts
increased to 10.1% of revenues compared to 8.0% of revenues in 2002. Management does not expect the provision
for doubtful accounts, as a percentage of revenues, to decline from 2003 levels during 2004, based upon the revenue
and trends at December 31, 2003. Adverse changes in general economic conditions, business office operations, payer
mix, or trends in Federal or state governmental and private employer health care coverage could affect HCA’s
collection of accounts receivable, cash flows and results of operations.
HCA 2003 Annual Report
19
20. HCA Inc. Management’s Discussion and Analysis of Financial Condition and Results of Operations
Investments of Insurance Subsidiary — Other-than-temporary Impairment Considerations
HCA’s wholly-owned insurance subsidiary holds debt and equity security investments having an aggregate fair
value of $2.065 billion at December 31, 2003. The fair value of the investment securities is generally based on
quoted market prices. The investment securities are held for the purpose of providing the funding source to pay
professional and general liability claims covered by the insurance subsidiary. Management’s assessment each
quarter of whether a decline in fair value is temporary or other-than-temporary involves multiple judgment calls,
often involves estimating the outcome of future events, and requires a significant level of professional judgment in
determining whether factors exist that indicate an impairment has occurred. HCA evaluates, among other things,
the financial position and near term prospects of the issuer, conditions in the issuer’s industry, liquidity of the
investment, changes in the amount or timing of expected future cash flows from the investment, and recent
downgrades of the issuer by a rating agency to determine if, and when, a decline in the fair value of an investment
below amortized cost is considered other-than-temporary. The length of time and extent to which the fair value of
the investment is less than amortized cost and HCA’s ability and intent to retain the investment to allow for any
anticipated recovery of the investment’s fair value are important components of management’s investment
securities evaluation process. During 2002, HCA recognized a $168 million other-than-temporary impairment
charge related, primarily, to the insurance subsidiary’s equity investment securities. The equity investments market
experienced generally, steady increases during 2003 and at December 31, 2003, the insurance subsidiary’s
investment security portfolio had unrealized gains of $212 million and unrealized losses of $4 million.
Professional Liability Insurance Claims
HCA, along with virtually all health care providers, operates in an environment with professional liability risks.
A substantial portion of HCA’s professional liability risks is insured through a wholly-owned insurance subsidiary.
Reserves for professional liability risks were $1.624 billion and $1.551 billion at December 31, 2003 and December
31, 2002, respectively. Obligations covered by reinsurance contracts remain on the balance sheet as the subsidiary
remains liable to the extent that reinsurers do not meet their obligations. Reserves for professional liability risks
(net of $147 million and $265 million receivable under reinsurance contracts at December 31, 2003 and 2002,
respectively) were $1.477 billion and $1.286 billion at December 31, 2003 and 2002, respectively. Reserves and
provisions for professional liability risks are based upon actuarially determined estimates. The independent actuaries
estimated reserve ranges, net of amounts receivable under reinsurance contracts, were $1.255 billion to $1.515
billion at December 31, 2003 and $1.022 billion to $1.361 billion at December 31, 2002. Reserves for professional
liability risks represent the estimated ultimate cost of all reported and unreported losses incurred through the
respective consolidated balance sheet dates. The reserves are estimated using individual case-basis valuations and
actuarial analyses. Those estimates are subject to the effects of trends in loss severity and frequency. The estimates
are continually reviewed and adjustments are recorded as experience develops or new information becomes known.
The reserves for professional liability risks cover approximately 3,900 and 4,000 individual claims at December
31, 2003 and 2002, respectively, and estimates for potential unreported claims. The time period required to resolve
these claims can vary depending upon the jurisdiction and whether the claim is settled or litigated. The estimation
of the timing of payments beyond a year can vary significantly. Changes to the estimated reserve amounts are
included in current operating results. Due to the considerable variability that is inherent in such estimates, there
can be no assurance that the ultimate liability will not exceed management’s estimates.
Results of Operations
Revenue/Volume Trends
HCA’s revenues depend upon inpatient occupancy levels, the ancillary services and therapy programs ordered
by physicians and provided to patients, the volume of outpatient procedures and the charge and negotiated payment
rates for such services.
Admissions related to Medicare, managed care and other discounted plans and Medicaid and self-pay for the
years ended December 31, 2003, 2002 and 2001 are set forth below. Certain prior year amounts have been
reclassified to conform to the 2003 presentation.
HCA 2003 Annual Report
20