Benchmark Survey VAT 2013
•
0 j'aime•839 vues

This document summarizes the key findings of KPMG's 2013 Benchmark Survey on VAT/GST. Some of the main points include: - 58% of respondents said that VAT/GST has a negative cash impact on their business, up from 51% in 2012. - 83% of respondents do not have specific VAT/GST performance goals that are visible to their CFO. - 59% of respondents do not have agreed upon metrics between the Head of Tax and Head of VAT/GST to measure VAT/GST effectiveness. - The top metrics used to measure VAT/GST team effectiveness are timely tax return submission and minimization of interest/penalties.

Recommandé
Contenu connexe
Tendances
Tendances (19)
Similaire à Benchmark Survey VAT 2013
Similaire à Benchmark Survey VAT 2013 (20)
Plus de Fiscalito punto com
Plus de Fiscalito punto com (20)
Dernier
Dernier (20)
Benchmark Survey VAT 2013
- 1. KPMG GLOBAL INDIRECT TAX SERVICES The 2013 Benchmark Survey onVAT/GST kpmg.com/indirecttax KPMG INTERNATIONAL
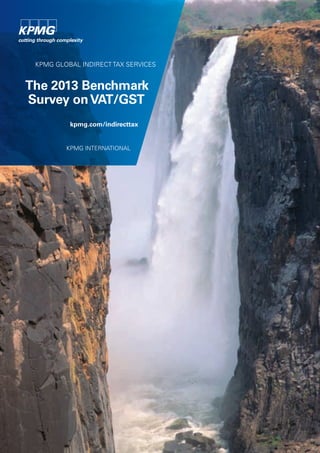
- 2. 2 | The 2013 Benchmark Survey on VAT/GST About our cover A Benchmark:Victoria Falls is a waterfall in southern Africa on the Zambezi River at the border of Zambia and Zimbabwe.This image is a side view through Batoka Gorge.The falls are claimed to be the largest in the world.This claim is based on a width of 1,708 meters (5,604 ft) and height of 108 meters (354 ft), forming the largest sheet of falling water in the world. © 2013 KPMG International Cooperative (“KPMG International”), a Swiss entity. Member firms of the KPMG network of independent firms are affiliated with KPMG International. KPMG International provides no client services. All rights reserved.
- 3. The 2013 Benchmark Survey on VAT/GST | 3 Table of Contents About the 2013 Benchmark Survey on VAT/GST 5 Executive summary 6 Key VAT/GST metrics 7 Structure and organization 11 Accountability for VAT/GST in the business 17 VAT/GST policy design & implementation 19 VAT/GST reporting 24 Technology and the future 26 Find out more 29 © 2013 KPMG International Cooperative (“KPMG International”), a Swiss entity. Member firms of the KPMG network of independent firms are affiliated with KPMG International. KPMG International provides no client services. All rights reserved.
- 4. 4 | The 2013 Benchmark Survey on VAT/GST © 2013 KPMG International Cooperative (“KPMG International”), a Swiss entity. Member firms of the KPMG network of independent firms are affiliated with KPMG International. KPMG International provides no client services. All rights reserved.
- 5. The 2013 Benchmark Survey on VAT/GST | 5 About the 2013 Benchmark Survey onVAT/GST Over the last two decades, KPMG’s Global IndirectTax Services practice has seen a significant increase in the number of countries and jurisdictions using indirect tax to fund government. According to the Organisation for Economic Cooperation and Development (OECD),Value AddedTax and Goods and ServicesTax (VAT/GST) are now imposed in over 150 countries, including 33 out of 34 OECD member countries.The US is the lone exemption but even it has subnational indirect consumption taxes at average rates of approximately 8.6 percent. And whileVAT/GST is a relatively new taxation method, they are clearly the way of the future. The OECD observes that consumption taxes now account for 31 percent of all revenue collected by governments of OECD member countries and 20 percent of taxation revenues worldwide.VAT/GST is now one of the most important sources of revenue for governments, second to social security contributions and personal income taxes, and well ahead of corporate income taxes, specific consumption taxes and property taxes as a source of revenue. As the world’s governments seek new ways to generate revenues,VAT/GST rates will increase, more jurisdictions will adopt them and the scope of many already in place will broaden. In this decade, KPMG’s Global IndirectTax Services practice expects indirect tax reforms to continue to develop in China, India and countries in the Middle East. In some countries, such as China, there are already extremely short indirect tax reform timeframes under which businesses are expected to adapt their systems and achieve proper compliance. As the global shift toward indirect taxation continues, businesses will encounter more challenges in achieving full compliance and more pressure on their resources and cash flow. It is critical for businesses to objectively assess how efficient and effective they are at managing what is rapidly becoming one of the most important and riskiest of global tax obligations. Sounds sensible, doesn’t it?That’s where KPMG’s Benchmark Survey onVAT/GST (the survey) comes in. KPMG’s Global IndirectTax Services practice is delighted to release the 2013 edition, offering insights into emerging best practices, benchmarks and geographic or other variances. KPMG’s Global IndirectTax Services practice invites you to read the survey and encourages you to reflect on what it means for your business by asking yourself the following questions: • How is my business managing its VAT/GST obligations now? • How does it compare to the survey results? • What would I like to change? • How can I build the case for change? • How will I be able to measure the ’value-add’? Profile of respondents • There are 249 respondents from 24 countries. • Thirty-seven percent are responsible for VAT/GST globally, regionally or at the country level. Twenty-one percent are the heads of tax. • Thirty-three percent of respondents have an annual turnover greater than 20 billion (bn) US dollars (USD), hereafter referred to as larger businesses. Eighty percent of respondents have annual turnover in excess of USD10bn. • Respondents overall are from a broad range of industries including 12 percent from the banking sector. © 2013 KPMG International Cooperative (“KPMG International”), a Swiss entity. Member firms of the KPMG network of independent firms are affiliated with KPMG International. KPMG International provides no client services. All rights reserved.
- 6. 6 | The 2013 Benchmark Survey on VAT/GST Executive summary Many economies around the world continue to struggle with growth – often sluggish at best. At the same time, there is ever-increasing focus over the tax paid by some of the biggest businesses in the world; a debate that is at times emotionally charged and tends to overlook the other consumption-based taxes that flow from the goods and services supplied, such asVAT/GST. Further, tax authorities all over the world are showing much greater interest in evaluating how a business’ tax affairs are governed. For example, current tax authority risk assessment programs in Australia, the Netherlands and the UK explicitly address the strength of a business’ tax governance policies. Specifically, in the UK, senior accounting officers of large businesses must annually certify that their tax systems and controls are adequate. Against this backdrop of continuous challenge – both economically and fiscally – the survey shows: • CFO’s continue to view the effectiveness of their tax department through the lens of corporate tax with little or no focus on VAT/GST. Eighty-three percent of all respondents still have to establishVAT/GST performance goals that are visible and meaningful to the CFO. Now with increasing government focus on taxes calculated on consumption rather than profits, CFOs would be wise to think more objectively about how their businesses are managing this real-time tax. • There is a significant shift towards tax departments taking ownership or accountability forVAT/GST globally. In 55 percent of all respondents (rising to over 70 percent in the case of larger businesses), the tax department is now accountable for VAT/GST. Having a clear understanding of who is accountable for VAT/GST in a business is the starting point for effectiveVAT/GST management. However, having the title without the appropriate infrastructure in terms of people, process and technology could give a false sense of security. • Sixty-four percent of businesses do not have a Global Head ofVAT/GST and the survey shows there has been no obvious, commensurate increase in headcount either at a global, regional or local level in the last year. Alarmingly, 21 percent of businesses do not have any full-time VAT/GST specialists. • There is greater evidence of quality VAT/GST management in Europe, the Middle East and Africa (EMA). In Asia Pacific (ASPAC) and Latin America (LATAM) businesses should be concerned about how compliance risks are being managed.This is particularly important in these regions given the complexity of theirVAT/GST regimes. • Outside of EMA, more than 50 percent of respondents have not identified the keyVAT/GST risks in their business. For those businesses that have identified the key risks and have processes and controls in place to manage those risks, 16 to 23 percent of respondents across all regions rate their ability to manage the risks as poor. • Given the scale of VAT/GST throughput being handled by global businesses, significant opportunities are being missed to manage risk more efficiently and effectively, improve cash flow and reduce bottom-line cost. • Businesses with effective VAT/GST management are still in the minority. There is a very long way to go before the resources, processes and technology strategies are embedded and accountabilities set to adequately manage the globalVAT/GST challenges. Given the rapid pace of change – expected to continue through 2013 and beyond – even the more advanced businesses are simply running to stand still, while others are falling further behind. Two-thirdsof respondentsinEMA andone-third inthe restofthe worldbelieve thatVAT/GSTrates will increaseinthe next 3 years. © 2013 KPMG International Cooperative (“KPMG International”), a Swiss entity. Member firms of the KPMG network of independent firms are affiliated with KPMG International. KPMG International provides no client services. All rights reserved.
- 7. The 2013 Benchmark Survey on VAT/GST | 7 Key VAT/GST metrics 58 percent say VAT/GST has a negative cash impact on their business. Respondents were asked a series of questions to build a picture of how VAT/GST affects their business and to understand what metrics are in place to measure their performance. What is the cash impact of VAT/GST on your business? This year, 58 percent of all respondents say that VAT/GST has a negative cash impact on their business, up from 51 percent in 2012. Nineteen percent say it has a positive impact, down from 23 percent in 2012. This movement is a strong indicator of the impact that VAT/GST can have on a business’ working capital and implies that more are feeling the strain. For many businesses, large or small, VAT/GST is the third largest cash flow item after sales and cost of sales, but determining the true impact that VAT/GST has on a business’ cash position is complex. Often businesses focus solely on the net VAT/GST payment to, or receivable from, the tax authority. But this ignores the significant amounts of VAT/GST that flow in and out of a business daily (e.g. on customer receipts and payments to suppliers). Cash positive Neutral Cash negative Do not know 2013 Overall 2013 Turnover above USD20bn 19% 22% 20% 16% 58% 59% 4% 4% Source: KPMG International, 2013. Figure 1: What do you believe is the cash impact of VAT/GST on your business? © 2013 KPMG International Cooperative (“KPMG International”), a Swiss entity. Member firms of the KPMG network of independent firms are affiliated with KPMG International. KPMG International provides no client services. All rights reserved.
- 8. 8 | The 2013 Benchmark Survey on VAT/GST Which are the top three metrics used by the CFO to measure the overall effectiveness of the tax department? The three most important metrics that the CFO uses to measure the tax department’s effectiveness have not changed since 2012 and show no difference between all respondents and larger businesses: • the effective tax rate (overall 31 percent; larger businesses 30 percent) • timely and accurate submission of tax returns (overall 22 percent; larger businesses 18 percent) • minimization of interest and penalties (overall 17 percent; larger businesses 15 percent). VAT/GST performance goals rank 7th out of 8 in terms of their overall importance; however, larger businesses saw a small, but notable increase since 2012, ranking VAT/GST performance goals 5th out of 8 this year (versus 7th out of 8 in 2012). Clearly a lot still needs to be done to get the importance ofVAT/GST management on the CFO’s radar. 83 percent of respondents do not have specific VAT/GST performance goals visible to their CFO. 2013 Overall 2013 Turnover above USD20bn Source: KPMG International, 2013. Figure 2: Which are the top three metrics in order of importance, used by the CFO to measure the overall effectiveness of your tax department? 31% 30% 22% 18% 17% 15% 8% 12% 7% 7% 7% 6% 6% 8% 2% 2% 0% 5% 10% 15% 20% 25% 30% 35% OtherVAT/GST performance goals Cash tax rate Risk adjusted tax savings Relationships with the tax authorities Minimization of interest and penalties Timely and accurate submission of tax returns Effective tax rate © 2013 KPMG International Cooperative (“KPMG International”), a Swiss entity. Member firms of the KPMG network of independent firms are affiliated with KPMG International. KPMG International provides no client services. All rights reserved.
- 9. The 2013 Benchmark Survey on VAT/GST | 9 Are there specific metrics agreed upon between the Head ofTax and the Head of VAT/GST to measure the effectiveness of the VAT/GST team? Fifty-nine percent of respondents overall in 2013 (down from 69 percent in 2012) do not have specificVAT/GST metrics agreed upon with their Head ofTax.While the size of business could indicate maturity in scope and usage of metrics, the survey again finds that the even larger businesses do not have specific metrics in place (51 percent in 2013 versus 50 percent in 2012). Yes No Source: KPMG International, 2013. Figure 3: Are there specific metrics agreed upon between the Head of Tax and the Head of VAT/GST to measure the effectiveness of the VAT/GST team? 41% 59% 49% 51% 2013 Turnover above USD20 bn2013 Overall © 2013 KPMG International Cooperative (“KPMG International”), a Swiss entity. Member firms of the KPMG network of independent firms are affiliated with KPMG International. KPMG International provides no client services. All rights reserved.
- 10. 10 | The 2013 Benchmark Survey on VAT/GST 2013 Overall 2013 Turnover above USD20bn Source: KPMG International, 2013. Figure 4: Of the metrics used to measure the effectiveness of the VAT/GST team, which are the top three in order of importance? 0% 5% 10% 15% 20% 25% 30% 35% OtherReduction in external adviser spend Reduction in VAT/GST payable on income Relationship with the tax authority Awareness of VAT/GST in the business VAT/GST cash flow Reduction in VAT/GST cost on expenditure Minimization of interest and penalties Timely and accurate submission of VAT/GST returns 31% 22% 16% 17% 11% 19% 11% 12% 11% 10% 7% 9% 5% 7% 3% 1% 4% 3% What are the top three metrics used by the Head of Tax to measure the overall effectiveness of the VAT/GST team? The three most important metrics for all respondents are: • timely and accurate submission of VAT/GST returns (31 percent) • minimization of interest and penalties (16 percent) • equal response forVAT/GST cash flow, awareness ofVAT/GST in the business and the reduction inVAT/ GST cost on expenditure (11 percent). In 2012,VAT/GST cash flow and reduction inVAT/GST cost on expenditure were second and third respectively. In 2013, larger businesses have a higher number interested in the reduction ofVAT/GST cost on expenditure. All metrics identified this year and last, show a clear preference from the CFO to the Head ofTax to get the basics right – compliance and cost/penalty minimization. However, with tax in general, andVAT/GST becoming more complex, businesses of all sizes will be challenged to ensure they are prepared to add value to the overall business through cash flow analysis and planning, together with cost reduction. © 2013 KPMG International Cooperative (“KPMG International”), a Swiss entity. Member firms of the KPMG network of independent firms are affiliated with KPMG International. KPMG International provides no client services. All rights reserved.
- 11. The 2013 Benchmark Survey on VAT/GST | 11 Structure and organization 64 percent of respondents do not have a Global Head of VAT/GST. Global and Regional Heads of VAT/GST This year, 34 percent of respondents have a Global Head of VAT/GST, almost flat from 35 percent in 2012. For those that have a Global Head of VAT/GST, 37 percent are located in the UK, followed by 17 percent in Germany, 12 percent in the US and 6 percent in Switzerland and Australia. Figure 5: Do you have a Global Head of VAT/GST (or equivalent title)? Yes No Do not know 2013 Overall 2013 Turnover above USD20bn 34% 2% 64% 45% 49% 6% Source: KPMG International, 2013. © 2013 KPMG International Cooperative (“KPMG International”), a Swiss entity. Member firms of the KPMG network of independent firms are affiliated with KPMG International. KPMG International provides no client services. All rights reserved.
- 12. 12 | The 2013 Benchmark Survey on VAT/GST Yes No Do not know 2013 Overall 2013 Turnover above USD20bn 40% 59% 1% 27% 0% 72% Source: KPMG International, 2013. Figure 6: Do you have Regional Heads of VAT/GST (or equivalent title)? Do you have Regional Heads of VAT/GST? Twenty-seven percent of respondents have Regional Heads ofVAT/GST.This rises to 40 percent for larger businesses. Regional focus appears to be on the rise. This is likely a reflection of the significant changes in VAT/GST rates in many countries and associated challenges and risks that need to be addressed. This year, for all respondents who have a Regional Head ofVAT/GST, 85 percent have a regional focus on EMA, 46 percent on North America, 40 percent on ASPAC and 32 percent LATAM. Relatively speaking, the larger businesses follow a similar pattern but they tend to have higher focus in North America (61 percent), ASPAC (45 percent) and LATAM (39 percent). EMA has the same response regardless of the size of business – representative of the relative maturity ofVAT/GST as both a tax and a specialty in this region. © 2013 KPMG International Cooperative (“KPMG International”), a Swiss entity. Member firms of the KPMG network of independent firms are affiliated with KPMG International. KPMG International provides no client services. All rights reserved.
- 13. The 2013 Benchmark Survey on VAT/GST | 13 21 percent of respondents do not have any full-time VAT/GST specialists – more than 50 percent have less than 10 worldwide. 0 1-10 11-20 21-30 31-40 41+ Do not know 2013 Overall 2013 Turnover above USD20bn 21% 8% 55% 54% 18% 2% 6% 2% 6% 0% 0% 10% 15% 1% Source: KPMG International, 2013. Figure 7: How many full-time equivalent VAT/GST specialists do you have in your business globally? Global VAT/GST resources The number of full-time equivalent employees focused onVAT/GST has not changed materially since 2012.This year, 21 percent of overall respondents (versus 26 percent in 2012) report having zero full-time equivalentVAT/ GST specialists; 6 percent of the larger businesses have in excess of 41 full- time equivalents. A small, but notable, 10 percent of all respondents do not know how many full-time equivalents they have, rising (surprisingly) to 15 percent for the larger businesses. The seniority of staff follows the classic pyramid structure with resources more heavily weighted at the staff level.There is no material difference in percentage split with the largest businesses. Indeed, the survey found again this year, thatVAT/GST is under-resourced all over the world.The exception is North America where being appropriately resourced comes in above under- resourced – 56 percent versus 44 percent respectively (see figure 8, next page). Majority of VAT/GST employees are at the staff level (62 percent); 27 percent management; 12 percent senior management. © 2013 KPMG International Cooperative (“KPMG International”), a Swiss entity. Member firms of the KPMG network of independent firms are affiliated with KPMG International. KPMG International provides no client services. All rights reserved.
- 14. 14 | The 2013 Benchmark Survey on VAT/GST Figure 8: Given the relative significance and risks of VAT/GST as compared with corporate taxes for your business, do you feel that the management of VAT/GST in your business globally is under-resourced, appropriately resourced or over-resourced (please indicate by region)? ASPAC EMA ASPAC 2013 Turnover abover USD20bnASPAC 2013 Overall ASPAC 2013 Turnover abover USD20bnEMEA 2013 Overall 40% 60% 54% 44% 54% 43% 3%2% 66% 34% 0%1% 0% 10% 20% 30% 40% 50% 60% 70% 0% 10% 20% 30% 40% 50% 60% 70% Source: KPMG International, 2013. LATAM North America LATAM 2013 Turnover abover USD20bnLATAM 2013 Overall North America 2013 Turnover abover USD20bnNorth America 2013 Overall 35% 64% 44% 56% 35% 65% 0%1% 61% 39% 0%1% 0% 10% 20% 30% 40% 50% 60% 70% 0% 10% 20% 30% 40% 50% 60% 70% Under-resourced Appropriately resourced Over-resourced © 2013 KPMG International Cooperative (“KPMG International”), a Swiss entity. Member firms of the KPMG network of independent firms are affiliated with KPMG International. KPMG International provides no client services. All rights reserved.
- 15. The 2013 Benchmark Survey on VAT/GST | 15 In which regions are your VAT/GST specialists located? The number ofVAT/GST specialists located in EMA is almost double the number in North America and significantly more than in ASPAC and LATAM. Larger businesses follow the same trend. Given the maturity of theVAT/GST regimes in EMA, and particularly in Europe, the deployment of more specialized resources in EMA is not at all surprising. Higher averageVAT/GST rates in Europe compared with other parts of the world, together with the geographic footprint of the respondents may also be a factor. Only 15 percent of resources are in ASPAC and 8 percent in LATAM. Given the complex and evolving nature ofVAT/GST regimes in those regions, it can only be expected that this delta will close over time. 49% 49% 2013 Overall 2013 Turnover above USD20bn EMA North AmericaASPAC LATAM 8% 8% 15% 14% 28% 28% Source: KPMG International, 2013. Figure 9: In which region(s) are your VAT/GST specialists located? © 2013 KPMG International Cooperative (“KPMG International”), a Swiss entity. Member firms of the KPMG network of independent firms are affiliated with KPMG International. KPMG International provides no client services. All rights reserved.
- 16. 16 | The 2013 Benchmark Survey on VAT/GST Time allocated to tasks covered by dedicated VAT/ GST resources Respondents say that the majority of their resources’ time is spent onVAT/ GST return preparation, followed by providing advice to the business and process, systems and technology. There was no difference in responses across size of business or compared to last year’s survey. Indeed the survey indicates that 42 percent of all time is spent on managing compliance (VAT/GST return preparation, process, systems and technology). Advisory and planning adds to just 34 percent, suggesting that the modern in-houseVAT/GST team is increasingly focused on the practical side of managing the tax, rather than value creation which is consistent with the metrics previously mentioned. 2013 Overall 2013 Turnover above USD20bn VAT/GST return preparation VAT/GST advisory Process, systems and technology Managing VAT/GST audits VAT/GST planning OtherInternal VAT/GST training and awareness 0% 5% 10% 15% 20% 25% 30% 35% 9% 7% 2% 2% 11% 12% 13% 13%14% 14% 23% 25% 28% 28% Note: Total may not sum to 100% due to rounding. Source: KPMG International, 2013. Figure 10: Please estimate the percentage of time allocated to each task undertaken by your VAT/ GST specialists? © 2013 KPMG International Cooperative (“KPMG International”), a Swiss entity. Member firms of the KPMG network of independent firms are affiliated with KPMG International. KPMG International provides no client services. All rights reserved.
- 17. The 2013 Benchmark Survey on VAT/GST | 17 Accountability for VAT/GST in the business The tax department is accountable for VAT/GST in 55 percent of respondents, rising to 71 percent for larger businesses. The survey also exploredVAT/GST governance practices, starting with who has accountability forVAT/GST. Clarity over this issue is at the very heart of effectiveVAT/GST management. Last year, 51 percent of respondents named the tax department as having overall accountability, while 38 percent named finance and accounting. For larger businesses, tax was accountable in 63 percent of cases and finance and accounting in 19 percent. This year, the survey shows an increasing trend for the tax department to take ownership or accountability for VAT/GST. In 55 percent of cases (and 71 percent for larger businesses) the tax department now has ownership. Interestingly, the number of respondents who were unclear on who had accountability dropped to 4 percent (2 percent for larger businesses). These results show that the tax department is increasingly being seen as the group accountable rather than as a mere service provider to finance and accounting.This is a reflection of two things. First, there is growing recognition that the complexity ofVAT/GST requires real expertise to manage it effectively. And second, the evolution of business from county by country controllership to centralization and standardization of finance processes. 2013 Overall 2013 Turnover above USD20bn Tax Finance & Accounting Other (e.g. Legal) Unclear 55% 71% 38% 22% 3% 5% 4% 2% Source: KPMG International, 2013. Figure 11: Who has ultimate accountability for VAT/GST in your business? © 2013 KPMG International Cooperative (“KPMG International”), a Swiss entity. Member firms of the KPMG network of independent firms are affiliated with KPMG International. KPMG International provides no client services. All rights reserved.
- 18. 18 | The 2013 Benchmark Survey on VAT/GST Only 1 in 8 businesses have a Global Head of VAT/GST that has visibility over VAT/GST returns prepared locally. Visibility of Global Head of VAT/GST In 2012, of those respondents who had a Global Head of VAT/GST, only 26 percent of them had visibility over VAT/GST returns prepared at a local/country level. Encouragingly, this year the percentage of Global Heads of VAT/GST who have such visibility has increased to 35 percent for all respondents, including larger businesses. Given the movements in visibility this year, it is assumed that businesses are investing in technology and other similar resources to allow for proper oversight and coordination.Yet, with the ever- changing complexities ofVAT/GST, the percentages are still low. Indeed, given that only 34 percent of respondents have a Global Head ofVAT/GST, of which only 35 percent of those have visibility overVAT/GST returns prepared.This suggests that there is still a long way to go to achieve effectiveVAT/GST management. 35% 35% 65% 65% 2013 Overall 2013 Turnover above USD20bn Yes No Source: KPMG International, 2013. Figure 12: Does the Global Head of VAT/GST (or equivalent title) have visibility over VAT/GST returns prepared locally? © 2013 KPMG International Cooperative (“KPMG International”), a Swiss entity. Member firms of the KPMG network of independent firms are affiliated with KPMG International. KPMG International provides no client services. All rights reserved.
- 19. The 2013 Benchmark Survey on VAT/GST | 19 VAT/GST policy design & implementation Outside of EMA, more than 50 percent of respondents have not identified the key VAT/GST risks in their business. Have you identified the key VAT/GST risks in ASPAC, EMA, LATAM and North America? Identifying the keyVAT/GST risks across the “order to cash, purchase to pay and record to report” process is essential to effectiveVAT/GST tax management. In ASPAC, LATAM and North America, an alarming number of respondents say they have not identified the risks or they simply do not know if they have done so. EMA is the exception with the majority of respondents saying they have identified the risks. Given the relative complexity of theVAT/GST regime outside EMA, this is a cause for concern. For those who have not identified keyVAT/GST risks, the reasons for not doing so relate to a lack of visibility and resources to do so, or no mandate from management. Source: KPMG International, 2013. Figure 13: Have you identified the key VAT/GST risks in the following regions? ASPAC 60% 48% 12% 22% 28% 30% EMA 70% 68% 8% 12% 24% 18% 0% 10% 20% 30% 40% 50% 60% 70% 80% 0% 10% 20% 30% 40% 50% 60% 70% 80% 2013 Overall regional responses 2013 Turnover above USD20bn Do not knowNoYesDo not knowNoYes See next page for other regions © 2013 KPMG International Cooperative (“KPMG International”), a Swiss entity. Member firms of the KPMG network of independent firms are affiliated with KPMG International. KPMG International provides no client services. All rights reserved.
- 20. 20 | The 2013 Benchmark Survey on VAT/GST Source: KPMG International, 2013. Figure 13 continued: Have you identified the key VAT/ GST risks in the following regions? LATAM 44% 33% 9% 27% 47% 40% 0% 10% 20% 30% 40% 50% 60% 70% North America 44% 52% 8% 22% 40% 34% 0% 10% 20% 30% 40% 50% 60% 70% 2013 Overall regional responses 2013 Turnover above USD20bn Do not knowNoYesDo not knowNoYes © 2013 KPMG International Cooperative (“KPMG International”), a Swiss entity. Member firms of the KPMG network of independent firms are affiliated with KPMG International. KPMG International provides no client services. All rights reserved.
- 21. The 2013 Benchmark Survey on VAT/GST | 21 For those regions that you have identified the key VAT/GST risks, do you have process and controls in place to manage those risks? For those respondents who have identified regionalVAT/GST risks, an encouragingly high majority say they have correlating processes and controls in place.The results are similar for all respondents and larger businesses. However, it should be noted that with the exception of EMA, more than 50 percent of respondents had not identified the key VAT/GST risks in the first place. Do not knowNoYesDo not knowNoYes ASPAC 70% 72% 15% 17% 15% 10% 0% 10% 20% 30% 40% 50% 60% 70% 80% 90% 0% 10% 20% 30% 40% 50% 60% 70% 80% 90% EMA 79% 84% 12% 17% 4%5% Figure 14: For those regions that you have identified the key VAT/GST risks, do you have process and controls in place to manage those risks? Do not knowNoYes Source: KPMG International, 2013. Do not knowNoYes 71% 60% 17% 26% 13%15% 0% 10% 20% 30% 40% 50% 60% 70% 80% 90% 0% 10% 20% 30% 40% 50% 60% 70% 80% 90% 68% 81% 9% 22% 9%10% LATAM North America 2013 Overall regional responses 2013 Turnover above USD20bn © 2013 KPMG International Cooperative (“KPMG International”), a Swiss entity. Member firms of the KPMG network of independent firms are affiliated with KPMG International. KPMG International provides no client services. All rights reserved.
- 22. 22 | The 2013 Benchmark Survey on VAT/GST How do you ensure that these processes and controls are embedded in the underlying business process? When reviewing how businesses ensure processes and controls are embedded within the underlying business process, the most popular method was some form of internal control self-assessment (76 percent) followed by audit by the tax department (46 percent) and audit by internal audit (40 percent). Larger businesses report more reliance on internal audit than audit by the tax department (66 percent versus 58 percent respectively), suggesting that larger businesses are potentially more effective in securing internal audit support. The responses are consistent with the “three lines of defense approach” to risk management. In this approach, risk is best managed at the first line of defense by the process owners, guided by clear policies and subject to review by the tax department as subject matter experts (the second line) and followed by internal or external audit to provide independent assurance (the third line). Internal control self-assessment Audit by external auditors OtherAudit by tax department Audit by internal audit Overall >USD20bn 0% 20% 40% 60% 80% Overall >USD20bn Overall >USD20bn Overall >USD20bn Overall >USD20bn Source: KPMG International, 2013. Figure 15: Overall, how do you ensure that these processes and controls are embedded in the underlying business process? 76% 80% 58% 66% 8% 46% 40% 8% 44% 39% Overall Turnover above USD20bn © 2013 KPMG International Cooperative (“KPMG International”), a Swiss entity. Member firms of the KPMG network of independent firms are affiliated with KPMG International. KPMG International provides no client services. All rights reserved.
- 23. The 2013 Benchmark Survey on VAT/GST | 23 Overall, how effective do you think the processes and controls have been at identifying and mitigating VAT/GST risk in your business? For businesses that have processes and controls in place regionally, EMA shows 38 percent of respondents ranking their effectiveness as very good or excellent.This compares to North America with 33 percent, Asia Pacific with 27 percent and LATAM with 19 percent. However, 16-23 percent of respondents across all regions rated them as poor. Furthermore, more than 50 percent of respondents outside EMA have not identified the key VAT/GST risks in the first place. Internal control self assessment is the most popular way of embedding process and controls in the business. 4% 15% 57% 23% 4% 29% 51% 16% 3% 24% 56% 16% EMA LATAM North America 5% 33% 45% 17% 0% 20% 40% 60% ASPAC Source: KPMG International, 2013. Figure 16: Overall, how effective do you think the processes and controls have been at identifying and mitigating VAT/GST risks in your business? Excellent Very good Good Poor Only 19 percent of respondents in LATAM rate the processes and controls they have in place to manage risks as either very good or excellent. © 2013 KPMG International Cooperative (“KPMG International”), a Swiss entity. Member firms of the KPMG network of independent firms are affiliated with KPMG International. KPMG International provides no client services. All rights reserved.
- 24. 24 | The 2013 Benchmark Survey on VAT/GST VAT/GST reporting Where are most of the VAT/ GST returns prepared in your business? Overall, respondents prepare their VAT/GST returns in-house, on a local country-by-country basis. Indeed this method is more than twice as common as in-house centralization or outsourcing (be it at a local or regional level). In EMA there is a trend towards centralization over outsourcing, whereas in other regions the delta between the two is much closer, with outsourcing being more popular than centralization in LATAM. For larger businesses the tendency to centralize is higher in EMA than elsewhere. Often the trigger point for a business to assess itsVAT/GST compliance strategy is a finance function transformation where the organization as a whole looks to assess what functions to centralize and which to outsource. It is essential thatVAT/GST considerations are properly considered at that time. With centralization, technology now exists that allows automation of often complex manual processes. But, even with technology, resource demands remain high alongside the need to keep current with local filing requirements around the world. By contrast, with outsourcing, that entire obligation shifts onto the service provider who has the ability to invest in technology and automation to a much greater extent than many individual businesses are able to do on their own. But outsourcing requires a real sense of partnership between the business and the service provider -- the obligation for which often falls upon the tax department.The partnership approach ensures not only that the compliance process works, and works well, but that the value- add opportunities that can flow from outsourcing are fully realized. Most businesses prepare VAT/GST returns in-house on a local country-by- country basis. © 2013 KPMG International Cooperative (“KPMG International”), a Swiss entity. Member firms of the KPMG network of independent firms are affiliated with KPMG International. KPMG International provides no client services. All rights reserved.
- 25. The 2013 Benchmark Survey on VAT/GST | 25 In house on a local, country-by-country basis In house but in a central location covering multiple countries Outsourced to a local service provider Outsourced to a regional or global service provider Do not know Source: KPMG International, 2013. Figure 17:Where are most of the VAT/ GST returns prepared in your business across the ASPAC, EMA, LATAM and North America regions? EMA ASPAC LATAM North America Overall >USD20bn Overall >USD20bn Overall >USD20bn Overall >USD20bn 55% 11% 7% 4% 23% 57% 13% 7% 1% 21% 48% 24% 6% 11% 12% 40% 31% 5% 8% 16% 45% 18% 8% 5% 24% 51% 14% 9% 3% 23% 40% 10% 10% 7% 33% 45% 10% 9% 3% 33% © 2013 KPMG International Cooperative (“KPMG International”), a Swiss entity. Member firms of the KPMG network of independent firms are affiliated with KPMG International. KPMG International provides no client services. All rights reserved.
- 26. 26 | The 2013 Benchmark Survey on VAT/GST Technology and the future Survey respondents were also asked about the future and specifically to rank the importance of various types of technology that will help them manage theirVAT/GST affairs today and in 3 years time. Similar to 2012, respondents this year say, irrespective of size, thatVAT/GST functionality within their native ERP systems is by far the most important technology solution for them today and in 3 years. However, it is notable that tax engines have grown in relative importance since last year, with 50 percent of larger businesses Highest 2 3 4 5 Lowest Source: KPMG International, 2013. Figure 18: In relation to the role of technology in managing your VAT/GST affairs, please rank the following in terms of your view of the importance to your business today and your estimate of likely importance in 3 years time. 69% 19% 6% 5% 1% 1% 64% 18% 10% 5%3% 18% 29% 29% 11%13% 18% 24% 25% 14%19% 5% 30% 26% 14%25% 13% 13% 25% 13%25% 13% 29% 14% 14% 14%29% 6% 17% 19% 32%25% 19% 31% 17% 13%19% 15% 27% 27% 16%15% 6% 16% 25% 31%21% 1% 1% 13% 26% 26% 10%24% VAT/GST functionality within native ERP systems (e.g. SAP, Oracle) VAT/GST knowledge management, eLearning and awareness technologies Tax engine technology to automate the tax determination for sales Third-party VAT/GST return preparation software Workflow technology to give oversight over VAT/GST returns globally Other 2013 Overall Today 3 years time Today 3 years time Today 3 years time Today 3 years time Today 3 years time Today 3 years time © 2013 KPMG International Cooperative (“KPMG International”), a Swiss entity. Member firms of the KPMG network of independent firms are affiliated with KPMG International. KPMG International provides no client services. All rights reserved.
- 27. The 2013 Benchmark Survey on VAT/GST | 27 Functionalityinthenative ERP systemisseen asthemostimportant componentoftechnology, althoughtax engines arebeingseenas increasinglyimportant. rating them in their top two priorities. In our view, this represents a growing understanding and awareness that ERP systems can at times struggle to automate tax determination for complex and dynamic supply chains, particularly in an environment where there have been an unprecedented number of indirect tax rule and rate changes. The findings support the view that tax engines allow far greater flexibility and control for the tax department while at the same time providing real time, rule and rate updates. 20% 20% 20% 40% 66% 21% 6% 5% 67% 20% 8% 4% 14% 24% 30% 17%15% 17% 33% 20% 11%19% 9% 16% 13% 29%31% 7% 23% 31% 20%20% 14% 14% 29% 14%29% 17% 38% 15% 14%17% 8% 23% 33% 21%15% 11% 17% 34% 11%26% 11% 18% 20% 29%21% Highest 2 3 4 5 Lowest Source: KPMG International, 2013. 1% 1% 2% 2% 2% Figure 18 continued: In relation to the role of technology in managing your VAT/GST affairs, please rank the following in terms of your view of the importance to your business today and your estimate of likely importance in 3 years time. VAT/GST functionality within native ERP systems (e.g. SAP, Oracle) VAT/GST knowledge management, eLearning and awareness technologies Tax engine technology to automate the tax determination for sales Third-party VAT/GST return preparation software Workflow technology to give oversight over VAT/GST returns globally Other Today 3 years time Today 3 years time Today 3 years time Today 3 years time Today 3 years time Today 3 years time 2013 Greater than USD20bn © 2013 KPMG International Cooperative (“KPMG International”), a Swiss entity. Member firms of the KPMG network of independent firms are affiliated with KPMG International. KPMG International provides no client services. All rights reserved.
- 28. 28 | The 2013 Benchmark Survey on VAT/GST In terms of future investment in VAT/GST management, 47 percent (up from 39 percent last year) prioritize investment in process. To manage VAT/GST more effectively, do you expect to invest more in the next 3 years in process, technology or people? Respondents were also asked where they expect to make investments to manageVAT/GST more effectively. There is a clear preference for process and technology followed by people. For larger businesses process and technology investments are clearly favored and the investment in people is materially less as businesses look to technology to help them achieve a more preventative and automated control environment. 2013 Overall 2013 Turnover above USD20bn 0 10 20 30 40 50 0 10 20 30 40 50 47% 29% 25% 44% 40% 16% Process Technology People Source: KPMG International, 2013. Figure 19: To manage VAT/GST more effectively, do you expect to invest more in the next 3 years in? © 2013 KPMG International Cooperative (“KPMG International”), a Swiss entity. Member firms of the KPMG network of independent firms are affiliated with KPMG International. KPMG International provides no client services. All rights reserved.
- 29. The 2013 Benchmark Survey on VAT/GST | 29 If you would like to discuss the results of this survey or any other indirect tax matter, please contact your usual KPMG indirect tax contact or refer to the contacts listed. If you are not an existing KPMG tax client we would welcome the opportunity to discuss what KPMG can offer to you – please refer to the list of contacts here or visit www.kpmg.com/indirecttax for a local contact. Findoutmore © 2013 KPMG International Cooperative (“KPMG International”), a Swiss entity. Member firms of the KPMG network of independent firms are affiliated with KPMG International. KPMG International provides no client services. All rights reserved.
- 30. 30 | The 2013 Benchmark Survey on VAT/GST © 2013 KPMG International Cooperative (“KPMG International”), a Swiss entity. Member firms of the KPMG network of independent firms are affiliated with KPMG International. KPMG International provides no client services. All rights reserved.
- 31. © 2013 KPMG International Cooperative (“KPMG International”), a Swiss entity. Member firms of the KPMG network of independent firms are affiliated with KPMG International. KPMG International provides no client services. All rights reserved.
- 32. kpmg.com/socialmedia The information contained herein is of a general nature and is not intended to address the circumstances of any particular individual or entity. Although we endeavor to provide accurate and timely information, there can be no guarantee that such information is accurate as of the date it is received or that it will continue to be accurate in the future. No one should act on such information without appropriate professional advice after a thorough examination of the particular situation. © 2013 KPMG International Cooperative (“KPMG International”), a Swiss entity. Member firms of the KPMG network of independent firms are affiliated with KPMG International. KPMG International provides no client services. No member firm has any authority to obligate or bind KPMG International or any other member firm vis-à-vis third parties, nor does KPMG International have any such authority to obligate or bind any member firm. All rights reserved. The KPMG name, logo and “cutting through complexity” are registered trademarks or trademarks of KPMG International. Designed by Evalueserve. Publication name:The 2013 Benchmark Survey onVAT/GST Publication number: 130051 Publication date: April 2013