Strategies for Unlocking Knowledge Management in Microsoft 365 in the Copilot...
Global innovation index_standard_report
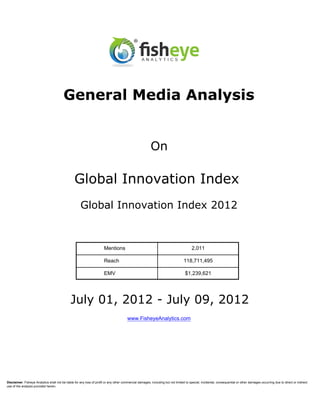
1. General Media Analysis
On
Global Innovation Index
Global Innovation Index 2012
Mentions 2,011
Reach 118,711,495
EMV $1,239,621
July 01, 2012 - July 09, 2012
www.FisheyeAnalytics.com
Disclaimer: Fisheye Analytics shall not be liable for any loss of profit or any other commercial damages, including but not limited to special, incidental, consequential or other damages occurring due to direct or indirect
use of the analysis provided herein.
2. D a ily A rti c l e C o u n t s
Sentiment Analysis with Time
The following bar chart shows the number of mentions by day over the time period July 01, 2012 and July 09, 2012.
Total number of articles for Global Innovation Index during this time period are 2,011.
This pie chart shows the share of articles among the three sentiment ratings during the time period July 01, 2012 and July 09,
2012.
Disclaimer: Fisheye Analytics employs cutting edge research to conduct automated sentiment analysis. As sentiment measurement is a qualitative topic which depends on highly variable factors such as detailed
context, cultural expressions and linguistic nuances, the data above should be interpreted as a broad trend.
Global Innovation Index - Report
July 01, 2012 - July 09, 2012
3. Vie w ership A n alysis
The following table shows the estimated viewership for online news sources by day between July 01, 2012 and July 09, 2012. The
total estimated viewership for 'Global Innovation Index' in this time period is 118,711,495.
Circulation (in thousands)
The graphs below show the Involvement and Hype Index over the same time period. It is hard to measure traditional Reach within
Social Media. Thus the index below gives an estimate of the activity within Social Media.
Hype Index: The Hype Index is constructed using the number of tweets to give an estimate of how often a piece of information
was “quoted”, “requoted” or talked about. As Twitter has a restriction of 140 characters per tweet, it reflects the immediate buzz on
a topic. The Hype Index is a weighted average of the number of Tweets as well as how influential the Source is.
Involvement Index: There are nearly 1 billion Blogs worldwide, written by a wide array of authors. Their views reflect personal
and subjective opinion of the writer. The amount of blogs indicate how involved the general public is with a given topic. The
Involvement Index is a weighted average of the number of blog hits and how influential the sources are in the Blogosphere.
Global Innovation Index - Report
July 01, 2012 - July 09, 2012
4. V de tw e ira lhM a Ak e tliy sgi sV a l u e
E i i or s ip r n a n
Editorial Marketing Value (EMV) is used to measure the equivalent advertising value of an editorial mention in a news source. The
charts below measure EMVs separately for traditional and social media. The EMV uses inputs such as online readership,
credibility of the source, sentiment and the average cost of advertising. To give you a more accurate estimate, we have
considered only positive and neutral sentiment articles for the EMV calculation.
The total EMV for all your mentions is $1,239,621
DISCLAIMER: Advertising rates vary across editorial topic, source, geography, colour and column size. Since Fisheye Analytics aggregates information worldwide, the above data represents averages only.
Global Innovation Index - Report
July 01, 2012 - July 09, 2012
5. M e di a S o ur c e s S plit
The following pie chart shows a comparison between the various types of media i.e. News, Blogs/Forums, Twitter, Facebook and
Videos for Global Innovation Index between July 01, 2012 and July 09, 2012
The pie chart clearly shows that Twitter have a higher share among the articles which have written about Global Innovation
Index
The line chart below plots the number of News articles,Blogs/Forums,Twitter, Facebook and Videos about Global Innovation
Index for all the days between July 01, 2012 and July 09, 2012
Global Innovation Index - Report
July 01, 2012 - July 09, 2012
6. S e n ti m e n t for diff e r e n t M e di a
The following charts plots the sentiment rating of Global Innovation Index over the time period between July 01, 2012 and July
09, 2012 for News articles, Blogs/Forums, Tweets & Facebook posts respectively.
News Articles Blogs/Forums
Twitter Facebook
Global Innovation Index - Report
July 01, 2012 - July 09, 2012
7. L a ngu a g e A n alysis & Sh are Of C ov era g e
Share of Languages
This chart shows the distribution of all the languages among the articles written during the time period between July 01, 2012
and July 09, 2012. This shows that most of the articles about Global Innovation Index were written in English.
Top Sources
The following table shows the percentage share of sources over the time period July 01, 2012 and July 09, 2012 among the 'top
500' publication sources that have been selected by us .
S No. Source Percent
1 Z awya 13.3 %
2 人民网 13.3 %
3 V edomosti 13.3 %
4 The N ational N ewspaper | World 6.7 %
5 D e Standa ard 6.7 %
Global Innovation Index - Report
July 01, 2012 - July 09, 2012
8. Gloss ary
Term Definition
Aggregation Aggregation is the process of gathering and organizing all publically available content, such as: blogs, online news, offline news,
newsgroups, bulletin boards, Titter and other social media sources.
Blogosphere Blogosphere is the term used to describe the totality of blogs on the Internet, and the conversations taking place within that sphere. It is
a proxy for public opinion. While in traditional Media, one does not know, whether the given statement reflects the public opinion, in
social media on knows for sure, that at least the author has this opinion as a strong view.
Campaign A Campaign is a group of keywords. Selecting campaign in the Fisheye Tool is thus an easy access. Campaigns are non binding. At
any later stage, keywords and exceptions can be grouped in form of a "walled garden".
Concept Concepts are one of the topics discussed in an article. Any given article will have more then one concept. Fisheye generates concepts
automatically. Those "raw data" needs to put into action by the given context.
Credibility Credibility describes the importance of a Source. It depends on input such as popularity of the source, Nr. of authors, Back-Links to the
article etc. The Value is between 1 and 10.
Hit A unique news article, blog entry, tweet or video that contains the keyword and/or search phrase.
Keyword Keyword is the phrase or word, which is monitored. Keyword setup to reduce noise in the Fisheye system is the most important part of
the setup process.
Language Translation Fisheye translates all content on the fly to enable worldwide access independent of language.
Language Recognition Fisheye can identify more than 44 languages correctly.
Most Quoted Headline The headline that was repeated the most number of times. Most quoted headlines give a fast and easy access to "what has
happened?" "what were the most important news?" This necessarily does not mean the most important source or most viewed
article.
RSS RSS is short for Really Simple Syndication. This allows you to subscribe to content on blogs and other social media and have it
delivered to you through a feed. Fisheye uses mostly RSS as to aggregate media. Since not all sources offer information via RSS,
Fisheye screens the world also with other pull mechanisms.
Sentiment The attitude of a speaker or a writer with respect the keyword. Sentiment can be positive, neutral or negative. The accuracy of
sentiment depends on language and context. If large numbers of articles are analyzed the overall sentiment is correct.
Share of Media Split between News, Blogs, Videos & Twitter
Social Media Social media is a terms for the tools and platforms people use to publish, converse and share content online. The tools include blogs,
wikis, podcasts, and sites to share photos and bookmarks.
TOP Media List of media sources of most interest given to us by our client
Topic Word/phrase, which is of interest. Fisheye searches and compares Topics to measure importance, country split, sentiment etc. from
given topics. Topics are defined manually and give the most accurate insights into the Brand.
Walled Garden Allows access to a subset of data depending on certain pre-defined conditions (such as: language, search phrase, media, geography,
sentiment etc.). One can create multiple walled gardens on a single dataset to analyze only certain aspects of the media.
EMV EMV isused to measure the equivalent advertising value of an editorial mention in a news source. We measure EMVs separately for
traditional as well as social media. The EMV uses inputs such as online readership, credibility of the source, sentiment and the average
cost of advertising.
Hype Index The Hype Index is constructed using the number of tweets to give an estimate of how often a piece of information was “quoted”,
“requoted” or talked about. As Twitter has a restriction of 140 characters per Tweet, it reflects the immediate buzz on a topic. The Hype
Index is a weighted average of the number of tweets as well as how influential the source is.
Involvement Index Blogs are written by the general public. Their views the reflect personal and subjective opinion of the writer. The amount of Blogs
indicate how involved the general public is with a given topic. The Involvement Index is a weighted average of the number of blog hits
and how influential the sources are in the Blogosphere.
Global Innovation Index - Report
July 01, 2012 - July 09, 2012