Berhampur 70918*19311 CALL GIRLS IN ESCORT SERVICE WE ARE PROVIDING
Indonesian Historical Data
1. Historical Data on Private Consumption
Expenditures and Fiscal Variables
This section presents the historical data from Indonesia on private consumption
expenditures (1969-2003), government expenditures (1969-2003), government debt
(1972-2003), tax revenues (1972-2003), private credit (1981-2003), and the
decomposition of fiscal variables such as routine and development government
expenditures (1969-2003), oil and gas revenues, non-tax revenues (1969-2003), and
components of tax revenues (1969-2003). Due to the differing initial starting years of
data availability, the figures depicting the historical data cover different periods.
During the New Order regime (Soeharto’s administration), the Government of
Indonesia adopted a “balanced budget rule,” in the sense that total government
expenditures were covered by total government revenues that included foreign debt. The
government put the foreign debt under “development revenues” in the budget. The
difference between government tax plus non-tax revenues and government expenditures
was financed by foreign debt. Therefore, in an economic sense, the government actually
ran budget deficits. The rationale behind the “balanced budget rule” was political. The
New Order administration did not want to encounter the Old Order regime’s experience
(Soekarno’s administration) of excessive budget deficits that were financed by printing
money, resulting in hyperinflation in the late 1960s. Instead, government expenditures
were to be determined by government revenues. Due to the inflexible nature of the
balanced budget rule, the New Order administration was able to record a success in
macroeconomic stability. When inflation increased as a result of a booming period, such
2. as an oil bonanza, the fiscal response was stiff, ensuring excessive inflation did not occur
(Hill 2000).
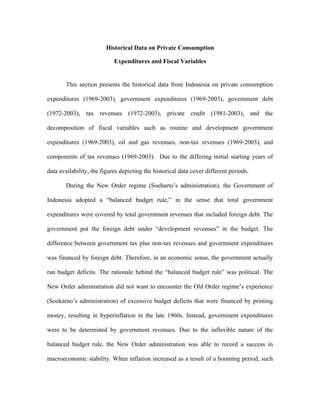
Figure 1 shows the trend of government expenditures and private consumption
expenditures as percentages of GDP. Private consumption expenditures have constituted
a large portion of GDP. Averaging at approximately 64 percent of GDP during the period
1969-2003, private consumption expenditures have driven GDP growth. In the early
period of the New Order regime, private consumption reached almost 90 percent of GDP,
and its proportion declined gradually prior to the first oil boom. During 1974-1975, the
share of private consumption to GDP slightly increased before it declined again from
1975 to 1981. Then, its share ranged from around 52 to 62 percent of GDP from 1981 to
1997 when the crisis occurred. During 1998-1999, the share of private consumption was
around 67-73 percent of GDP, but then it declined again to around 61 percent of GDP
during 2000-2001. During economic crisis when the rate of inflation soared, private
consumption expenditures remained strong. Consumers seemed to hedge consumption
goods against inflation. Meanwhile, the population in the low income brackets may have
spent their whole income or drained their savings in order to maintain the consumption
level prior to the crisis. When investment decreased in 2002-2003, private consumption
expenditures went up to around 66-67 percent of GDP, contributing to the greater part of
GDP growth. During the economic recovery after the 1997-1999 crisis, private
consumption expenditures remained the key engine of GDP growth. The recent growth of
private consumption expenditures was mainly attributable to the growth in consumer
goods such as motor vehicles due to the increasing availability of consumer credit.
3. Figure 1. Government and Private Consumption Expenditures (% of GDP)
100
% of
GDP
90
80
70
60
50
40
30
20
10
0
71
73
81
83
91
93
95
03
67
9
75
77
79
85
87
89
97
99
01
6
19
19
19
19
19
19
19
19
19
19
19
19
19
19
19
19
20
20
19
Year
Government Consumption Private Consumption
Source: International Monetary Fund, International Financial Statistics, CDs July 2004 and July 2005.
The proportion of government expenditures to GDP averaged approximately 19
percent of GDP during 1969-2003. However, this figure of government expenditures’
share of GDP understated the role of government in Indonesian economy, since many
government activities were recorded off-budget, especially during the oil boom period.
For instance, the funds allocated for defense expenditures, the state oil company
Pertamina, and other huge projects were not recorded on-budget. Moreover, the
substantial state companies sector has also been run by the government (Hill 2000).
Compared to the trend of private consumption expenditures, the trend of government
expenditures has been relatively less fluctuating. Government expenditures showed an
4. increasing trend from 1969-1981. The growth of government expenditures reached its
highest point in 1975, the peak of the oil boom. During the oil bonanza, the government
increased its outlays, for instance, by expanding the grants to local governments,
especially in primary education and public health sectors, to be spent on construction of
rural schools and health centers. The government also allocated the windfall oil revenues
in import-intensive infrastructure projects in the telecommunication sector. The oil
bonanza increased the role of government in the economy, which can be seen by the
share of government expenditures that reached almost 25 percent of GDP. The increase in
oil revenues also increased the percentage of the development budget that was financed
by public savings rather than by foreign debt (Booth 1998). Government expenditures
declined in 1984 due to fiscal severity caused by the increase in debt service payments.
Government expenditures as a percentage of GDP showed a slightly declining trend
during 1987-1996, except during 1991-1992. During the economic crisis of 1997-1999,
this percentage showed an increasing trend. To overcome the severe consequences of
economic crisis to low income society, the government allocated about 9 percent of its
expenditures to provide a social safety net. In addition, the government also subsidized
rice imports and allocated funds for restructuring domestic commercial banks, which may
explain the increasing trend of government expenditures during the 1997-1999 economic
crisis.
On average, during 1970-2003, real GDP grew at around 6.0 percent per annum,
while the figures for real private consumption expenditures and real government
expenditures are 5.2 percent and 7.7 percent, respectively. The Indonesian economy grew
rapidly during 1970-1981. Real government expenditures grew remarkably in the 1970s,
5. with the exception in 1977, due to the oil revenues and the flow of foreign aid. Until
1981, real government expenditures grew faster than real GDP. In the period 1982-1985
when the oil price declined, the growth in real government expenditures was sluggish,
and in 1984 it even experienced a negative growth for the first time during the New Order
administration. During those years, the government faced the most challenging fiscal
problems since 1966. Oil prices started to decline while debt service payments began to
rise. In 1985, government expenditures as a percentage of GDP increased modestly again,
before further declining in 1986. In that year, in the words of Hill (2000), the government
faced a “scissor problem”: declining oil prices on one side and increasing debt service
obligations on the other side. Consequently, there were outflows of resources in the
balance of payments (Hill 2000). Fiscal strictness was implemented by cutting
development expenditures and freezing the increase in civil employees for a few years.
The government also reduced subsidies, such as the rice subsidy. The growth rate of
government expenditures recovered in the latter half of the 1980s alongside the economic
recovery from the decline in oil prices, due to the success of the government in shifting to
the non-oil sector. One of the key factors in making the non-oil export goods
internationally competitive was the ability to control domestic inflation, which sustained
a large fall in the real effective exchange rate. Indeed, when the oil price declined, the
government diversified its revenue sources by conducting a comprehensive tax reform
and increasing foreign borrowing without increasing inflationary borrowing from the
banking sector (Booth 1998).
Figure 2 depicts the proportion of debt and tax revenues to GDP. The figure
indicates that debt has been a dominant part of the Indonesian economy, while the role of
6. taxation has been much smaller. Only during 1980-1982 did the proportion of taxes to
GDP outweigh the one of debt. In 1987, the proportion of debt to GDP reached more than
50 percent. During the economic crisis, due to the collapse of the exchange rate, debt
skyrocketed to more than 70 percent of GDP before gradually declining to approximately
29 percent of GDP in 2003.
Figure 2. Debt and Tax Revenues (% of GDP)
% of 80.00
GDP
70.00
60.00
50.00
40.00
30.00
20.00
10.00
0.00
75
77
79
80
81
84
85
88
89
90
93
94
95
98
99
02
03
72
73
74
76
78
82
83
86
87
91
92
96
97
00
01
19
19
19
19
19
19
19
19
19
19
19
19
19
19
19
19
19
19
19
19
19
19
19
19
19
19
20
20
20
20
19
19
Year
Debt Tax Revenues
Source: International Monetary Fund, International Financial Statistics, CDs July 2004 and July 2005;
International Monetary Fund, Government Finance Statistics, CD July 2004.
The government has not been able to reduce the country’s dependency on foreign
debt. Although during the oil bonanza the importance of debt declined, the government
did not use the momentum to pay off the debt. When the price of oil declined in the mid
7. 1980s, debt service payments increased significantly. During 1986-1988, the share of
debt to GDP ranged from 48 to 54 percent of GDP. The ratio of debt service payments to
export earnings was more than 30 percent. The balance of payment was deteriorating.
During the latter half of the 1980s, the government deregulated the trade sector to
accelerate non-oil exports. During those years, the budget was also squeezed. The budget
austerity and the liberalization packages led to the decline in the debt trend starting in
1988. The trend shows a continuing decline (except from 1991 to 1992) until 1996 prior
to the economic crisis. The devaluation in 1986 also contributed to the increase in export
competitiveness. This measure together with deregulation measures in the financial,
trade, and industrial sectors brought confidence to the private sector; hence, capital flight
was avoided. The story on foreign debt can be concluded by stating that the fiscal
objective to reduce the fiscal dependency on debt has yet to be achieved, despite the
success story of the adjustment policies implemented in the late 1980s.
Figure 3 shows the trend of private credit by deposit money banks and other
financial institutions as percentage of GDP (Beck, Demirguc-Kunt, and Levine 2000).
The figure indicates an increasing trend from 1981 until the economic crisis in 1997.
Private credit declined dramatically from about 54 percent of GDP in 1997 to only about
17 percent of GDP in 2001, before gradually increasing again during 2001-2004 to about
21 percent of GDP. Private credit can be used to represent the variable that measures a
liquidity constraint, which is one of several potential causes of deviations from Ricardian
equivalence. From 1981 to 2004, it averaged approximately 29 percent of GDP.
8. Figure 3. Private Credit (% of GDP)
% of 60
GDP
50
40
30
20
10
0
85
87
89
92
94
96
98
01
03
81
82
83
84
86
88
90
91
93
95
97
99
00
02
04
19
19
19
19
19
19
19
19
19
19
19
19
19
19
19
19
19
19
19
20
20
20
20
20
Year
Private Credit
Source: Thorsten Beck, Asli Demirgüç-Kunt and Ross Levine, (2000), "A New Database on Financial
Development and Structure," World Bank Economic Review, 14, 597-605.
Figure 4 illustrates the decomposition of government expenditures into its routine
and development components. Routine expenditures consist of wage and salary
payments, debt service payment, and subsidies such as food subsidy, oil subsidy, and
regional subsidy. Development expenditures consist of sectoral/departmental
expenditures such as industry, mining, defense, education, labor and transmigration,
regional development expenditures, and state enterprise investments (Hill 2000). On
average, routine expenditures comprised about 63 percent of total expenditures, while the
remaining 37 percent has been allocated to development expenditures during
1969/1970-2002. From the early period of the New Order up to the oil boom period,
9. routine expenditures dominated government expenditures. During the oil boom,
development expenditures dominated total government expenditures. The government
conducted a tight fiscal policy in the mid 1980s due to an increase in the government’s
obligation to debt payment. During these years of fiscal austerity, non-debt routine
government outlays on personnel such as wages and salaries and on recurrent items such
as office supplies were squeezed, and so were non-debt development expenditures such
as capital expenditures and grants to local governments (Presidential Instruction funds).
Debt payments increased dramatically from less than 10 percent of total expenditures in
the early 1980s to more than 30 percent in the late 1980s, leading to the increasing
proportion of routine expenditures. The frozen salaries of civil employees and the
military during the years of fiscal austerity led to the decline in their absolute and relative
incomes in comparison to the other sectors in the economy, resulting in the increasing
trend of moonlighting and a decline in the efficiency of services (Booth 1992). In
addition, development expenditures were also cut, resulting in the decline of civil
employees’ additional salaries from potential projects (Hill 2000). From 1986/1987,
routine expenditures showed an increasing trend while development expenditures
exhibited a decreasing trend, with the exception of the years 1991/1992-1992/1993,
1997/1998-1998/1999, and 2000-2001 when the opposite patterns held.
10. Figure 4. Routine and Development Expenditures (% of Total Expenditures)
100
90
80
70
% of Total Expenditures
60
50
40
30
20
10
0
01
9 9 99
00
02
9 8 98
0
19 -1 0
19 -1 2
19 -1 4
19 -1 5
19 -1 6
19 -1 7
19 -1 8
19 -1 0
19 -1 2
19 -1 3
19 -1 4
19 -1 5
19 -1 6
19 -1 7
19 -1 8
19 -1 9
19 -1 0
19 -1 1
19 -1 2
19 -1 3
19 -1 5
6
97 97
19 -1 1
19 -1 3
19 -1 9
19 -1 1
19 -1 4
00
70 97
7 1 97
72 97
7 3 97
74 97
7 5 97
7 6 97
7 7 97
7 8 97
8 0 98
8 2 98
83 98
8 4 98
8 5 98
8 6 98
87 98
8 8 98
89 98
9 0 99
91 99
9 2 99
93 99
9 4 99
95 99
9 6 99
7 9 97
81 98
19 -19
20
20
20
19 9
19 -19
-1
19 -1
-2
69
19
Year
Routine Expenditures Development Expenditures
Source: Ministry of Finance, Republic of Indonesia, Financial Notes, various issues.
Figure 5 shows the trend of government revenues from the oil and gas sector, tax
collections, and non-tax revenues as percentages of total domestic revenues. From 1974
to 1986, revenues from the oil and gas sector dominated the total domestic revenues,
ranging from 53 to 70 percent of total domestic revenues. The government’s coffer is
mainly dependent upon a single “taxpayer”: the oil industry. In the height of the oil
boom, Pertamina, the state oil enterprise, experienced a crisis. Pertamina’s
mismanagement, marked by a withdrawal of short-term offshore borrowings to be
invested off-budget in non-oil related mega projects, resulted in a financial crisis that had
to be resolved by the government. Real GDP would have grown at a rate of 8-9 percent,
11. instead of 4.9 percent in 1975, if the Pertamina affair had not occurred. Oil and gas
revenues peaked in 1981, reaching 71 percent of domestic revenues. The government
sterilized the oil money by building reserves, adjusting trade policies, and investing in
social and economic infrastructure. In some instances, the government also spent the oil
money for rice, fertilizer, and fuel subsidies. However, the government did not
appropriate the windfall oil revenues to pay off foreign debt due to the fear that by doing
so the government would give an incorrect sign to donors that Indonesia’s need for
foreign aid had diminished (Prawiro 1998).
Figure 5. Oil and Gas Revenues, Tax Revenues and Non-Tax Revenues
(% of Total Domestic Revenues)
80
70
60
% of Domestic Revenues
50
40
30
20
10
0
00
01
02
19 -1 0
19 -1 1
19 -1 4
19 -1 5
19 -1 6
19 -1 9
19 -1 0
19 -1 1
19 -1 4
19 -1 5
19 -1 6
19 -1 9
19 -1 0
19 -1 1
19 -1 2
19 -1 4
19 -1 5
6
97 97
0
19 -1 2
19 -1 3
19 -1 7
19 -1 8
19 -1 2
19 -1 3
19 -1 7
19 -1 8
19 -1 3
9 8 98
9 9 99
7 0 97
7 1 97
73 97
7 4 97
7 5 97
7 6 97
78 97
79 97
8 0 98
8 1 98
8 4 98
8 5 98
8 6 98
8 9 98
9 0 99
9 1 99
92 99
93 99
9 4 99
9 5 99
9 6 99
00
72 97
77 97
82 98
83 98
87 98
88 98
19 -19
19 -1 9
20
20
20
19 -19
19 -1
-2
69
19
Year
Oil and Gas Revenues Tax Revenues Non-Tax Revenues
Source: Ministry of Finance, Republic of Indonesia, Financial Notes, various issues.
12. The decline in oil prices in the mid 1980s decreased the role of oil and gas. In
1983, revenues from oil started to decline. Aware of the declining oil revenues, the
government started to shift its focus to other channels of revenue. The parliament
approved tax reform laws in 1983 to be implemented in 1984. The objective of the tax
reform was to increase tax collections from the non-oil sector, to increase the efficiency
of the administrative system, to reduce distortions in resource allocation, and to ensure
that the poor would not be made worse-off by the tax reform (Booth 1992). The financial
sector was also deregulated in 1983. Fiscal reform and financial deregulation,
accompanied by a more export-oriented trade regime, were conducted to increase the
country’s competitiveness in non-oil export goods and services (Booth 1998). The main
instrument to increase non-oil tax revenues was the value added tax (VAT). It was
expected that income tax, property tax, and an improved administrative system would
significantly improve the share of non-oil tax revenues to GDP in the medium term. In
the new tax laws, the statutory base and the taxable objects and subjects were extensively
and clearly defined. The income tax base was defined broadly and income tax-based
fiscal incentives were eliminated to reduce the tax-induced distortions in resource
allocation. The new law reduced the nominal tax rate, especially at the upper end of the
income brackets and established a common rate structure for individual and corporate
income taxes. Uniform tax rates were introduced across sectors, activities, and
commodities to reduce distortions. In order not to hurt low income groups with the
implementation of tax reform, the low nominal rates were maintained, and high income
groups were not exempted. Exemption levels were applied especially for income tax and
property tax in order to keep the low income people out of the tax net (Booth 1992). Tax
13. reform in 1984 seemed to significantly improve tax collections. From 1984 to 1997, tax
revenues showed an increasing trend, ranging from approximately 30 to 66 percent of
domestic revenues. Prior to 2000, the share of non-tax revenues in domestic revenues was
relatively constant. Non-tax revenues came from profits of the state enterprises sector and
non-departmental government institutions. On average, non-tax revenues contributed
about 9.6 percent of domestic revenues from 1969/1970-2002.
Figure 6 presents tax collection classification as percentages of total taxes. During
1969/1970-2002, the averages of income tax, value added tax, property tax, trade tax,
duties, and other taxes amounted to approximately 39 percent, 27 percent, 3 percent, 19
percent, 11 percent, and 2 percent of total taxes. Prior to the oil boom period, trade taxes
constituted the largest tax collection, reaching more than 50 percent of total tax revenues
in 1971. The figure shows that trade taxes experienced a decreasing trend over the period
of observation, and amounted to only about 5 percent of total taxes in the 2000s. Starting
from the first oil boom (1974) to mid 1985, the income tax dominated, achieving between
30 to more than 40 percent of total taxes. During the 1970s government tax collections
relied on a corporate tax on the oil and gas sector. Value added tax (VAT) reached the
highest proportion during 1984/1985 to 1989/1990. VAT collections became significant
after the implementation of the 1984 tax reform, increasing from 16 percent of total tax
collections in 1980/1981 to almost 39 percent in 1987/1988. Indeed, the simple value
added tax coupled with the uniform tax rate formed the foundation of tax reform in 1984.
It replaced the previous complicated sales tax, which applied many different tax rates as
well as many exemptions. This significant increase occurred because the VAT was
14. extended to wholesalers as well as a large number of services, and the rates were
increased for the luxury sales tax.
Figure 6. Tax Revenues (% of Total Taxes)
60.00
50.00
40.00
% of Total Taxes
30.00
20.00
10.00
0.00
0
9 8 98
9 9 99
00
01
02
19 -1 0
19 -1 1
19 -1 2
19 -1 3
19 -1 6
19 -1 7
19 -1 8
19 -1 9
19 -1 0
19 -1 1
19 -1 2
19 -1 4
19 -1 5
19 -1 6
19 -1 9
19 -1 0
19 -1 1
19 -1 2
19 -1 4
19 -1 5
6
97 97
19 -1 4
19 -1 5
19 -1 3
19 -1 7
19 -1 8
19 -1 3
00
70 97
7 1 97
7 2 97
7 3 97
7 5 97
7 6 97
7 7 97
78 97
79 97
8 0 98
8 1 98
82 98
84 98
8 5 98
8 6 98
89 98
9 0 99
9 1 99
9 2 99
9 4 99
9 5 99
9 6 99
74 97
83 98
87 98
88 98
93 99
19 -1 9
19 -19
19 -19
20
20
20
-2
19 -1
69
19
Year
Income Tax Value Added Tax Property Tax Trade Tax Duties Other Taxes
Source: Ministry of Finance, Republic of Indonesia, Financial Notes, various issues.
However, since 1990/1991 income tax has again dominated tax collections. The
government introduced a tax on the interest of time and savings deposits at the end of
1988, contributing to about 10 percent of income tax. The increase in income taxes in the
1990s perhaps was due to the improved technical capability of the tax administration,
which was achieved by investing in training and hardware and by implementing some
15. technical changes such as the classification of a proportion of the royalties from oil or
dividends from state enterprises as income tax revenue (Booth 1992) .
The Institutional History of the Indonesian Financial Sector
During the oil boom period of 1974-1982, the windfall revenues from oil enabled
the government of Indonesia to conduct a state-led model of development by
strengthening the state banks’ position in order to allocate the revenues to selected
domestic industries, state enterprises, and cooperatives (Holloh 1996). Consequently, the
financial sector was dominated by the state banks. This interventionist model of
development led Indonesia to experience financial repression until 1983.
The central bank controlled the deposit interest rate for state banks. The interest
rate subsidy to state banks resulted in a far lower interest rate than the one in the private
sector. Figure 7 shows that the nominal interest rate on deposits was constant at 21
percent during 1973-1974, 11 percent during 1973-1976, and 6 percent during
1978-1983. Inflation soared in 1973-1974, partly due to the doubling of the retail price of
rice and the quadrupling of the oil price. The ceiling on interest rates led to a negative
real interest rate during 1974-1983. The inflation rate was very high during 1973-1976,
resulting in a real interest rate of -8 percent to -18 percent. The real interest rate remained
negative (ranging from -2 percent to -12 percent) until 1983.
Since the interest rate did not reflect its market value, the role of the banking
system as a financial intermediary was limited. Figure 8 shows that prior to 1983 the
proportion of quasi money (time and saving deposits) as a percentage of GDP was
16. smaller than that of narrow money (currency plus demand deposits). The broad money
(narrow money plus quasi money) accounted for only about 10-20 percent of GDP until
1983. The quasi money alone constituted only about 4-9 percent of GDP during
1972-1983. Similar to the first oil boom in 1973-1974, the government faced difficulty in
sterilizing the monetary impact of the second oil boom. As a result, the money supply
grew faster in the early 1980s. The growth in international reserves is considered to be
the main source of money supply growth. During the oil boom, the government could
have sterilized the monetary impact by retiring its debt, building its foreign exchange
reserves, investing the money offshore, or purchasing import goods. However, foreign
aid and debt continued to flow to the domestic economy due to the favorable
concessional term and the wish of the government to maintain access to international
capital markets and donors. Due to the soft term of the loans, the government decided to
allocate the oil money to development projects and repay the debt at the original schedule
(Hill 2000; Prawiro 1998).
17. Figure 7. Interest Rate and Inflation (%)
(%) 70.00
60.00
50.00
40.00
30.00
20.00
10.00
0.00
70
72
74
76
78
80
82
84
86
88
90
92
94
6
8
0
2
9
9
0
0
-10.00
19
19
19
19
19
19
19
19
19
19
19
19
19
19
19
20
20
-20.00
-30.00
-40.00
Nominal Interest Rate Real Interest Rate Inflation
Source: International Monetary Fund, International Financial Statistics, CDs July 2004 and July 2005.
The share of state bank assets reached 80 percent of total bank assets, and state
bank credit allocation constituted 85 percent of total bank credit by 1982. Entry to the
banking sector was heavily regulated and restricted. Foreign banks could only operate in
the capital. The role of state banks was more as government agents than as financial
intermediaries. The central bank also allocated subsidized liquidity credit to favored
industrial sectors (Feridhanusetyawan et al. 2000; Halim 2000; Holloh 1996).
Furthermore, the government required state banks to allocate directed concessional credit
to selective industries with subsidized interest rates, especially to import substitution and
heavy industries. A credit ceiling hampered the development of small and medium
18. enterprises, especially in rural areas. Due to unsound credit allocation practices, the credit
subsidy program did not reach the majority of the rural population. Financial repression
decreased the interest rate for public investment, causing enhanced public investment and
decreased private investment (Fukuchi 1995).
What Indonesia experienced prior to 1983 is a common phenomenon in
developing countries with repressed financial systems. Government imposition of
allocation decisions on the banking industry yields a negative real interest rate, which in
turn leads to excess demand for credit. Consequently, a credit ceiling is implemented,
resulting in allocation of funds to favored sectors that are selected administratively rather
than market-freely. Economic development can be stimulated by financial liberalization.
A positive real interest rate would result from market determination of interest rates,
attracting idle funds to be saved in the banking sectors. A positive real interest rate also
creates incentives for borrowers to invest in productive sectors. Financial liberalization is
expected to deepen financial sectors in collecting idle funds and channeling them into
productive investment (Pill and Pradhan 1997).
19. Figure 8. Real Narrow Money, Quasi Money, and Broad Money (% of GDP)
% of 70.00
GDP
60.00
50.00
40.00
30.00
20.00
10.00
0.00
69
75
77
83
87
91
97
99
01
71
3
79
81
5
89
93
5
03
7
8
9
19
19
19
19
19
19
19
19
19
19
19
19
19
20
20
19
19
19
Narrow Money Quasi Money Broad Money
Source: International Monetary Fund, International Financial Statistics, CDs July 2004 and July 2005.
The collapse of the oil price shifted the government’s orientation from a heavy
import substitution industry toward financial and manufacturing industries. The situation
forced the government to liberalize the financial sector. On June 1, 1983, the Indonesian
government ended the era of financial repression by allowing the market mechanism to
operate. The financial liberalization package removed the credit ceiling, allowed the
nominal interest rate to be market-determined by removing deposit and lending interest
rate control, removing deposit interest rate subsidies to state banks, and reducing the
subsidized credit program. A series of financial liberalization packages followed the June
20. package. In January 1985, the liberalization package captured the introduction of
monetary instruments and central bank certificates. In May 1987, to improve fund
management, the central bank increased the interest rates on central bank certificates,
monetary instruments, discount facilities, and swap premiums. On October 27, 1988 the
government liberalized the financial sector more extensively. The objective of this
liberalization package was to increase competitiveness in the financial industry and to
develop the capital market. The reserve requirement was reduced from 15 percent to 2
percent. Entry and branching barriers to the banking industry were removed. State
enterprises were allowed to put up to 50 percent of their deposits outside of state banks.
Restrictions to non-bank financial institutions were also eased. Joint ventures with
foreign banks were permitted. Domestic banks were allowed to open branches throughout
Indonesia, foreign banks were allowed to open offices in major cities, and rural banks
were allowed to operate outside the capitals of provinces. The package also included the
reduction of the liquidity credit facility from the central bank.
In December 1988 and March 1989 the liberalization packages on the capital
market were launched. The Jakarta stock exchange (JSX) was privatized, and foreigners
were allowed to buy stocks in JSX up to 49 percent of a company’s share, except for
bank shares. In January 1990, the subsidized credit programs were reduced further;
domestic banks were required to allocate 20 percent of their portfolio to small firms,
while foreign and joint venture banks were required to allocate 50 percent of their
portfolio to export-oriented sectors (Feridhanusetyawan et al. 2000; Halim 2000;
Hofman, Rodrick-Jones, and Thee 2004; Holloh 1996).
21. A positive real interest rate was realized after the implementation of financial
liberalization. Figure 7 shows that real interest rate on deposits started to record a positive
value of 5.5 percent in 1984, jumped to around 13 percent in the following year, and
ranged from about 7.5 percent to 14 percent during 1985-1992. The financial
liberalization packages also changed the composition of monetary aggregates. The earlier
Figure 2 shows that from 1984 quasi money started to exceed narrow money in
percentages of GDP. Narrow money showed a constant trend while quasi money
experienced an increasing trend from 1983 to 1998. The increase in quasi money was
more remarkable after 1988, suggesting an outward shift of the saving schedule that
indicated an inflow from unproductive activities (Fukuchi 1995). The holding of quasi
money peaked in 1998 when it reached 50 percent of GDP. Figures 7 and 8 indeed show
the results of financial deepening: the realization of a positive real interest rate and the
significant increase in the holding of time and saving deposits.
The number of domestic banks and branches increased significantly after the
October 1988 package was launched. In the era of financial repression, there was a
decrease in the number of domestic private banks and branches from 138 and 295
respectively in 1969 to 83 and 279 respectively in 1978. In 1988 there were 94 domestic
private banks and 1536 branches. In 1993 the number increased to 152 domestic private
banks and 2923 branches. The number of foreign banks stayed constant at 11 in 1969,
1978, and 1988 and increased to 39 in 1993. Foreign bank branches only slightly
increased from 15 in 1969 to 20 in 1978 but increased significantly from 21 in 1988 to 75
in 1993 (Hill 2000). Credit expansion emerged after the implementation of financial
liberalization. The share of total credit of domestic private banks increased from 23
22. percent in 1987 to 49 percent in 1996, while the one of foreign banks increased from 3
percent in 1987 to 10 percent in 1996 (Halim 2000). In addition, by 1995 the share of
domestic private banks in savings mobilization and credit allocation had exceeded the
share of state banks (Holloh 1996). Meanwhile, domestic credit increased from 13.50
percent of GDP in 1982 to 45.48 percent of GDP in 1990 and 62.49 percent of GDP in
1999 (see Figure 9). The figure shows that domestic credit grew the fastest during the
period 1988-1991 when massive financial liberalization packages took place. Figure 9
also shows investment as percent of GDP (data are available only from 1978) and real
interest rates on lending or working capital loans (data are available only from 1986).
Fukuchi (1995) found that financial liberalization reduced distortion costs, which
amounted to 69 percent of total interest payments. However, the financial liberalization
was not without cost. The extraordinary growth of money supply created inflationary
pressure. The monetary authority responded by implementing a tight money policy. The
boom in banking also created some problems. There was a significant number of non-
performing loans. Several banks granted loans to their own affiliated conglomerate
groups up to 90 percent of the banks’ capital and exceeding the legal lending limit.
Banking scandals, such as extensive losses caused by foreign exchange speculation,
excessive loans to the real estate sector, and the misuse of loans, occurred due to lack of
enforcement of prudential regulation and supervision. The banking sector was not
fundamentally healthy. In 1991, the government reversed the liberalization measures by
re-imposing foreign borrowing limits on banks and implementing lending control
(Feridhanusetyawan et al. 2000).
23. Figure 9. Investment (% of GDP), Domestic Credit (% of GDP),
and Lending Rate (%)
70.00
60.00
50.00
40.00
30.00
(%) 20.00
10.00
0.00
71
73
75
77
85
89
91
93
97
01
03
69
79
1
83
7
95
9
8
8
9
19
19
19
19
19
19
19
19
19
19
19
19
19
20
20
19
19
19
-10.00
-20.00
-30.00
Investment (% of GDP) Domestic Credit (% of GDP) Real Lending Rate (%)
Source: International Monetary Fund, International Financial Statistics, CDs July 2004 and July 2005.
In 1992, the parliament passed a new banking law that emphasized market-
oriented banking. The law removed the specialized functions of state banks and
transformed them into limited liability companies. New foreign entrants were required to
establish joint ventures with at least 15 percent of local equity. The central banking law
was also passed in 1992. All banking activities required a license from the Minister of
Finance, which was issued based on the central bank’s recommendation. The law also
enabled the central bank to ask banks’ shareholders to conduct certain measures, such as
changing the members of the board of directors and commissioners, injecting new capital,
writing off the bad loans, and covering the losses with the banks’ capital, in the case that
banks faced liquidity problems (Halim 2000; Holloh 1996). The 1990s story shows that
24. the legal framework and banking supervision were not adequate to frame the
liberalization measures that perhaps were taken too drastically and too soon. The decline
in oil prices was seen by the technocrats, who designed the liberalization measures, as an
opportunity to launch beneficial banking and financial reforms without waiting for the
institutions to adequately frame the change (Hofman, Rodrick-Jones, and Thee 2004).
The economic crisis of 1997-1998 adversely affected the banking sector. As can
be seen from Figure 9, the nominal interest rate sky rocketed to about 20 percent in 1997
and 39 percent in 1998. Inflation was also very high at about 58 percent in 1998, resulting
in a negative real interest rate of about 19 percent in 1998. This was the only time that the
real interest rate reached a negative value in the period of financial liberalization. The
nominal interest rate was still high at about 25 percent in 1999 and declined to about 15
percent in 2002 and 10 percent in 2003. The high interest rate in 1998 and 1999 led to a
massive debt overhang and a credit crunch in 1999 and 2000. Before the crisis, the
interest rate was already high at 15-16 percent in 1995-1996. Consequently, banking and
corporate sectors borrowed funds in foreign currency. When the Rupiah fell, banking and
corporate sectors were not able to repay the debt in foreign currency. Furthermore, the
economic crisis had stopped the allocation of new loans and credit activities
(Feridhanusetyawan et al. 2000).
Figure 9 also shows that domestic credit started to decline during 1999-2003. The
central bank increased the interest rate on the central bank’s certificate from 7 percent to
30 percent in December 1997 and to 80 percent in 1998 before reducing it to 40 percent
in 1999. The Rupiah was floated in August 1997 after widening the band of the managed
floating system from 8 percent to 12 percent. However, the government’s attempt to
25. prevent capital flight and further depreciation by conducting a tight money policy and an
increasing rate of interest was not effective. The Rupiah depreciated further. Furthermore,
capital flight remained and capital inflow did not occur. The high interest rate eroded
banks’ profit and capital base due to the presence of negative spreads, and it also
increased capital and production costs of the real sector (Feridhanusetyawan et al. 2000;
Halim 2000).
In November 1997, the IMF urged the government to liquidate 16 insolvent
banks. This liquidation created financial panic and explained the phenomenon of the
skyrocketing interest rate in 1998. In March 1999, there was a closure of 38 banks and a
takeover of 7 banks, leaving only 73 banks healthy (Halim 2000). The Indonesian Bank
Restructuring Agency (IBRA) restructured banking by merging, recapitalizing, closing,
and taking over a significant number of banks, the cost of which amounted to
approximately 60 percent of GDP (Feridhanusetyawan et al. 2000). The IMF’s Letter of
Intent required that the bank’s reform strategy focus on the government-assisted
recapitalization program for viable banks; liquidation or take-over for non-viable banks;
merger, reform, and recapitalization for state banks; central bank’s measures to recover
liquidity support to troubled banks; and a strengthening of the banking supervision
system (Halim 2000). Adequate monitoring and supervision of banks are needed to
institutionally frame the financial deepening.