Quarterly financial analysis
•
0 j'aime•923 vues

Sales increased 25% in Q2 after a difficult Q1. Sales are forecast to grow another 15% in Q3. Net profit improved from negative in Q1 to positive in Q2. Net profit is forecast to improve 234% in Q3, though a more reasonable expectation is 150% improvement. Key financial ratios like current ratio, gross profit ratio, and accounts receivable turnover indicate the company is in a healthy position overall.

Recommandé
Contenu connexe
Tendances
Tendances (6)
En vedette
En vedette (10)
Similaire à Quarterly financial analysis
Similaire à Quarterly financial analysis (20)
Plus de Futurebooks
Plus de Futurebooks (20)
Dernier
Dernier (20)
Quarterly financial analysis
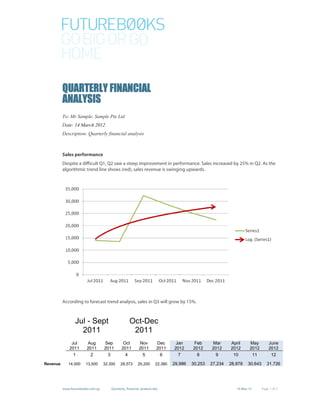
- 1. QUARTERLY FINANCIAL ANALYSIS To: Mr Sample, Sample Pte Ltd Date: 14 March 2012 Description: Quarterly financial analysis Sales performance Despite a difficult Q1, Q2 saw a steep improvement in performance. Sales increased by 25% in Q2. As the algorithmic trend line shows (red), sales revenue is swinging upwards. According to forecast trend analysis, sales in Q3 will grow by 15%. Jul - Sept Oct-Dec 2011 2011 Jul Aug Sep Oct Nov Dec Jan Feb Mar April May June 2011 2011 2011 2011 2011 2011 2012 2012 2012 2012 2012 2012 1 2 3 4 5 6 7 8 9 10 11 12 Revenue 14,000 13,500 32,300 28,573 25,200 22,380 29,986 30,253 27,234 28,878 30,643 31,726 www.futurebooks.com.sg Quarterly_financial_analysis.doc 14-Mar-12 Page 1 of 3
- 2. Net profit performance Net profit made the biggest improvement. It was negative in Q1, with net profit in the black in Q2. According to forecast trend analysis, net profit in Q3 will improve by 234%. However, this kind of productivity gain is unlikely. It is more reasonable to expect a 150% improvement. Jul - Sept Oct-Dec 2011 2011 Jul Aug Sep Oct Nov Dec Jan Feb Mar April May June 2011 2011 2011 2011 2011 2011 2012 2012 2012 2012 2012 2012 1 2 3 4 5 6 7 8 9 10 11 12 Profit (6,964) (9,580) 11,268 778 3,265 4,946 9,378 11,174 9,502 13,685 15,415 17,043 www.futurebooks.com.sg Quarterly_financial_analysis.doc 14-Mar-12 Page 2 of 3
- 3. Important financial ratios The follow ratios indicate the health of the business. Calculation Computation Notes Rating out of 5 Current Total Current 2.34 The company is holding ratio Assets / Total few liabilities and has Current Liabilities enough cash and receivables to pay 30- 120 day liabilities. Gross profit gross profit / net 12% Gross profit grew by ratio sales 20% in-line with growth of revenue and net profit. Accounts total net sales / 3:1 The company is receivable accounts regularly collecting turnover receivable cash from customers. Profit per net profit (before $120/sft. In this industry, there square foot tax) / square feet are firms achieving > of office space $180/sft. Profit per net profit (before $3,400/person In this industry, there head tax) / number of are firms achieving full time staff >4,500/person. For explanation of ratios visit http://futurebooks.com.sg/blog/6-financial-ratios-every-entrepreneur- should-master/774 www.futurebooks.com.sg Quarterly_financial_analysis.doc 14-Mar-12 Page 3 of 3