1. Corporación Educativa
Colegio Internacional Cartagena
CLASE
Versión 01-11 Código FO-DC-01 Página
1 de 5
Área: Math Asignatura: Math Curso: 1
th th
Fecha: August 6 -12 Periodo: III Nº Horas: 5hr Semana 5
August 13th – 19th 6
Docente: Gerardo Núñez Coronado
Tema: CLASSIFY AND REPRESENT OBJECTS AND DATA IN GRAPHS
Indicador Organize and record data in tables. Tally tables, picture graph and bar graph
de Logro
Exploración
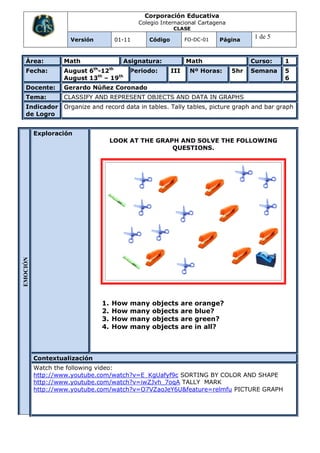
LOOK AT THE GRAPH AND SOLVE THE FOLLOWING
QUESTIONS.
EMOCIÓN
1. How many objects are orange?
2. How many objects are blue?
3. How many objects are green?
4. How many objects are in all?
Contextualización
Watch the following video:
http://www.youtube.com/watch?v=E_KgUafyf9c SORTING BY COLOR AND SHAPE
http://www.youtube.com/watch?v=iwZJvh_7oqA TALLY MARK
http://www.youtube.com/watch?v=O7VZaoJeY6U&feature=relmfu PICTURE GRAPH
2. Corporación Educativa
Colegio Internacional Cartagena
CLASE
Versión 01-11 Código FO-DC-01 Página
2 de 5
Conceptualización
Data and Graphing
Organizing Data
Collecting, organizing, and interpreting data are common real-life activities. It
is important to present the data in a way that makes interpretation easy.
There are many forms in which data can be organized and presented. Whether
to use a tally chart, a bar graph, a picture graph, or another graph depends on
what data one wants to display.
Pictographs
A pictograph represents data with pictures. For example, a picture graph could
be used to show how many bears are in a zoo. Pictures of bears can be shown
on the graph to represent the numbers of bears. The title tells what the graph
is about.
Bar Graphs
A bar graph is used to display data that can be counted. On a vertical bar
graph, the horizontal scale along the bottom of the graph shows what is being
counted, and the vertical scale at the left shows the number counted.
3. Corporación Educativa
Colegio Internacional Cartagena
CLASE
Versión 01-11 Código FO-DC-01 Página
3 de 5
Producción
TALLY MARK
PICTOGRAPH
ACCIÓN
4. Corporación Educativa
Colegio Internacional Cartagena
CLASE
Versión 01-11 Código FO-DC-01 Página
4 de 5
BAR GRAPH
Modelación
TALLY MARK
5. Corporación Educativa
Colegio Internacional Cartagena
CLASE
Versión 01-11 Código FO-DC-01 Página
5 de 5
PICTOGRAPH
BAR GRAPH
Workshop
THE WORKSHOP IS GONNA BE AT THE PLATFORM AS A (.pdf) FILE. AND ALSO
YOU CAN FIND THE DATE TO DELIVER.
Lectura Complementaria:
http://www.ixl.com/math/grade-1/interpret-data-in-tally-charts-picture-graphs-tables
http://www.ixl.com/math/grade-1/record-data-with-tally-charts-picture-graphs-tables
http://www.ixl.com/math/grade-1/interpret-bar-graphs
http://www.ixl.com/math/grade-1/which-bar-graph-is-correct
Bibliografía :
http://www.harcourtschool.com
http://www.ixl.com