Contenu connexe
Similaire à 2014 super bowl
Similaire à 2014 super bowl (20)
Plus de Greg Sterling (20)
2014 super bowl
- 1. Source: Monthly Consumer Survey
N = 6417, 1/6 - 1/13/14
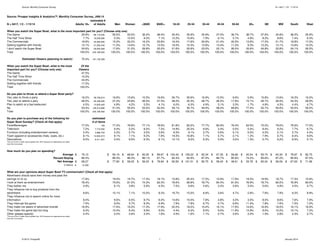
Source: Prosper Insights & Analytics™, Monthly Consumer Survey, JAN-14
estimated #
N = 6417, 1/2 - 1/13/14
Adults 18+
of Adults
Women
<$50K
$50K+
18-24
25-34
35-44
45-54
55-64
65+
NE
MW
South
West
When you watch the Super Bowl, what is the most important part for you? (Choose only one)
The Game
35.9%
86,118,326
50.5%
22.0%
The Half Time Show
7.7%
18,539,995
5.3%
10.0%
The Commercials
45,084,606
15.2%
22.2%
18.8%
Getting together with friends
13.1%
31,392,442
11.5%
14.6%
I don't watch the Super Bowl
59,050,583
17.6%
31.2%
24.6%
Total
100.0% 240,185,952
100.0%
100.0%
32.2%
9.2%
16.2%
12.7%
29.8%
100.0%
38.4%
7.1%
20.8%
13.5%
20.2%
100.0%
30.4%
12.2%
19.4%
16.5%
21.6%
100.0%
35.9%
10.6%
17.6%
15.3%
20.6%
100.0%
34.9%
7.9%
20.6%
13.6%
23.0%
100.0%
37.0%
6.1%
21.4%
13.4%
22.1%
100.0%
36.7%
5.7%
20.5%
11.2%
26.0%
100.0%
38.7%
4.9%
13.6%
9.3%
33.6%
100.0%
37.6%
8.2%
17.2%
12.2%
24.8%
100.0%
34.8%
8.6%
21.7%
12.1%
22.8%
100.0%
36.0%
7.4%
18.8%
13.6%
24.1%
100.0%
35.9%
6.3%
17.0%
14.2%
26.5%
100.0%
Estimated Viewers (planning to watch):
75.4%
When you watch the Super Bowl, what is the most
important part for you? (Choose only one)
The Game
The Half Time Show
The Commercials
Getting together with friends
Total
Of the
Viewers
47.5%
10.2%
24.9%
17.3%
100.0%
Do you plan to throw or attend a Super Bowl party?
Yes, plan to throw a party
Yes, plan to attend a pary
Plan to watch at a bar/restaurant
No
Total
16.2%
26.0%
4.5%
53.4%
100.0%
Men
Do you plan to purchase any of the following for
Super Bowl Sunday? (Check all that apply)
Food/Beverages
Television
Furniture (including entertainment centers)
Team apparel or accessories (hats, coats, etc.)
Decorations
181,135,369
16.8%
27.2%
4.8%
51.2%
100.0%
62,338,026
10,835,420
128,212,896
240,185,952
15.6%
24.8%
4.2%
55.5%
100.0%
15.5%
26.0%
5.5%
53.0%
100.0%
16.6%
27.3%
4.1%
52.0%
100.0%
26.7%
38.2%
6.0%
29.1%
100.0%
30.6%
32.3%
6.3%
30.7%
100.0%
16.9%
28.7%
4.9%
49.4%
100.0%
10.5%
26.2%
5.1%
58.2%
100.0%
8.9%
17.9%
3.3%
69.8%
100.0%
5.9%
15.1%
1.7%
77.4%
100.0%
15.8%
26.7%
4.8%
52.7%
100.0%
13.6%
26.5%
4.3%
55.6%
100.0%
18.3%
23.3%
4.4%
54.0%
100.0%
16.2%
28.9%
4.7%
50.2%
100.0%
77.2%
9.4%
4.2%
9.1%
5.4%
38,799,610
76.8%
5.2%
2.7%
7.1%
6.6%
77.1%
8.0%
3.5%
9.2%
6.3%
78.6%
7.2%
3.6%
7.8%
6.1%
81.8%
14.9%
8.3%
19.3%
14.1%
83.2%
20.2%
9.1%
16.8%
8.2%
77.7%
6.6%
3.7%
7.1%
6.3%
80.9%
2.4%
0.6%
4.7%
5.0%
76.4%
0.5%
0.1%
2.1%
3.0%
63.5%
0.4%
0.0%
1.3%
1.3%
75.2%
8.4%
4.0%
7.9%
5.7%
79.0%
6.2%
2.1%
6.7%
6.2%
76.6%
7.7%
3.7%
8.4%
6.5%
77.0%
6.7%
4.3%
9.6%
5.1%
90.19 $
86.3%
77.80 $
68.64 $
86.3%
59.25 $
65.05 $
86.1%
56.03 $
89.87 $ 100.43 $ 109.22 $
87.7%
92.4%
92.9%
78.84 $ 92.83 $ 101.51 $
92.34 $
87.5%
80.75 $
67.35 $
86.7%
58.42 $
56.66 $
85.8%
48.61 $
45.54 $
74.2%
33.78 $
93.74 $
85.6%
80.24 $
64.30 $
87.2%
56.09 $
78.87 $
85.8%
67.63 $
82.75
87.0%
71.96
16.7%
81.0%
3.8%
17.3%
74.3%
5.9%
18.1%
82.3%
4.5%
15.8%
76.6%
7.5%
20.4%
69.8%
9.6%
17.2%
78.7%
4.6%
15.9%
84.4%
2.2%
17.9%
81.6%
2.8%
19.2%
78.9%
3.4%
19.9%
76.7%
5.6%
18.7%
80.0%
4.9%
17.3%
76.9%
4.5%
15.8%
80.6%
4.7%
7.1%
10.0%
8.3%
19.7%
15.0%
8.8%
3.6%
4.7%
2.8%
7.8%
7.9%
9.2%
8.9%
6.5%
5.7%
16.2%
8.4%
2.6%
8.7%
8.3%
17.3%
9.9%
3.3%
8.2%
6.9%
17.9%
9.0%
1.6%
14.6%
7.9%
20.2%
4.4%
2.5%
15.0%
7.8%
18.2%
6.2%
1.6%
7.8%
6.7%
15.4%
8.5%
1.1%
4.8%
4.7%
16.1%
9.0%
2.7%
4.3%
6.6%
17.9%
11.9%
3.6%
3.0%
11.4%
14.6%
14.9%
3.0%
8.0%
7.8%
16.9%
9.0%
1.9%
8.6%
7.6%
18.0%
10.2%
2.8%
7.6%
7.5%
16.1%
10.1%
2.3%
7.9%
7.2%
16.9%
7.2%
2.7%
estimated
# of items
77.0%
7.2%
3.4%
8.1%
6.0%
NA
7,719,302
3,686,703
14,644,913
6,411,301
*The sum of the % totals may be greater than 100% because the respondents can select
more than one answer.
How much do you plan on spending?
Average $
Percent Buying
Net Average $
in billions $
79.12
86.3%
68.27
$
$
12.366
What are your opinions about Super Bowl TV commericals? (Check all that apply)
Advertisers should save their money and pass the
savings on to us
17.8%
19.0%
I look at them as entertainment
78.4%
75.6%
They bother me
4.9%
6.1%
They influence me to buy products from the
advertisers
8.6%
10.1%
They influence me to search online for more
information
8.0%
9.6%
They interrupt the game
7.5%
9.5%
They make me aware of advertiser brands
16.9%
17.6%
They make the game last too long
9.3%
10.4%
Other (please specify)
2.4%
2.2%
*The sum of the % totals may be greater than 100% because the respondents can select
more than one answer.
© 2014, Prosper®
1
January 2014
- 2. Source: Monthly Consumer Survey
Source: Prosper Insights & Analytics™, Monthly Consumer Survey, JAN 07-14
----------2010-------------------2011-------------------2012-------------------2013-------------------2014-------------------2007-------------------2008-------------------2009---------estimated #
estimated #
estimated #
estimated #
estimated #
estimated #
estimated #
estimated #
Adults 18+
of Adults Adults 18+
of Adults Adults 18+
of Adults Adults 18+
of Adults Adults 18+
of Adults Adults 18+
of Adults Adults 18+
of Adults Adults 18+
of Adults
When you watch the Super Bowl, what is the most important part for you? (Choose only one)
The Game
71,585,417
32.7%
73,775,052
32.1%
The Half Time Show
10,957,569
5.4%
12,246,394
4.9%
The Commercials
18.1%
40,318,421
18.4%
41,507,280
Getting together with friends
14.6%
32,521,239
13.5%
30,506,746
I don’t watch the Super Bowl
30.3%
67,557,775
30.0%
67,627,451
Total
100.0%
222,940,420
100.0%
225,662,922
Estimated Viewers (planning to watch):
69.7%
Do you plan to throw or attend a Super Bowl party?
Yes, plan to throw a party
12.8%
Yes, plan to attend a pary
26.8%
Plan to watch at a bar/restaurant
4.1%
No
56.3%
Total
100.0%
Do you plan to purchase any of the following
for Super Bowl Sunday? (Check all that
apply)
Food/Beverages
Television
Furniture (including entertainment centers)
Team apparel or accessories (hats, coats, etc.)
Decorations
33.8%
5.2%
19.8%
14.6%
26.7%
100.0%
227,719,424
35.0%
5.7%
17.8%
14.7%
26.8%
100.0%
76,956,186
11,877,310
44,994,652
33,163,789
60,727,487
230,117,876
34.6%
5.6%
19.0%
14.4%
26.4%
100.0%
80,613,659
13,070,096
40,960,883
33,844,650
61,628,589
232,458,335
34.8%
5.9%
19.0%
13.9%
26.4%
100.0%
80,410,935
13,083,895
44,087,570
33,394,795
61,481,140
234,564,071
34.2%
7.2%
19.8%
14.2%
24.6%
100.0%
81,548,852
13,896,749
44,517,473
32,591,361
62,009,636
237,657,645
35.9%
7.7%
18.8%
13.1%
24.6%
100.0%
240,185,952
81,166,959
17,226,934
46,992,597
33,770,308
58,500,848
86,118,326
18,539,995
45,084,606
31,392,442
59,050,583
155,382,645
70.0%
158,035,471
73.3%
166,991,937
73.2%
168,489,287
73.6%
170,977,195
73.6%
172,554,435
75.4%
179,156,797
75.4%
181,135,369
28,438,988
13.0%
26.5%
4.7%
55.8%
100.0%
29,303,431
13.5%
26.5%
4.5%
55.5%
100.0%
30,716,297
13.8%
25.6%
4.6%
56.1%
100.0%
31,673,644
15.0%
26.3%
5.2%
53.4%
100.0%
34,974,629
15.3%
27.1%
5.1%
52.5%
100.0%
35,908,890
16.6%
25.2%
4.3%
53.9%
100.0%
39,427,462
16.2%
26.0%
4.5%
53.4%
100.0%
38,799,610
59,773,631
9,156,348
125,571,452
222,940,420
estimated #
of items
69.3%
2.8%
1.4%
59,706,561
10,674,461
125,978,468
225,662,922
estimated #
of items
2,525,101
6.3%
9,748,423
6.0%
9,442,999
NA
NA
NA
10,264,223
126,286,553
227,719,424
58,802,645
10,575,865
129,065,722
230,117,876
estimated #
of items
3,852,745
1,289,354
67.4%
4.1%
1.9%
NA
NA
60,452,351
72.4%
2.7%
1.2%
NA
1,764,074
5.6%
5.7%
61,202,518
12,156,915
124,124,273
232,458,335
estimated #
of items
71.4%
3.6%
1.9%
NA
2,632,446
1,186,071
6.5%
6.1%
9,290,348
5,622,075
69.5%
4.5%
2.0%
NA
3,613,091
1,901,902
7.3%
6.0%
11,002,584
6,102,159
63,587,713
11,930,882
123,136,586
234,564,071
estimated #
of items
71.3%
5.1%
2.4%
NA
4,534,382
2,049,413
8.6%
6.4%
12,479,861
6,047,015
59,964,502
10,164,864
128,100,817
237,657,645
estimated #
of items
74.0%
7.1%
3.7%
NA
5,148,539
2,453,342
9.5%
7.1%
14,830,004
6,530,438
62,338,026
10,835,420
128,212,896
240,185,952
estimated #
of items
77.0%
7.2%
3.4%
NA
7,539,699
3,906,972
8.1%
6.0%
17,002,184
7,503,819
NA
7,719,302
3,686,703
14,644,913
*The sum of the % totals may be greater than 100% because the respondents can
select more than one answer.
How much do you plan on spending?
Average $
Percent Buying
Net Average $
71.26
78.6%
56.04
$
$
$
72.97
82.1%
59.90
in billions $
8.708
$
9.467
What are your opinions about Super Bowl TV commericals? (Check all that apply)
Advertisers should save their money and pass
the savings on to us
NA
18.0%
I look at them as entertainment
NA
75.7%
They bother me
NA
4.3%
They influence me to buy products from the
advertisers
NA
6.1%
They influence me to search online for more
information
NA
6.5%
They interrupt the game
NA
9.2%
They make me aware of advertiser brands
NA
16.7%
They make the game last too long
NA
11.1%
Other (please specify):
NA
3.1%
$
$
68.52
83.6%
57.27
$
$
64.00
82.2%
52.63
$
9.563
$
$
71.51
83.0%
59.33
$
8.868
$
$
76.37
83.6%
63.87
$
10.145
$
$
82.30
83.3%
68.54
$
79.12
86.3%
68.27
$
11.021
$
12.279
$
12.366
21.4%
79.3%
3.7%
19.4%
76.3%
3.5%
17.0%
74.9%
3.6%
18.5%
73.0%
4.4%
19.5%
76.6%
5.2%
17.8%
78.4%
4.9%
6.1%
7.1%
7.7%
8.4%
10.5%
8.6%
6.7%
8.6%
17.0%
11.1%
3.3%
7.1%
8.6%
18.1%
10.1%
3.2%
7.1%
7.0%
17.4%
9.5%
3.2%
7.3%
7.8%
16.9%
8.9%
3.1%
8.7%
8.6%
19.5%
10.9%
2.8%
8.0%
7.5%
16.9%
9.3%
2.4%
*The sum of the % totals may be greater than 100% because the respondents can
select more than one answer.
© 2014, Prosper®
2
January 2007 - 2014
6,411,301