SlideShare une entreprise Scribd logo
1  sur  47
Modeling the evolution of metropolitan London using historical GIS Kiril Stanilov, March 2010 CASA funded by EC’s FP7 Marie Curie Fellowship
study area Greater London Kiril Stanilov, March 2010 CASA
data Ordnance Survey  County Series 1:2,500 1875 Kiril Stanilov, March 2010 CASA
data Ordnance Survey  County Series 1:2,500 1 : 10,000 1875 Kiril Stanilov, March 2010 CASA
data Ordnance Survey  County Series 1:2,500 1 : 2,500 1 : 10,000 1875 Kiril Stanilov, March 2010 CASA
data Ordnance Survey  County Series 1:2500 2005 1985 1960 1935 1915 1895 1875 Kiril Stanilov, March 2010 CASA
Land use classification Kiril Stanilov, March 2010 CASA
1875-2005    residential development terraced housing semi -detached  housing detached  housing multi-family housing Kiril Stanilov, March 2010 CASA
1875    spatial  structure 1875 development industrial uses Kiril Stanilov, March 2010 CASA
1895    spatial  structure 1875 development 1875-95 development industrial uses Kiril Stanilov, March 2010 CASA
1915    spatial  structure 1875 development 1875-95 development 1895-15 development industrial uses Kiril Stanilov, March 2010 CASA
1935    spatial  structure 1875 development 1875-95 development 1895-15 development 1915-35 development industrial uses Kiril Stanilov, March 2010 CASA
1960    spatial  structure 1875 development 1875-95 development 1895-15 development 1915-35 development 1935-60 development industrial uses Kiril Stanilov, March 2010 CASA
1985    spatial  structure 1960-85 development 1875 development industrial uses 1875-95 development 1895-15 development 1915-35 development 1935-60 development Kiril Stanilov, March 2010 CASA
2005    spatial  structure 1960-85 development 1875 development 1985-05 development 1875-95 development industrial uses 1895-15 development 1915-35 development 1935-60 development Kiril Stanilov, March 2010 CASA
1875 - 2005    land  development  patterns nucleation 1875 - 95 1895 - 15 diffusion 1915 - 35 1935 - 60 infill 1985 - 05 1960 - 85 Kiril Stanilov, March 2010 CASA
1875 - 2005    land  development  patterns 1875 - 95 1895 - 15 1915 - 35 1935 - 60 ,[object Object]
  distance  to  suburban centres
  distance  to  main roads
  distance  to  rail stations
 neighborhood  influence1985 - 05 1960 - 85 Kiril Stanilov, March 2010 CASA
1875    Distance to roads  -  arterial developed land arterial roads Kiril Stanilov, March 2010 CASA
1875    Distance to roads  -  connector developed land connector roads Kiril Stanilov, March 2010 CASA
 distance to cbd residential 1915-35 Kiril Stanilov, March 2010 CASA
distance to cbd residential 1915-35 Kiril Stanilov, March 2010 CASA
1875    Distance to rail stations residential commercial rail station Kiril Stanilov, March 2010 CASA
1895Distance to rail stations residential commercial rail station Kiril Stanilov, March 2010 CASA
1915Distance to rail stations residential commercial rail station Kiril Stanilov, March 2010 CASA
1935Distance to rail stations residential development 1915-35 rail station Kiril Stanilov, March 2010 CASA
1935Distance to rail stations residential 1915-35 developed land 1915 rail station Kiril Stanilov, March 2010 CASA
1915    accessibility distance to arterial roads distance to connector roads distance to rail stations distance to rail stations Kiril Stanilov, March 2010 CASA
 Identification of suburban  centres residential commercial Kiril Stanilov, March 2010 CASA
1875    accessibility rail station tram line Kiril Stanilov, March 2010 CASA
modeling  urban  land  use 2005 1875 Kiril Stanilov, March 2010 CASA
Conclusions 1875 Kiril Stanilov, March 2010 CASA
Conclusions Kiril Stanilov, March 2010 CASA
Conclusions modeled actual 1895 Kiril Stanilov, March 2010 CASA
Conclusions modeled actual 1895 1915 Kiril Stanilov, March 2010 CASA

Contenu connexe

Plus de GISRUK conference

5A_3_GIS based spatial modelling for improving the sustainability of aggregat...
5A_3_GIS based spatial modelling for improving the sustainability of aggregat...5A_3_GIS based spatial modelling for improving the sustainability of aggregat...
5A_3_GIS based spatial modelling for improving the sustainability of aggregat...GISRUK conference
 
5A_1_Land evaluation techniques comparing fuzzy ahp with ideal point methods
5A_1_Land evaluation techniques comparing fuzzy ahp with ideal point methods5A_1_Land evaluation techniques comparing fuzzy ahp with ideal point methods
5A_1_Land evaluation techniques comparing fuzzy ahp with ideal point methodsGISRUK conference
 
4B_3_Automatically generating keywods for georeferenced imaged
4B_3_Automatically generating keywods for georeferenced imaged4B_3_Automatically generating keywods for georeferenced imaged
4B_3_Automatically generating keywods for georeferenced imagedGISRUK conference
 
4B_1_How many volunteers does it take to map an area well
4B_1_How many volunteers does it take to map an area well4B_1_How many volunteers does it take to map an area well
4B_1_How many volunteers does it take to map an area wellGISRUK conference
 
4A_1_Uncertainty in the 2001 output area classification for the census of eng...
4A_1_Uncertainty in the 2001 output area classification for the census of eng...4A_1_Uncertainty in the 2001 output area classification for the census of eng...
4A_1_Uncertainty in the 2001 output area classification for the census of eng...GISRUK conference
 
3A_4_Applying network analysis to quantify accessibility to urban greenspace ...
3A_4_Applying network analysis to quantify accessibility to urban greenspace ...3A_4_Applying network analysis to quantify accessibility to urban greenspace ...
3A_4_Applying network analysis to quantify accessibility to urban greenspace ...GISRUK conference
 
3A_2_Modelling health-harming behaviours in a socially ranked geographic space
3A_2_Modelling health-harming behaviours in a socially ranked geographic space3A_2_Modelling health-harming behaviours in a socially ranked geographic space
3A_2_Modelling health-harming behaviours in a socially ranked geographic spaceGISRUK conference
 
1A_3_A geodemographic classification of london primary schools
1A_3_A geodemographic classification of london primary schools1A_3_A geodemographic classification of london primary schools
1A_3_A geodemographic classification of london primary schoolsGISRUK conference
 
UK Map Challenge Aidan Slingsby
UK Map Challenge   Aidan SlingsbyUK Map Challenge   Aidan Slingsby
UK Map Challenge Aidan SlingsbyGISRUK conference
 
SP_4 Supporting spatial negotiations in land use planning
SP_4 Supporting spatial negotiations in land use planningSP_4 Supporting spatial negotiations in land use planning
SP_4 Supporting spatial negotiations in land use planningGISRUK conference
 
SP_3 Automatic identification of high streets and classification of urban lan...
SP_3 Automatic identification of high streets and classification of urban lan...SP_3 Automatic identification of high streets and classification of urban lan...
SP_3 Automatic identification of high streets and classification of urban lan...GISRUK conference
 
9B_1_Trust in web gis a preliminary investigation of the environment agencys ...
9B_1_Trust in web gis a preliminary investigation of the environment agencys ...9B_1_Trust in web gis a preliminary investigation of the environment agencys ...
9B_1_Trust in web gis a preliminary investigation of the environment agencys ...GISRUK conference
 
9A_2_Automatic classification of retail spaces from a large scale topographc ...
9A_2_Automatic classification of retail spaces from a large scale topographc ...9A_2_Automatic classification of retail spaces from a large scale topographc ...
9A_2_Automatic classification of retail spaces from a large scale topographc ...GISRUK conference
 
9A_1_On automatic mapping of environmental data using adaptive general regres...
9A_1_On automatic mapping of environmental data using adaptive general regres...9A_1_On automatic mapping of environmental data using adaptive general regres...
9A_1_On automatic mapping of environmental data using adaptive general regres...GISRUK conference
 
8B_4_Exploring the usability of geographic information
8B_4_Exploring the usability of geographic information8B_4_Exploring the usability of geographic information
8B_4_Exploring the usability of geographic informationGISRUK conference
 
8B_2_Using sound to represent uncertainty in address locations
8B_2_Using sound to represent uncertainty in address locations8B_2_Using sound to represent uncertainty in address locations
8B_2_Using sound to represent uncertainty in address locationsGISRUK conference
 
8B_1_A map to hear - use of sound in enhancing the map use experience
8B_1_A map to hear - use of sound in enhancing the map use experience8B_1_A map to hear - use of sound in enhancing the map use experience
8B_1_A map to hear - use of sound in enhancing the map use experienceGISRUK conference
 
8A_2_A containment-first search algorithm for higher-order analysis of urban ...
8A_2_A containment-first search algorithm for higher-order analysis of urban ...8A_2_A containment-first search algorithm for higher-order analysis of urban ...
8A_2_A containment-first search algorithm for higher-order analysis of urban ...GISRUK conference
 
7B_4_planning alerts for community maps
7B_4_planning alerts for community maps7B_4_planning alerts for community maps
7B_4_planning alerts for community mapsGISRUK conference
 
7B_1_Revealing the fuzzy geography of an urban locality
7B_1_Revealing the fuzzy geography of an urban locality7B_1_Revealing the fuzzy geography of an urban locality
7B_1_Revealing the fuzzy geography of an urban localityGISRUK conference
 

Plus de GISRUK conference (20)

5A_3_GIS based spatial modelling for improving the sustainability of aggregat...
5A_3_GIS based spatial modelling for improving the sustainability of aggregat...5A_3_GIS based spatial modelling for improving the sustainability of aggregat...
5A_3_GIS based spatial modelling for improving the sustainability of aggregat...
 
5A_1_Land evaluation techniques comparing fuzzy ahp with ideal point methods
5A_1_Land evaluation techniques comparing fuzzy ahp with ideal point methods5A_1_Land evaluation techniques comparing fuzzy ahp with ideal point methods
5A_1_Land evaluation techniques comparing fuzzy ahp with ideal point methods
 
4B_3_Automatically generating keywods for georeferenced imaged
4B_3_Automatically generating keywods for georeferenced imaged4B_3_Automatically generating keywods for georeferenced imaged
4B_3_Automatically generating keywods for georeferenced imaged
 
4B_1_How many volunteers does it take to map an area well
4B_1_How many volunteers does it take to map an area well4B_1_How many volunteers does it take to map an area well
4B_1_How many volunteers does it take to map an area well
 
4A_1_Uncertainty in the 2001 output area classification for the census of eng...
4A_1_Uncertainty in the 2001 output area classification for the census of eng...4A_1_Uncertainty in the 2001 output area classification for the census of eng...
4A_1_Uncertainty in the 2001 output area classification for the census of eng...
 
3A_4_Applying network analysis to quantify accessibility to urban greenspace ...
3A_4_Applying network analysis to quantify accessibility to urban greenspace ...3A_4_Applying network analysis to quantify accessibility to urban greenspace ...
3A_4_Applying network analysis to quantify accessibility to urban greenspace ...
 
3A_2_Modelling health-harming behaviours in a socially ranked geographic space
3A_2_Modelling health-harming behaviours in a socially ranked geographic space3A_2_Modelling health-harming behaviours in a socially ranked geographic space
3A_2_Modelling health-harming behaviours in a socially ranked geographic space
 
1A_3_A geodemographic classification of london primary schools
1A_3_A geodemographic classification of london primary schools1A_3_A geodemographic classification of london primary schools
1A_3_A geodemographic classification of london primary schools
 
UK Map Challenge Aidan Slingsby
UK Map Challenge   Aidan SlingsbyUK Map Challenge   Aidan Slingsby
UK Map Challenge Aidan Slingsby
 
SP_4 Supporting spatial negotiations in land use planning
SP_4 Supporting spatial negotiations in land use planningSP_4 Supporting spatial negotiations in land use planning
SP_4 Supporting spatial negotiations in land use planning
 
SP_3 Automatic identification of high streets and classification of urban lan...
SP_3 Automatic identification of high streets and classification of urban lan...SP_3 Automatic identification of high streets and classification of urban lan...
SP_3 Automatic identification of high streets and classification of urban lan...
 
9B_1_Trust in web gis a preliminary investigation of the environment agencys ...
9B_1_Trust in web gis a preliminary investigation of the environment agencys ...9B_1_Trust in web gis a preliminary investigation of the environment agencys ...
9B_1_Trust in web gis a preliminary investigation of the environment agencys ...
 
9A_2_Automatic classification of retail spaces from a large scale topographc ...
9A_2_Automatic classification of retail spaces from a large scale topographc ...9A_2_Automatic classification of retail spaces from a large scale topographc ...
9A_2_Automatic classification of retail spaces from a large scale topographc ...
 
9A_1_On automatic mapping of environmental data using adaptive general regres...
9A_1_On automatic mapping of environmental data using adaptive general regres...9A_1_On automatic mapping of environmental data using adaptive general regres...
9A_1_On automatic mapping of environmental data using adaptive general regres...
 
8B_4_Exploring the usability of geographic information
8B_4_Exploring the usability of geographic information8B_4_Exploring the usability of geographic information
8B_4_Exploring the usability of geographic information
 
8B_2_Using sound to represent uncertainty in address locations
8B_2_Using sound to represent uncertainty in address locations8B_2_Using sound to represent uncertainty in address locations
8B_2_Using sound to represent uncertainty in address locations
 
8B_1_A map to hear - use of sound in enhancing the map use experience
8B_1_A map to hear - use of sound in enhancing the map use experience8B_1_A map to hear - use of sound in enhancing the map use experience
8B_1_A map to hear - use of sound in enhancing the map use experience
 
8A_2_A containment-first search algorithm for higher-order analysis of urban ...
8A_2_A containment-first search algorithm for higher-order analysis of urban ...8A_2_A containment-first search algorithm for higher-order analysis of urban ...
8A_2_A containment-first search algorithm for higher-order analysis of urban ...
 
7B_4_planning alerts for community maps
7B_4_planning alerts for community maps7B_4_planning alerts for community maps
7B_4_planning alerts for community maps
 
7B_1_Revealing the fuzzy geography of an urban locality
7B_1_Revealing the fuzzy geography of an urban locality7B_1_Revealing the fuzzy geography of an urban locality
7B_1_Revealing the fuzzy geography of an urban locality
 

1A_2_Modelling the evolution of metropolitan London using historical GIS

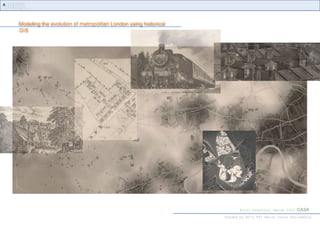
  • 1. Modeling the evolution of metropolitan London using historical GIS Kiril Stanilov, March 2010 CASA funded by EC’s FP7 Marie Curie Fellowship
  • 2. study area Greater London Kiril Stanilov, March 2010 CASA
  • 3. data Ordnance Survey County Series 1:2,500 1875 Kiril Stanilov, March 2010 CASA
  • 4. data Ordnance Survey County Series 1:2,500 1 : 10,000 1875 Kiril Stanilov, March 2010 CASA
  • 5. data Ordnance Survey County Series 1:2,500 1 : 2,500 1 : 10,000 1875 Kiril Stanilov, March 2010 CASA
  • 6. data Ordnance Survey County Series 1:2,500 1 : 2,500 1 : 10,000 1875 Kiril Stanilov, March 2010 CASA
  • 7. data Ordnance Survey County Series 1:2,500 1 : 2,500 1 : 10,000 1875 Kiril Stanilov, March 2010 CASA
  • 8. data Ordnance Survey County Series 1:2,500 1 : 2,500 1 : 10,000 1875 Kiril Stanilov, March 2010 CASA
  • 9. data Ordnance Survey County Series 1:2,500 1 : 2,500 1 : 10,000 1875 Kiril Stanilov, March 2010 CASA
  • 10. data Ordnance Survey County Series 1:2,500 1 : 2,500 1 : 10,000 1875 Kiril Stanilov, March 2010 CASA
  • 11. data Ordnance Survey County Series 1:2,500 1 : 2,500 1 : 10,000 1875 Kiril Stanilov, March 2010 CASA
  • 12. data Ordnance Survey County Series 1:2500 2005 1985 1960 1935 1915 1895 1875 Kiril Stanilov, March 2010 CASA
  • 13. Land use classification Kiril Stanilov, March 2010 CASA
  • 14. 1875-2005 residential development terraced housing semi -detached housing detached housing multi-family housing Kiril Stanilov, March 2010 CASA
  • 15. 1875 spatial structure 1875 development industrial uses Kiril Stanilov, March 2010 CASA
  • 16. 1895 spatial structure 1875 development 1875-95 development industrial uses Kiril Stanilov, March 2010 CASA
  • 17. 1915 spatial structure 1875 development 1875-95 development 1895-15 development industrial uses Kiril Stanilov, March 2010 CASA
  • 18. 1935 spatial structure 1875 development 1875-95 development 1895-15 development 1915-35 development industrial uses Kiril Stanilov, March 2010 CASA
  • 19. 1960 spatial structure 1875 development 1875-95 development 1895-15 development 1915-35 development 1935-60 development industrial uses Kiril Stanilov, March 2010 CASA
  • 20. 1985 spatial structure 1960-85 development 1875 development industrial uses 1875-95 development 1895-15 development 1915-35 development 1935-60 development Kiril Stanilov, March 2010 CASA
  • 21. 2005 spatial structure 1960-85 development 1875 development 1985-05 development 1875-95 development industrial uses 1895-15 development 1915-35 development 1935-60 development Kiril Stanilov, March 2010 CASA
  • 22. 1875 - 2005 land development patterns nucleation 1875 - 95 1895 - 15 diffusion 1915 - 35 1935 - 60 infill 1985 - 05 1960 - 85 Kiril Stanilov, March 2010 CASA
  • 23.
  • 24. distance to suburban centres
  • 25. distance to main roads
  • 26. distance to rail stations
  • 27. neighborhood influence1985 - 05 1960 - 85 Kiril Stanilov, March 2010 CASA
  • 28. 1875 Distance to roads - arterial developed land arterial roads Kiril Stanilov, March 2010 CASA
  • 29. 1875 Distance to roads - connector developed land connector roads Kiril Stanilov, March 2010 CASA
  • 30. distance to cbd residential 1915-35 Kiril Stanilov, March 2010 CASA
  • 31. distance to cbd residential 1915-35 Kiril Stanilov, March 2010 CASA
  • 32. distance to cbd residential 1915-35 Kiril Stanilov, March 2010 CASA
  • 33. 1875 Distance to rail stations residential commercial rail station Kiril Stanilov, March 2010 CASA
  • 34. 1895Distance to rail stations residential commercial rail station Kiril Stanilov, March 2010 CASA
  • 35. 1915Distance to rail stations residential commercial rail station Kiril Stanilov, March 2010 CASA
  • 36. 1935Distance to rail stations residential development 1915-35 rail station Kiril Stanilov, March 2010 CASA
  • 37. 1935Distance to rail stations residential 1915-35 developed land 1915 rail station Kiril Stanilov, March 2010 CASA
  • 38. 1915 accessibility distance to arterial roads distance to connector roads distance to rail stations distance to rail stations Kiril Stanilov, March 2010 CASA
  • 39. Identification of suburban centres residential commercial Kiril Stanilov, March 2010 CASA
  • 40. 1875 accessibility rail station tram line Kiril Stanilov, March 2010 CASA
  • 41. 1875 accessibility rail station tram line Kiril Stanilov, March 2010 CASA
  • 42. modeling urban land use 2005 1875 Kiril Stanilov, March 2010 CASA
  • 43. Conclusions 1875 Kiril Stanilov, March 2010 CASA
  • 44. Conclusions Kiril Stanilov, March 2010 CASA
  • 45. Conclusions Kiril Stanilov, March 2010 CASA
  • 46. Conclusions modeled actual 1895 Kiril Stanilov, March 2010 CASA
  • 47. Conclusions modeled actual 1895 1915 Kiril Stanilov, March 2010 CASA
  • 48. Conclusions modeled actual 1895 1915 1935 Kiril Stanilov, March 2010 CASA
  • 49. Conclusions modeled actual 1895 1915 1935 1960 Kiril Stanilov, March 2010 CASA
  • 50. Conclusions modeled actual 1895 1915 1935 1960 1985 Kiril Stanilov, March 2010 CASA
  • 51. Conclusions modeled actual 1895 1915 1935 1960 1985 2005 Kiril Stanilov, March 2010 CASA

Notes de l'éditeur

  1. Case study of metropolitan growthUsing hi-res historical parcel level data